Key points
- Inflation is falling from its 2022 highs across advanced economies. But, it’s still well above central bank inflation targets.
- Lower goods inflation reflects an improvement in supply-chain backlogs, falling goods demand and lower commodity prices. Services inflation is lagging changes to goods prices.
- Now, a key driver of inflation in advanced countries remains the ultra-tight labour markets, especially in the US. Lower job demand and/or an increase in the supply of labour will lower wages growth.
- We expect a slowing in services inflation in 2023, as goods prices fall further and as labour markets weaken. We think inflation will surprise to the downside in 2023.
Introduction
The anticipated fall in inflation is occurring across the advanced world, thanks to a decline in commodity prices and slowing in goods inflation. But, sticky services inflation is keeping the overall rate of inflation elevated and well above central bank inflation targets. We go through recent inflation issues in this Econosights.
The recent trends in inflation
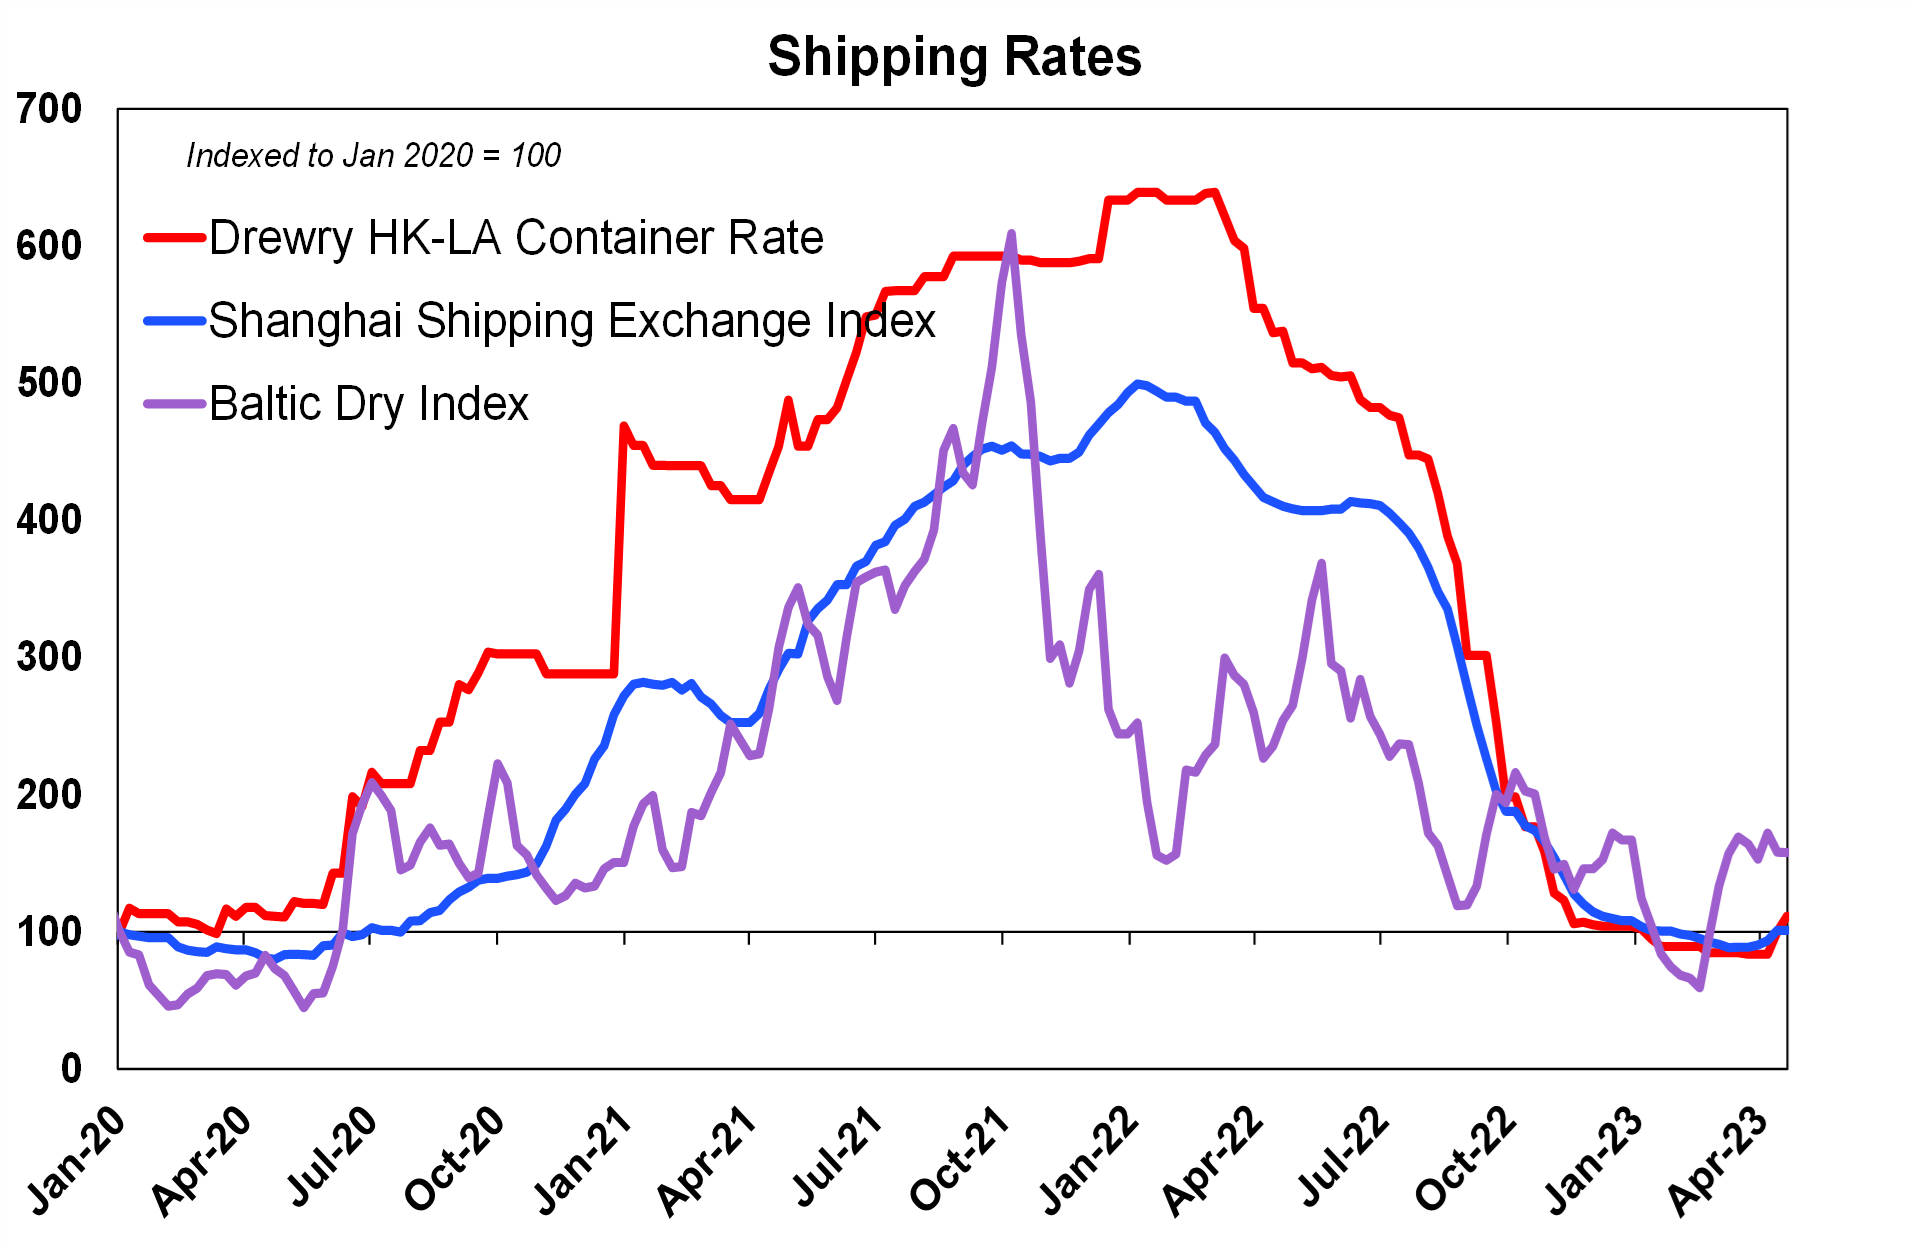
There are many moving parts in the current inflation story because there have been both supply and demand driven elements to price changes since the pandemic. A lot of the supply-driven inflation has now abated because the Covid-19 supply related disruptions are ancient history as consumer demand has shifted from goods back to services, lockdowns have ended and global travel restrictions have mostly ceased. For example, global shipping rates have normalised (see the chart below) after reaching ultra-high levels in 2022.
Source: Bloomberg, AMP
Commodity prices also added to inflation significantly in 2022. While prices have fallen back a lot, especially for energy, many commodity prices are still elevated compared to pre-Covid levels and food prices remain high.
While supply chains issues have been resolved and commodity prices are below 2022 levels, consumer goods inflation has not fallen as far as expected. In our view, it is just a matter of time until lower goods inflation feeds through into services prices which is what usually tends to happen throughout history.
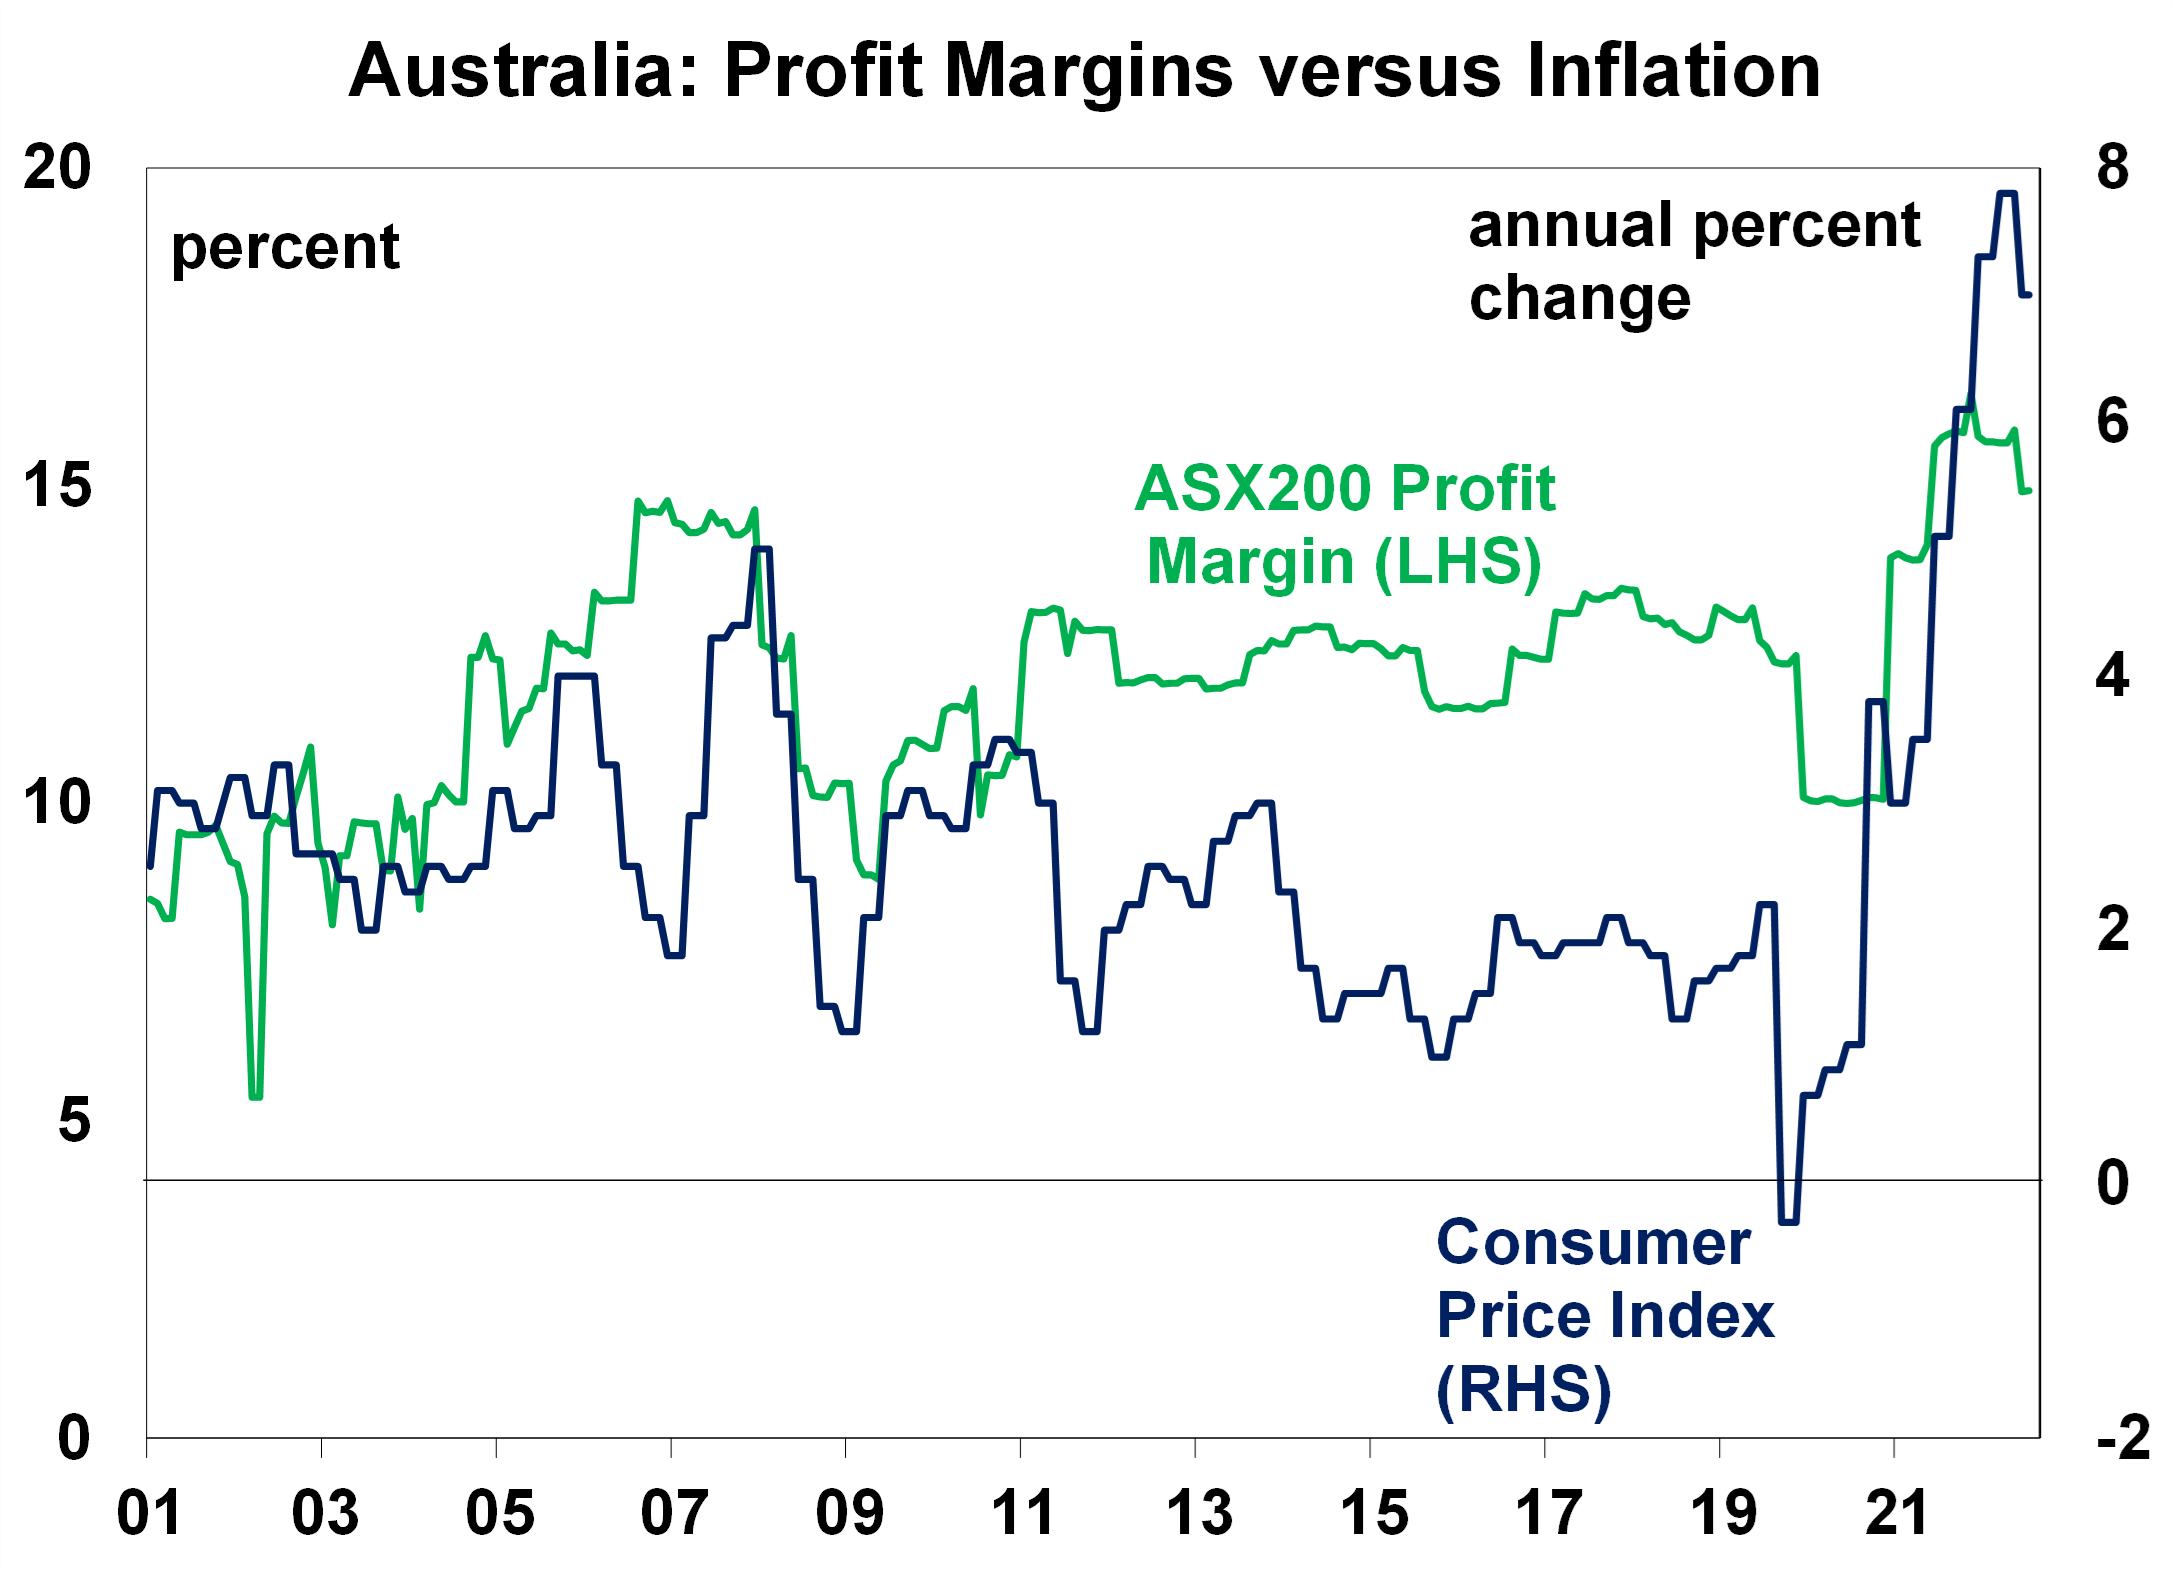
However, some commentators have suggested that ongoing high inflation reflects “greedflation” or “excuseflation” from companies who are using the excuse of the pandemic to continually lift prices and profit margins. As consumers have been in good shape thanks to high household savings, they have taken on additional price rises (albeit despondently) after years of low inflation. If this were occurring, it would be evident in profit margins. Corporate profit margins have increased (see the chart below fpr Australia) significantly over 2021-22 from around 10% to over 15% but are now declining and have moved in tandem with inflation so it doesn’t look like ballooning profit margins and greedy companies are the only reason behind persistently high inflation.
Source: Bloomberg, AMP
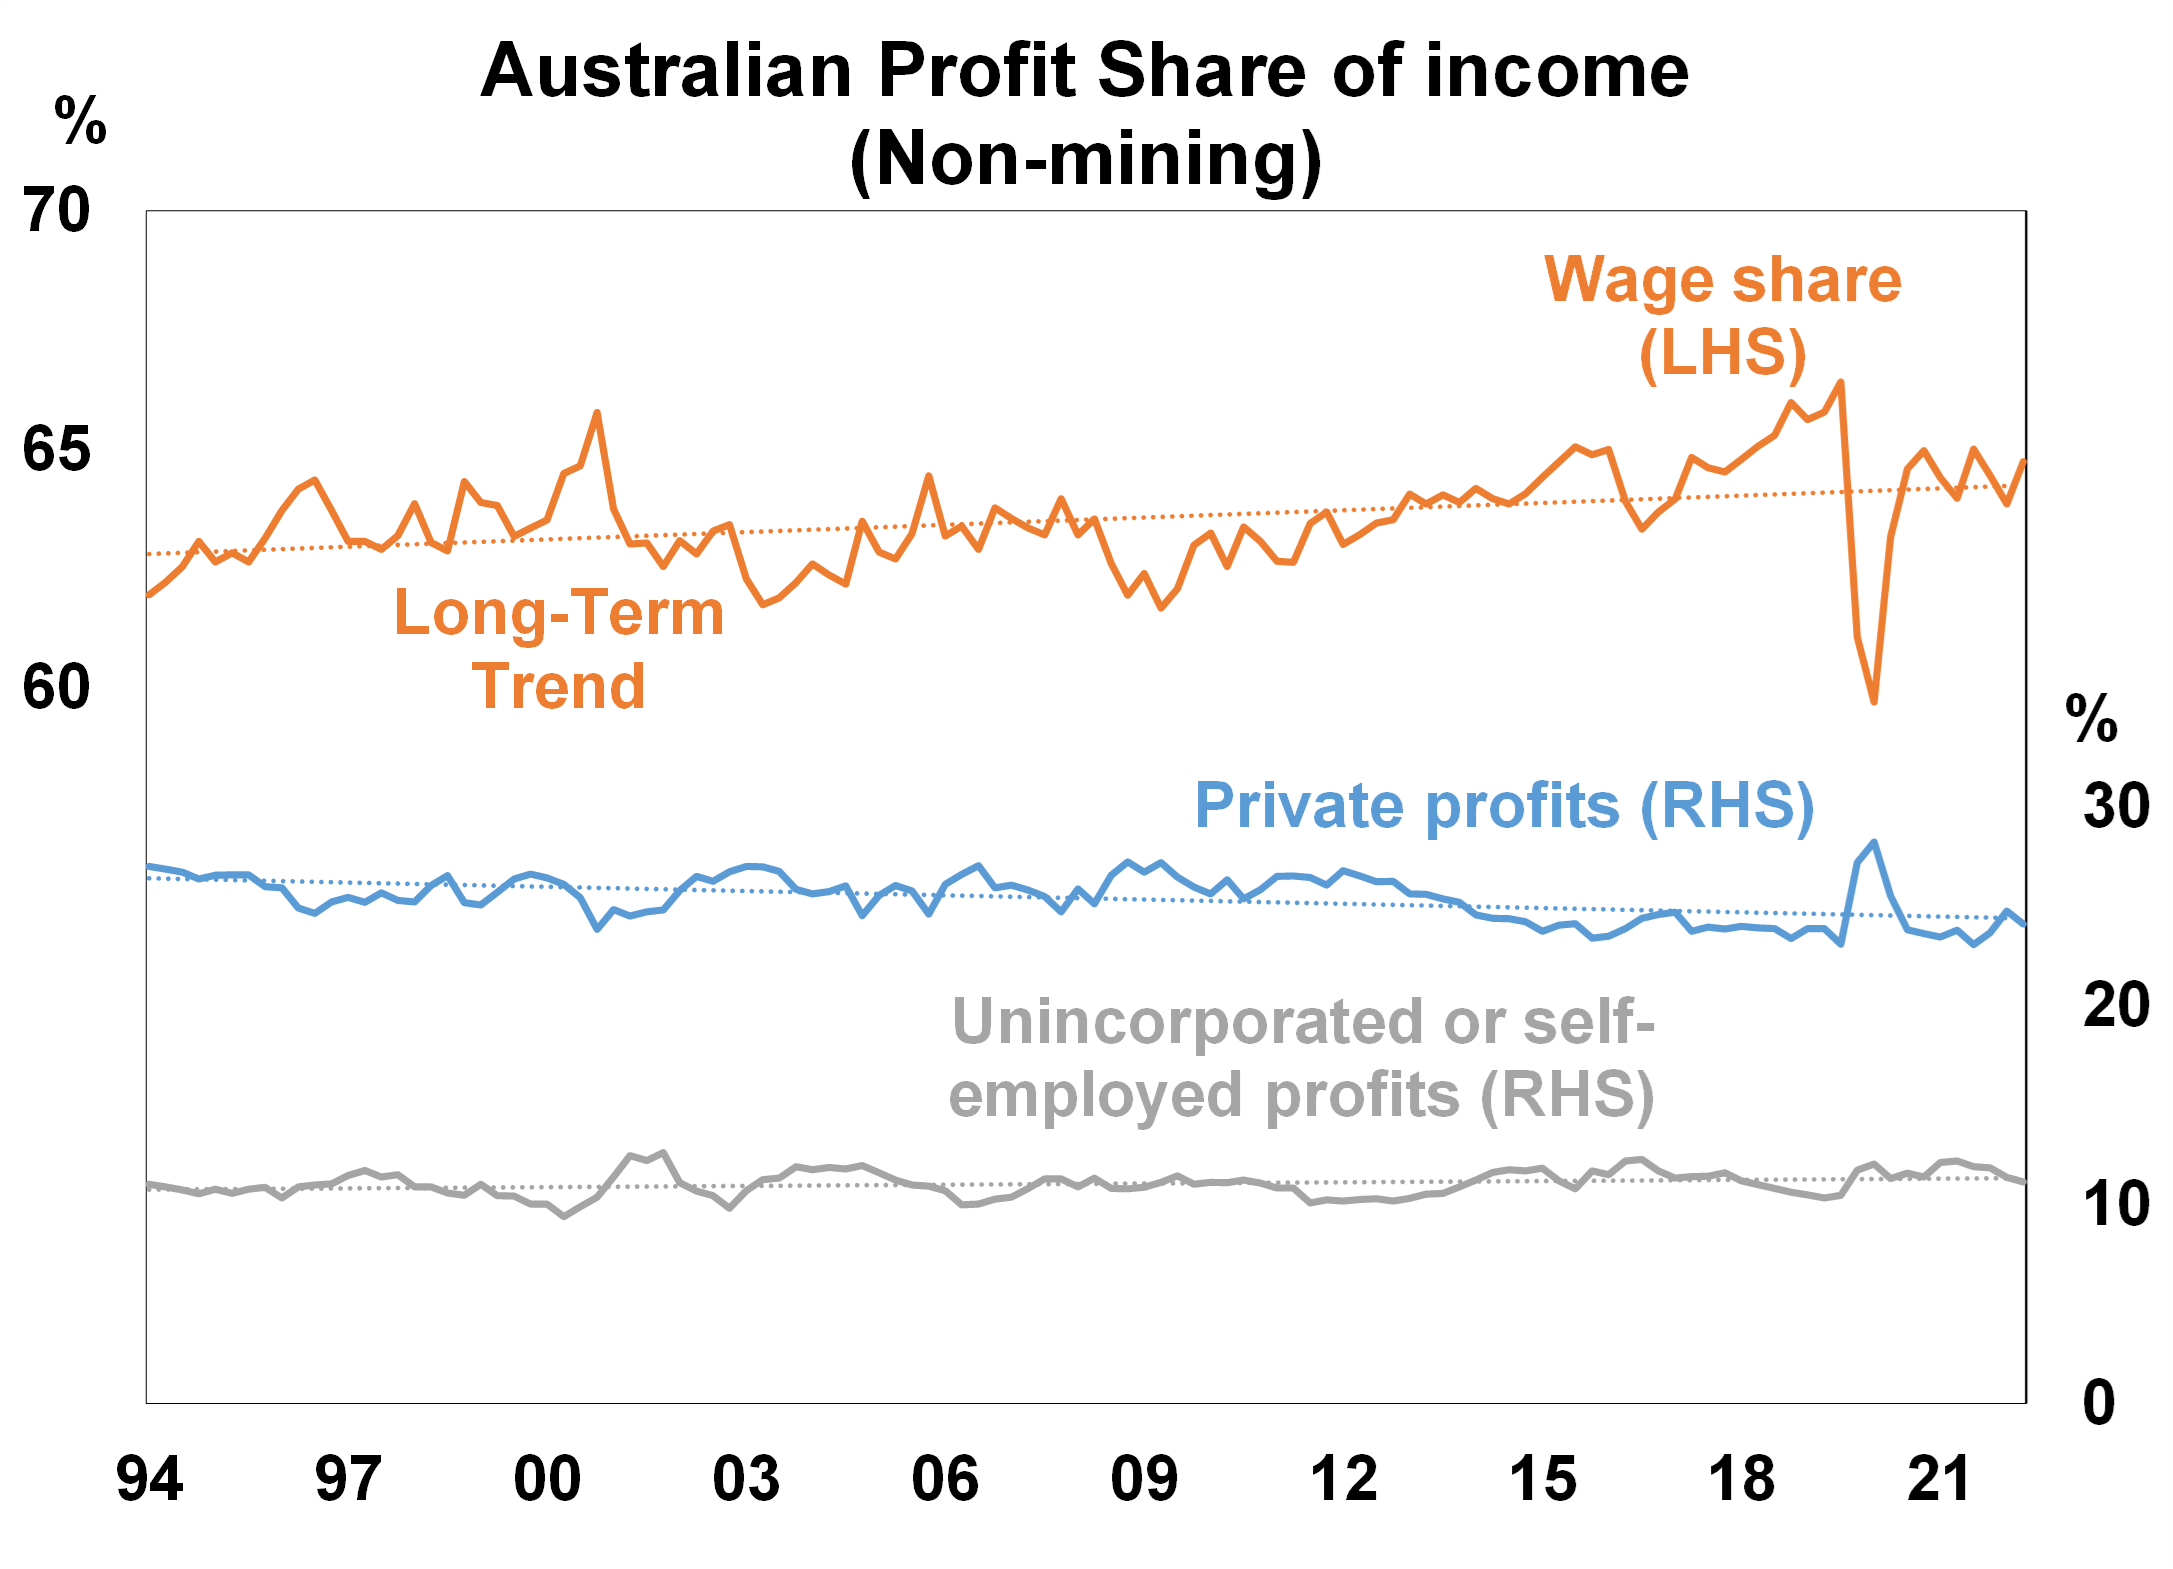
Excess corporate profits would also show up in the employee and business profit share of national profits. But in Australia, it is not clear that business profits have been rising to the detriment of consumers when you exclude mining profits (which is done because mining profits rose significantly from record commodity prices but are only a small employer). The employee share of total “factor income” (which is the sum of total employee wages and business profits) has ranged in a narrow band of 62%-65% from 1994 until 2022. At the same time, private corporate profits have ranged between 24%-27% (over this time) and unincorporated income (self-employed profits) have averaged 11%-12% which shows a long-term stability in profits (see the chart below) across all sectors. So overall, there is not enough evidence that excess corporate profits are leading to higher inflation.
Source: Bloomberg, AMP
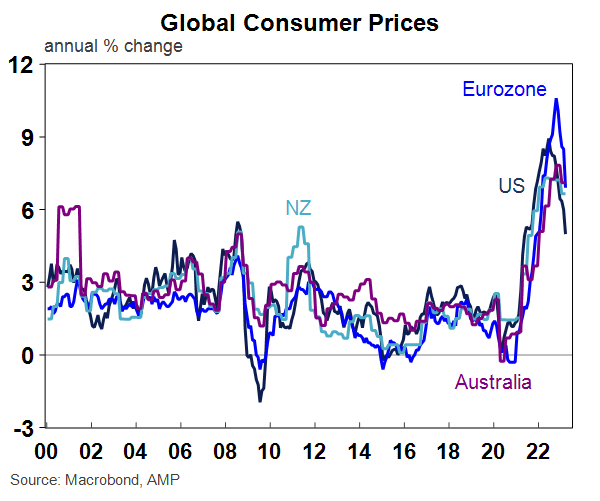
Not all countries have an inflation problem. The recent reading of China’s consumer price inflation was up by just 0.7% over the year to March. China had a lift in inflation over 2022, to 2.8% in late 2022 driven by similar pandemic-related factors as the rest of the world but inflation has fallen back since then as lockdowns across major cities in 2021 lowered consumer demand.
Source: Macrobond, AMP
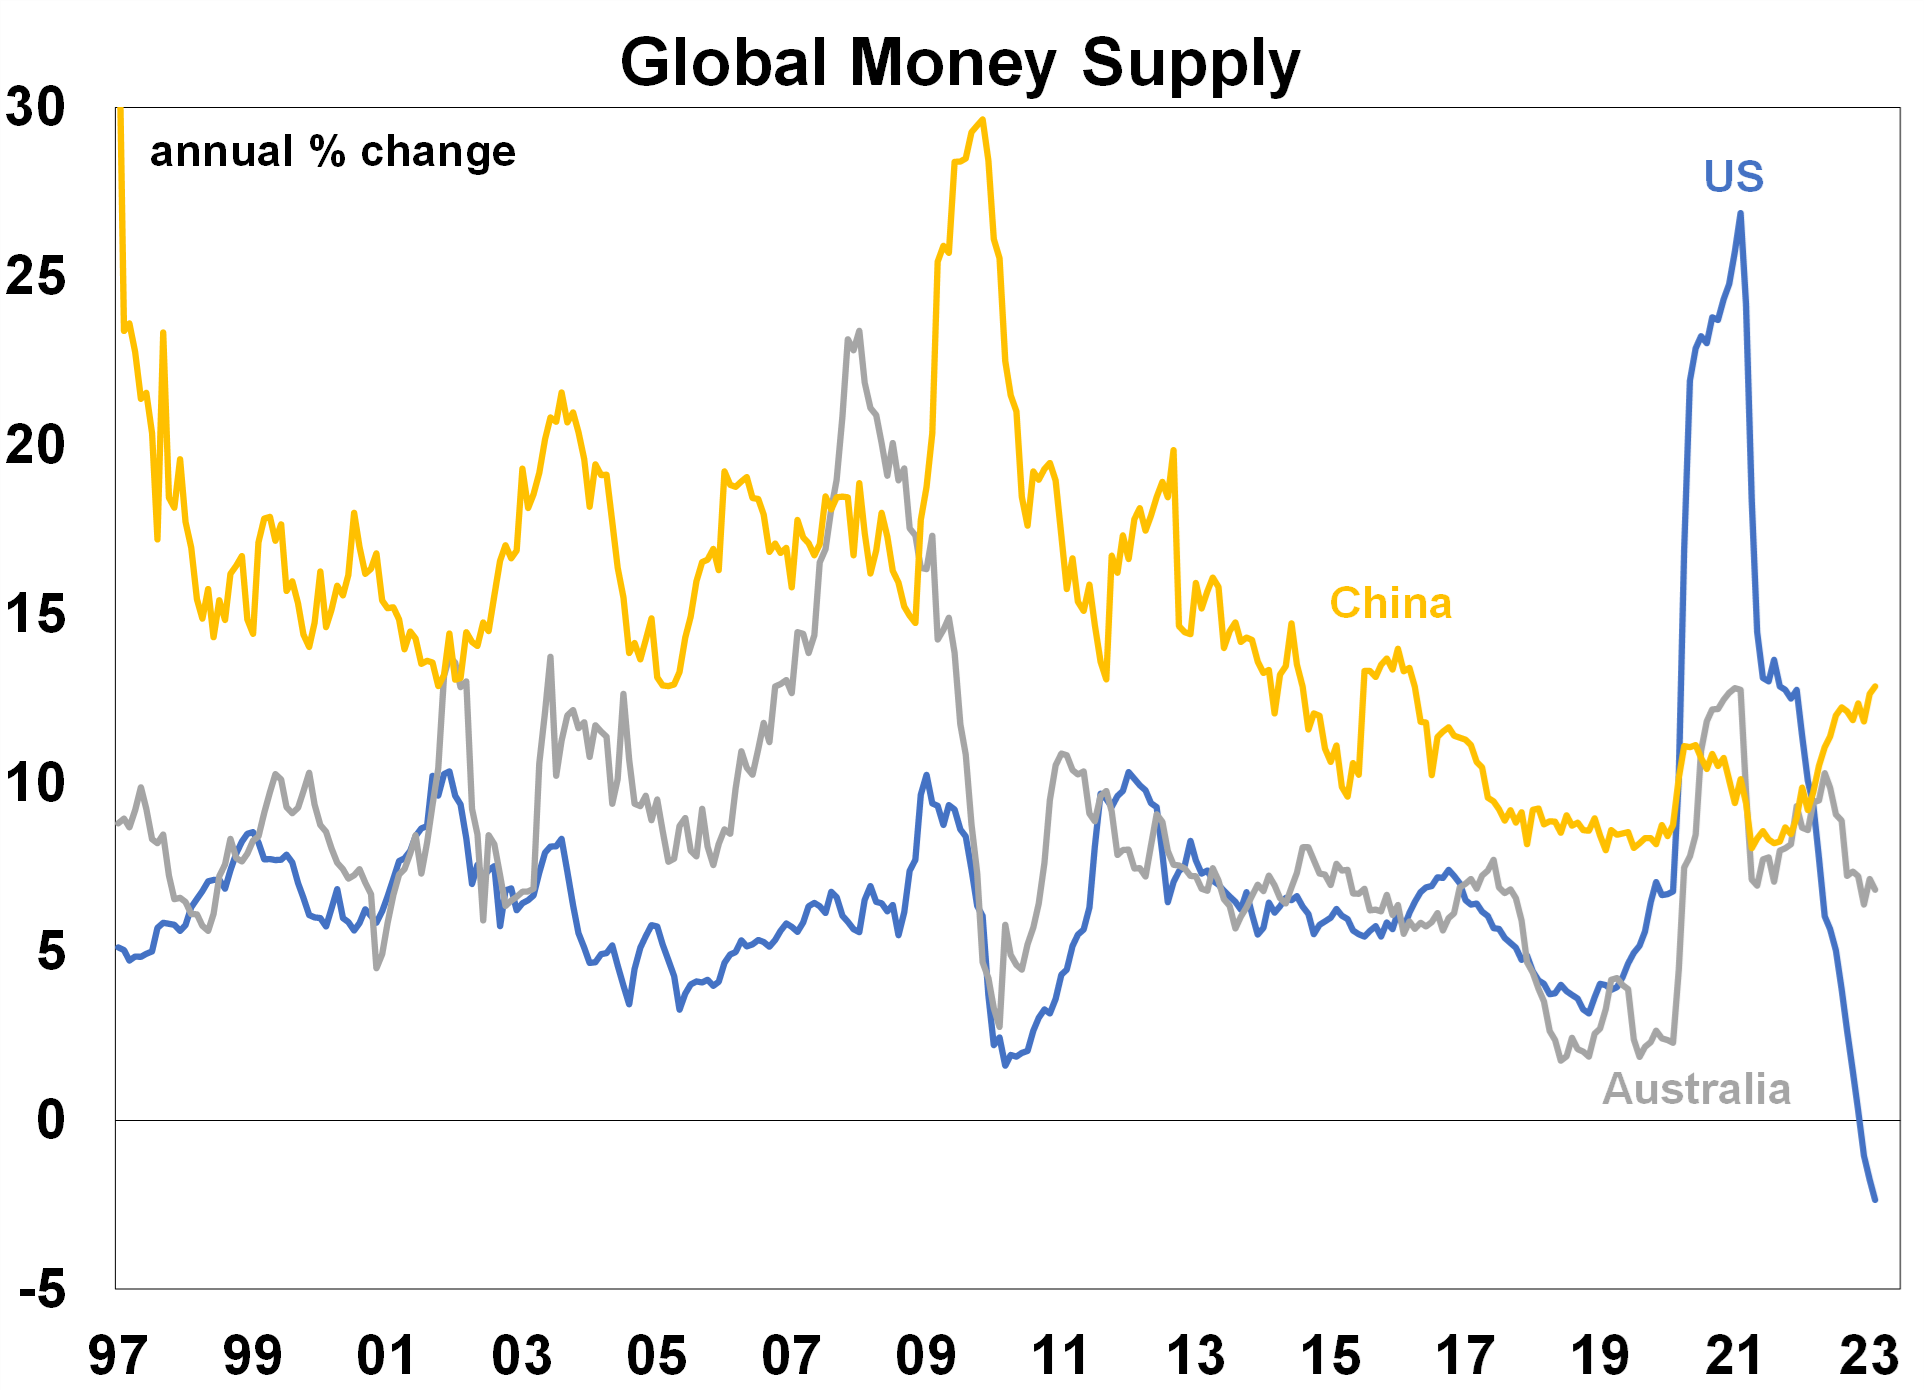
Another reason for lower Chinese inflation through 2021/22 was because China had lower money supply growth relative to the major advanced economies (see the chart below) which reflects lower levels of monetary and fiscal stimulus done through the pandemic. Although, money supply growth in China is now rising (while in countries like Australia and the US it is declining) as policymakers try to stimulate the Chinese economy which could add to higher inflation in China through 2023.
Source: Bloomberg, AMP
The easing in China’s recent inflation readings shows that ongoing high inflation across the advanced economies reflect domestic issues, rather than supply-chain related or high commodity prices, which affect the global market.
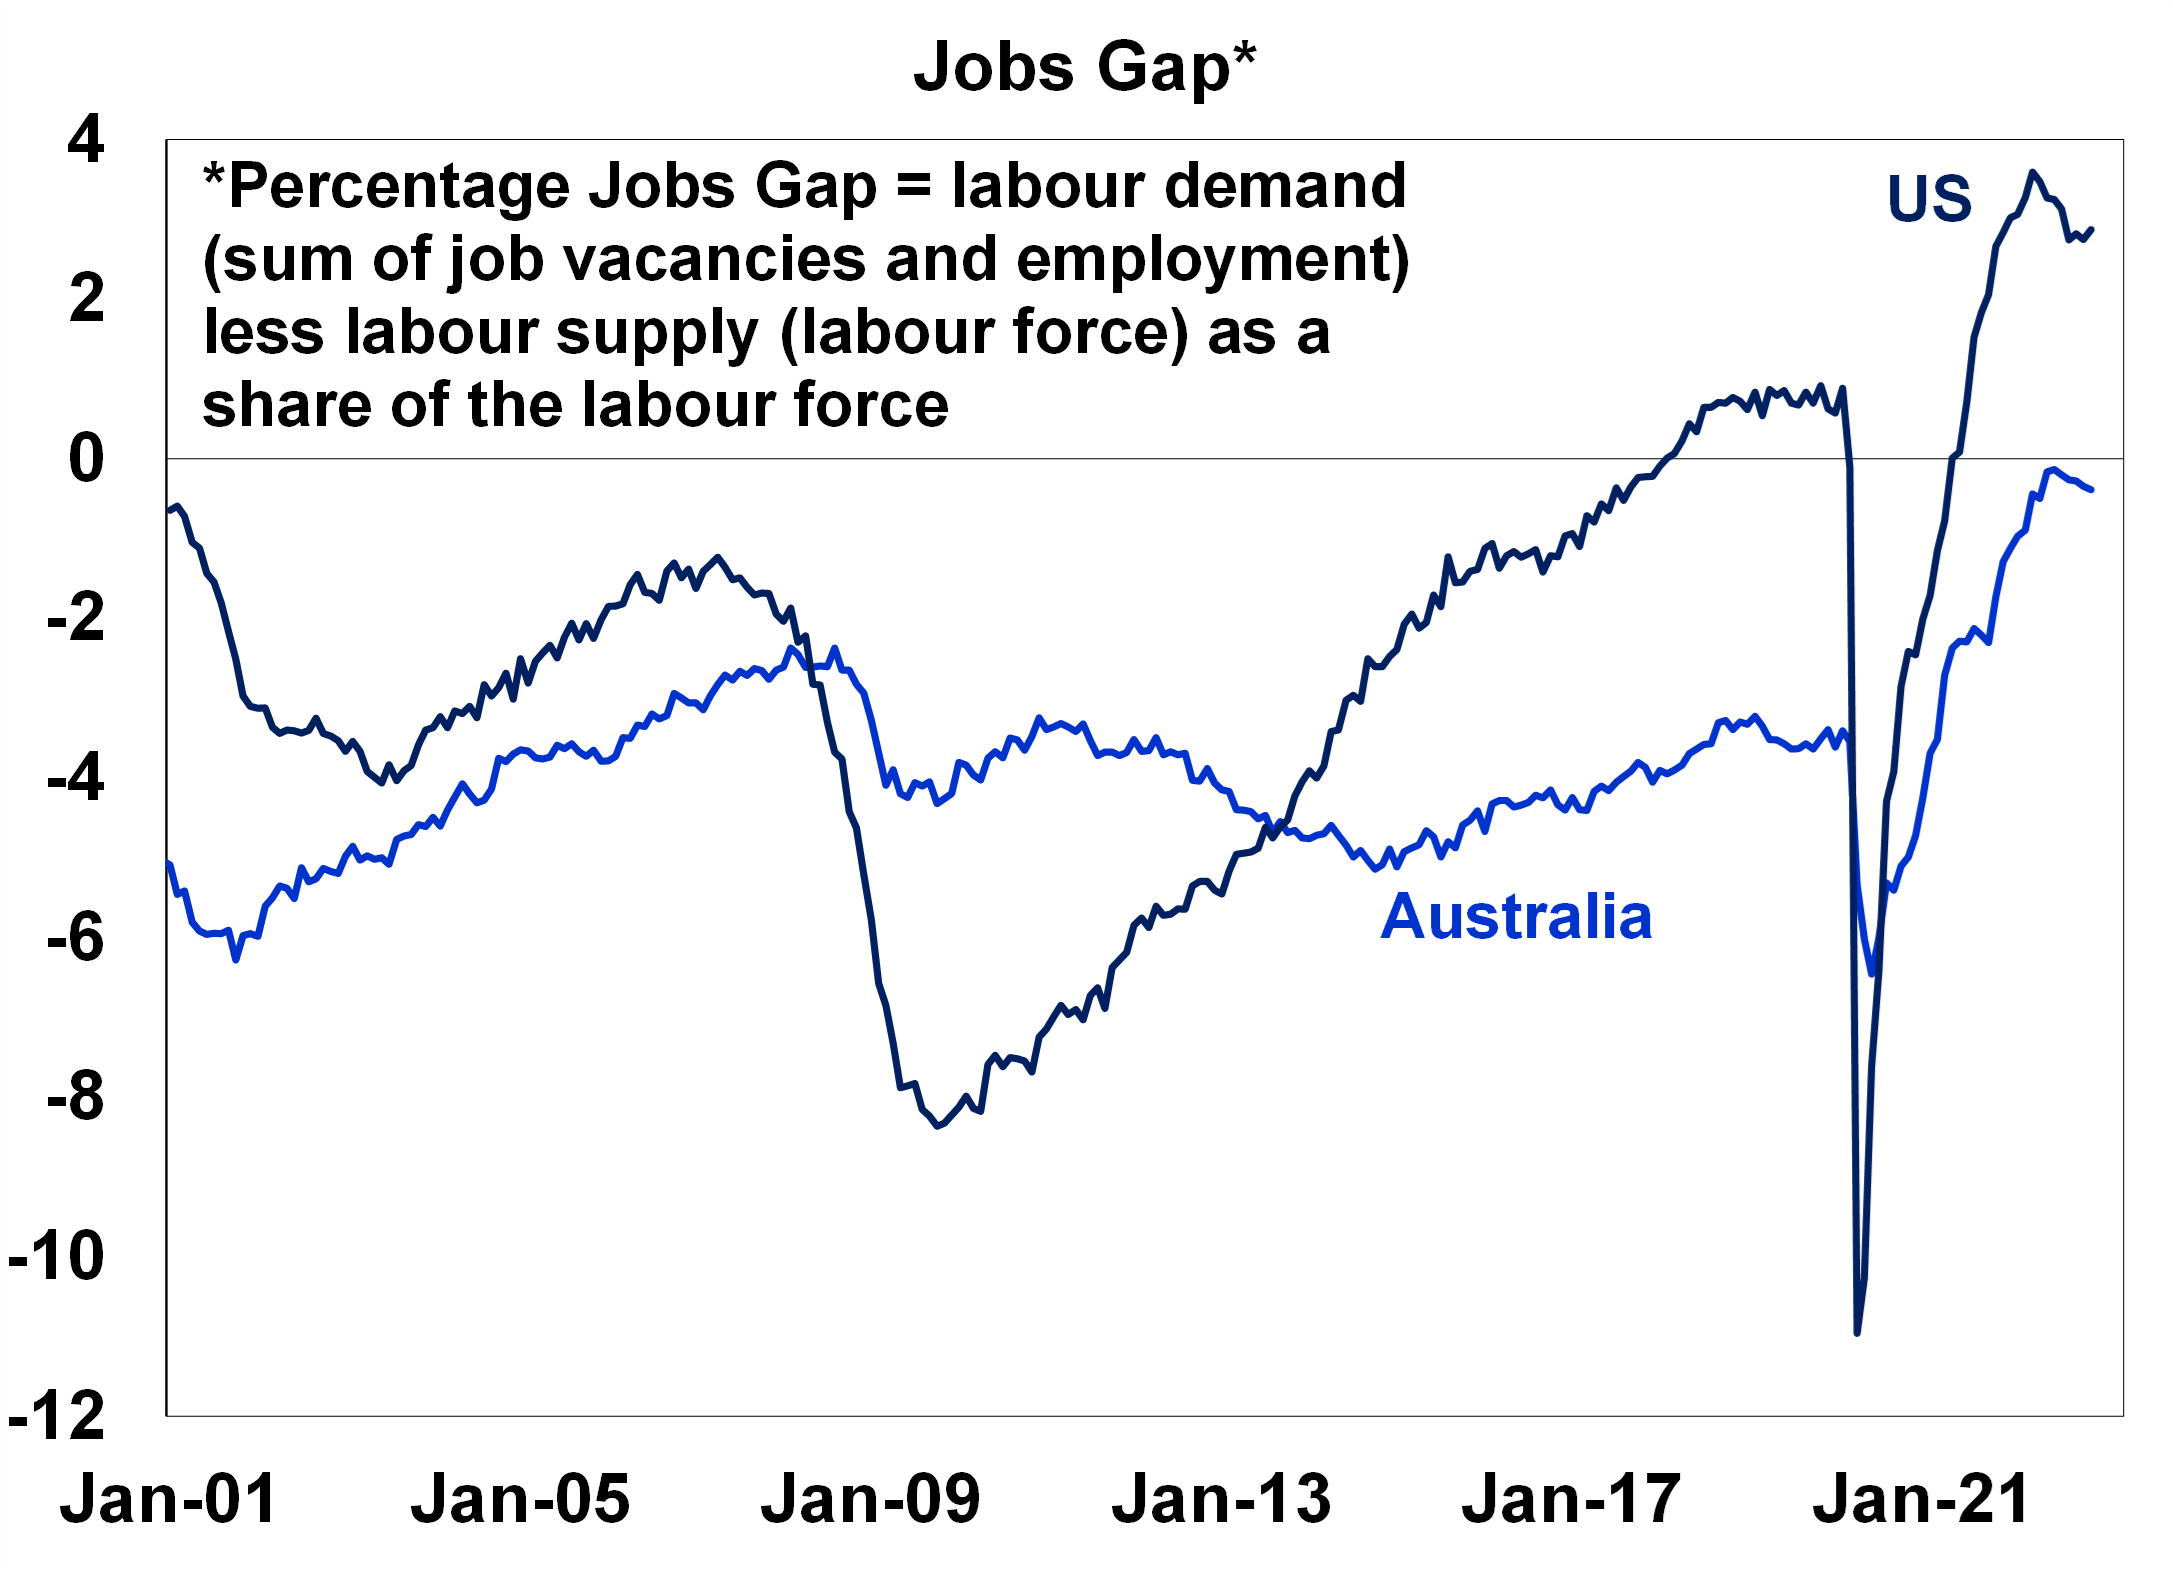
The inflation problem in advanced economies is now being driven by services inflation, predominately because of tight labour markets (some countries like the US and Australia also have high housing prices from elevated rents which is adding to services inflation). The chart below looks at the “jobs gap” which is the difference between labour demand and supply as a share of the labour force. When the jobs gap is positive, labour demand (job vacancies plus employment) is higher than labour supply, which adds to wages growth. In Australia, the jobs gap has been trending around zero recently for the first time in over 40 years, which has put upward pressure on wages. But it has been lower compared to the US because Australia had a big rise in its labour supply over 2022, with the participation rate going to a record high. A larger jobs gap in the US also reflects much higher wages growth (6.4% per annum in the US versus 3.4% in Australia). In China, labour demand has not been as high, with recent data suggesting that the youth unemployment rate remains very elevated at just under 20%. The jobs gap needs to decrease and become negative to see wages growth slow. This could be achieved through lower employment and job openings growth which is now starting to occur.
Source: Bloomberg
Conclusion
There are still some upside risks for inflation, especially in areas related to services. High rental growth is an upside risk for Australian inflation, particularly as immigration has been higher than expected which is increasing demand for housing. And wages growth could surprise higher, especially if award and minimum wage agreements are lifted by the rate of inflation (which will be decided in June) and as public sector wage caps are currently being increased across the state governments.
But, given the slowing in goods inflation, signs of a weakening in job openings and employment demand and high recession/downturn risks services inflation should weaken this year and we anticipate that inflation will be lower than most are expecting by the end of the year.

Weekly market update 19-04-2024
19 April 2024 | Blog Dr Shane Oliver comments on the correction time for shares; escalation risk in Israel's counter-retaliation; rate cut delays but inflation still falling ex US; supply boost helping cool Aust labour market; expect Aust Q1 CPI to slow to 3.4%yoy; and more. Read more
Econosights - does the Federal Reserve have to cut rates first?
17 April 2024 | Blog In this Econosights we look at whether the US Federal Reserve will be the first major central bank to cut interest rates in this cycle. Read moreWhat you need to know
While every care has been taken in the preparation of this article, neither National Mutual Funds Management Ltd (ABN 32 006 787 720, AFSL 234652) (NMFM), AMP Limited ABN 49 079 354 519 nor any other member of the AMP Group (AMP) makes any representations or warranties as to the accuracy or completeness of any statement in it including, without limitation, any forecasts. Past performance is not a reliable indicator of future performance. This document has been prepared for the purpose of providing general information, without taking account of any particular investor’s objectives, financial situation or needs. An investor should, before making any investment decisions, consider the appropriateness of the information in this document, and seek professional advice, having regard to the investor’s objectives, financial situation and needs. This article is solely for the use of the party to whom it is provided and must not be provided to any other person or entity without the express written consent AMP. This article is not intended for distribution or use in any jurisdiction where it would be contrary to applicable laws, regulations or directives and does not constitute a recommendation, offer, solicitation or invitation to invest.
The information on this page was current on the date the page was published. For up-to-date information, we refer you to the relevant product disclosure statement, target market determination and product updates available at amp.com.au.


