


Weekly market update
Investment markets and key developments
Dr Shane Oliver comments on the correction time for shares; escalation risk in Israel's counter-retaliation; rate cut delays but inflation still falling ex US; supply boost helping cool Aust labour market; expect Aust Q1 CPI to slow to 3.4%yoy; and more.
12 min read

Global and Australian shares fell again over the last week on the back of concerns about an escalation of the war in the Middle East (as Iran attacked Israel and then Israel retaliated), US Fed officials added to expectations for a delay in rate cuts and on the back of worries about US tech stock earnings ahead of earnings reports in the week ahead. While fears of an escalation in the Israel/Iran conflict receded on Friday after Israel’s limited response to Iran’s symbolic attack on Israel a week ago, US and Eurozone shares continued to fall anyway with US shares down 3% for the week and Eurozone shares down 0.9%. Japanese shares fell 6.2% for the week having gone up a lot more than other markets. But Chinese shares managed a 1.9% gain helped by better-than-expected economic data. Reflecting the poor global lead Australian shares fell 2.8% for the week with broad based declines. Bond yields rose further in the US and Europe, on the back of expectations that US interest rates will remain high for longer, but Australian bond yields fell slightly. Despite a bit of volatility on the back of turmoil in the Middle East, oil prices actually fell slightly helped by rising US stockpiles. Metal and copper prices pushed higher not confirming the negative growth message from falling share markets. Iron ore prices also continued to recover from their recent fall. The gold price rose to a new record high, partly helped by safe haven demand, but Bitcoin fell suggesting it’s not always a reliable safe haven substitute for gold and is acting more like a high beta version of shares at present. The $A fell to just above $US0.64 as the $US rose.
Correction time for shares? The huge gains in share markets since their October lows left them technically overbought with stretched valuations and high levels of investor optimism which left them vulnerable to a bout of volatility or a correction which now appears to be unfolding with concerns around US inflation and interest rates and fears of an escalation in the war in the Middle East threatening global oil supplies providing the trigger. From their recent highs global and Australian shares have fallen by around 4 to 5% and the short-term risks remain tilted towards further falls. The last correction played out over three months into last October and saw shares fall by 9 to 10%. However, we are inclined to see the current moves as a correction rather than something deeper and continue to see further gains in shares this year once the correction is over as inflation slows, central banks still cut interest rates and recession is avoided or proves mild.
Israel/Iran escalation averted? Iran's 13 April retaliatory missile attack on Israel was well flagged and caused minimal damage and looked designed not to escalate things too badly. And Israel's 19 April counter-retaliatory attack was modest causing little damage suggesting that Israel has chosen not to escalate, likely under US and European influence. Iran has also downplayed the attack and signalled no further retaliation. So, the crisis may be averted for now. Of course, the risks remain high with Iranian proxy attacks likely continuing and Israel at high risk of taking action against Iranian nuclear capabilities at some point. But at least the threat of a major disruption to global oil supplies looks to have been averted for now.
Fed rate cut delays remain a key focus for markets. Fed Chair Powell basically confirmed the less dovish outlook for interest rates that markets had already priced in with Powell indicating that inflation data has not provided the Fed with the greater confidence it wants and so it’s appropriate to leave rates high for longer. Interestingly, there was nothing from Powell suggesting higher rates - he doesn’t see the economy overheating but still sees the labour market moving into better balance and wages moderating helped by a boost in supply from immigration and rising workforce participation. Our base case remains for the first cut to come in September, although a July move is still possible.
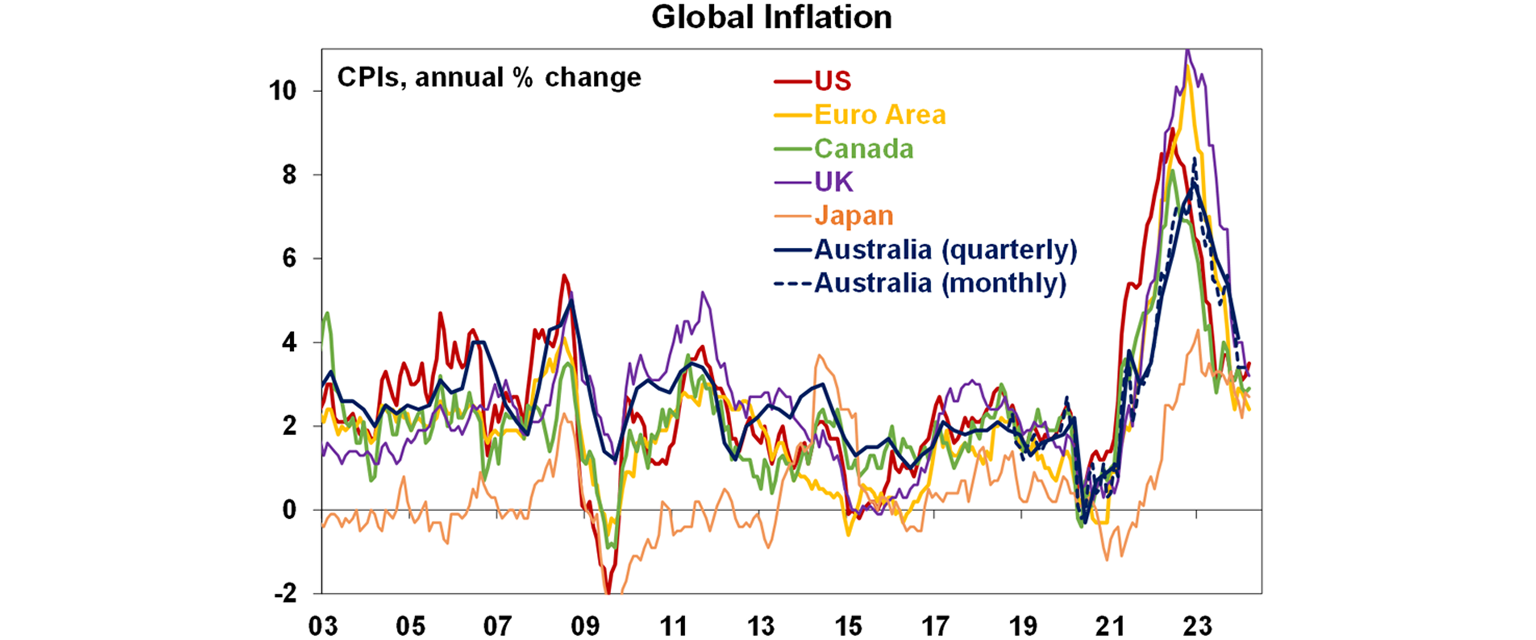
However, the news regarding other countries in relation to inflation and central banks has been more mixed, highlighting the potential for a divergence with the Fed. The UK, NZ, Japan and Canada all saw further falls in underlying inflation in March. In the UK and NZ there are still concerns about high services inflation so rate cuts there look unlikely until around August or October and Japan has barely started with rate hikes. But in Canada a rate cut is looking probable in June with BoC Governor Macklem commenting that “we don’t have to do what the Fed does…we do what Canada needs.”
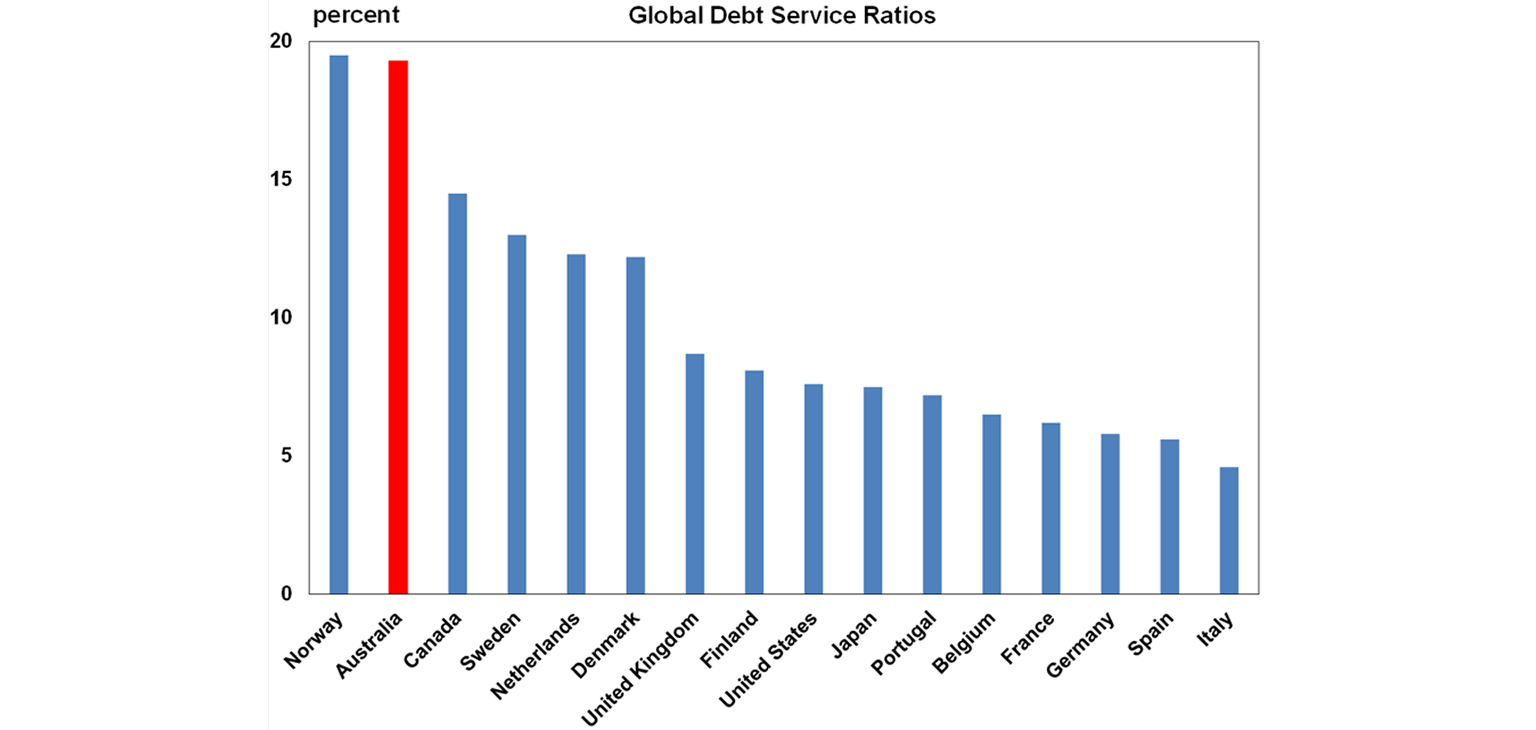
Similarly for the RBA – it doesn’t have to do what the Fed does! The combination of continuing economic growth, the still tight labour market and sticky services inflation mean that the RBA, like the Fed, is in no hurry to cut and that there is a very high risk that our expectation for rate cuts from around mid-year is too optimistic and that cuts won’t come till later this year. However, the RBA has not always just followed the Fed – after the GFC it started hiking in 2009 when the Fed was on hold near zero and the RBA was cutting and holding rates when the Fed was hiking over the 2015 to 2018 period. And right now, the Australian economy is far weaker than the US – with GDP growth less than half the US pace and consumer spending far weaker. As can be seen in the next chart the rise in interest rates over the last two years has had a far more negative impact on Australian than US households with debt servicing taking up nearly 20% of household income here compared to around 7.5% in the US. The reason is that household debt to income ratios are much higher here and average mortgage rates actually paid on outstanding housing debt have gone up by more than 3 percentage points in Australia compared to only about 0.5 percentage points in the US thanks to 95% of US mortgages being multi-decade fixed rates. So, the RBA starting to cut before the Fed may turn out to be justified, particularly if inflation data in the next week continues to show a further decline at a faster pace than the RBA is forecasting.
Trump is near! - US/China trade war ramping up again. After a few years of relative quiet but with President Biden largely maintaining the Trump era tariffs on China, he has now called for a tripling in tariffs on certain Chinese steel and aluminium imports to the US (from 7.5% to 25%). The direct impact on China and hence any flow on to Australia and more generally the US and global economies will be minimal as China only accounts for 1% of US steel supply and 3.6% of US aluminium imports. However, the populist protectionist move is clearly aimed at shoring up Biden’s support in key industrial states like Pennsylvania that he needs to win in the coming election. Further tariff hikes are likely in the run up to the election, eg on Chinese EVs and the US moves runs the risk that other countries will follow with tariffs on Chinese products. This is nothing compared to Trump’s talk of a 60% tariff on Chinese imports. But its yet again more evidence that globalisation is in retreat with protectionism on the rise (evident in Australia too with “Further Made in Australia”) which will result in a slightly more inflation prone world, higher than otherwise interest rates and lower than otherwise price to earnings ratio on shares over time.
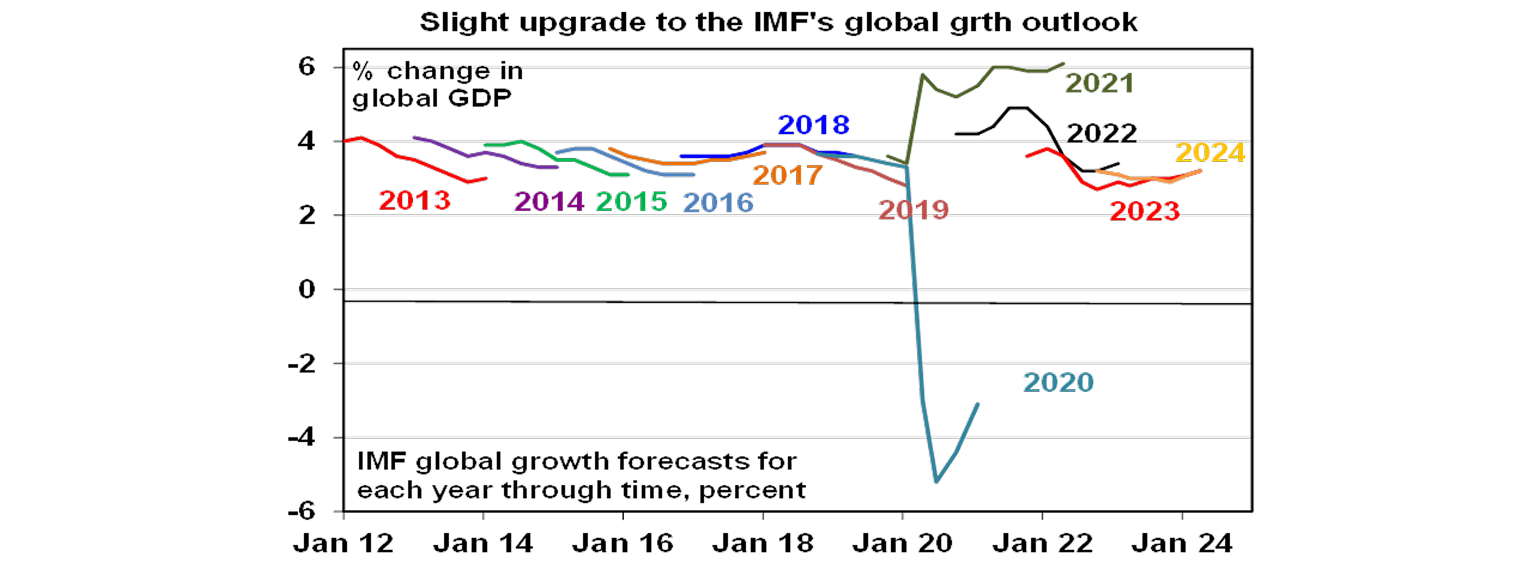
The IMF revised up slightly its global growth outlook. Reflecting the unexpected resilience of the global economy, the IMF again revised up its global growth forecasts for 2024 to 3.2%, which is the same as 2023 turned out to be. The upgrade was mainly due to stronger US growth though (at 2.7%) with other advanced countries including Europe, Japan, Canada and Australia far softer. The IMF’s 2025 forecast was unchanged at 3.2%. That pace of growth is pretty much what was seen in the pre-Covid period.
Economic activity trackers
Our Economic Activity Trackers are still not showing anything decisive, but they have fallen over the last week.
Major global economic events and implications
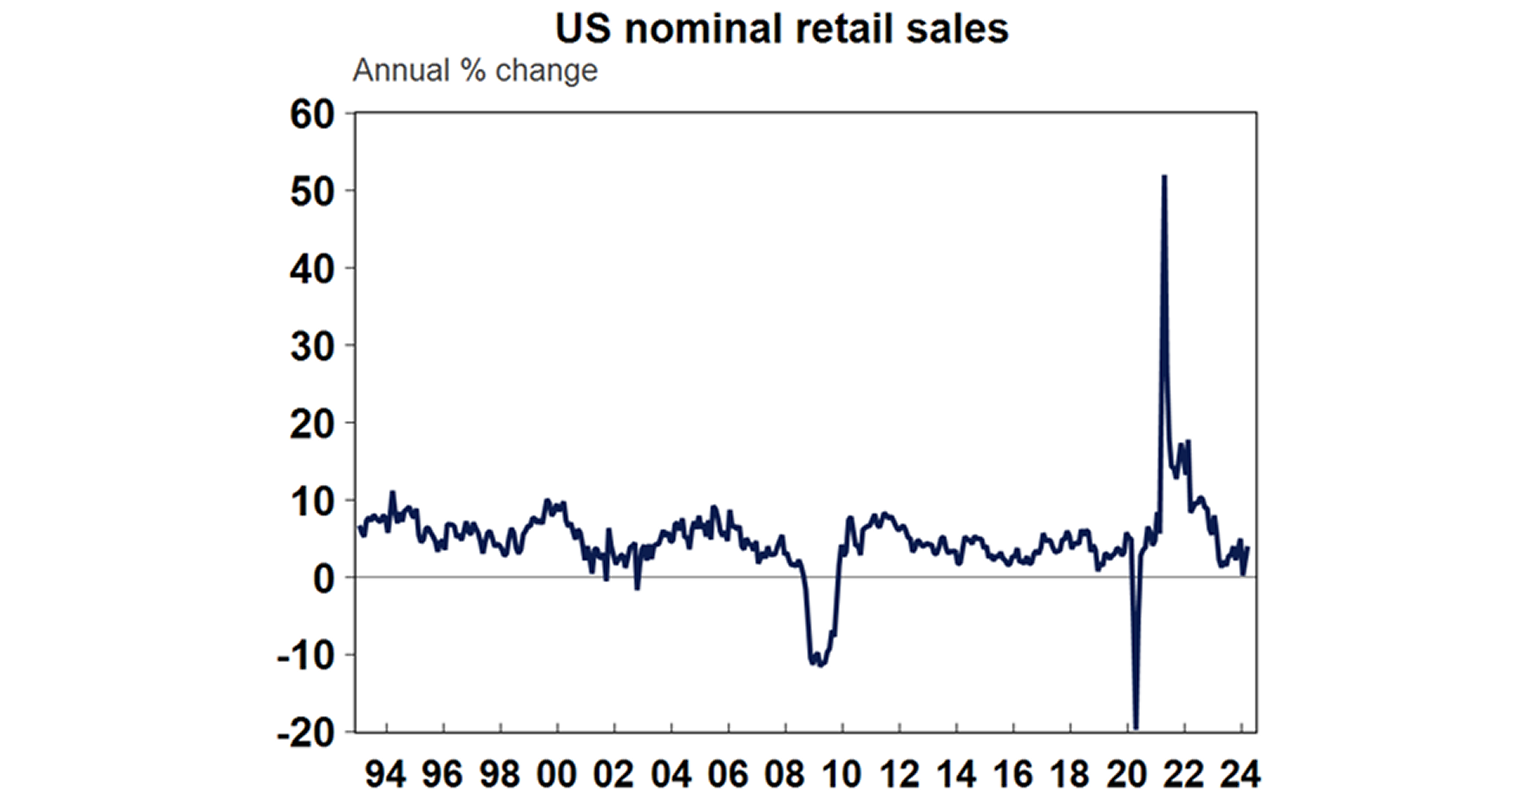
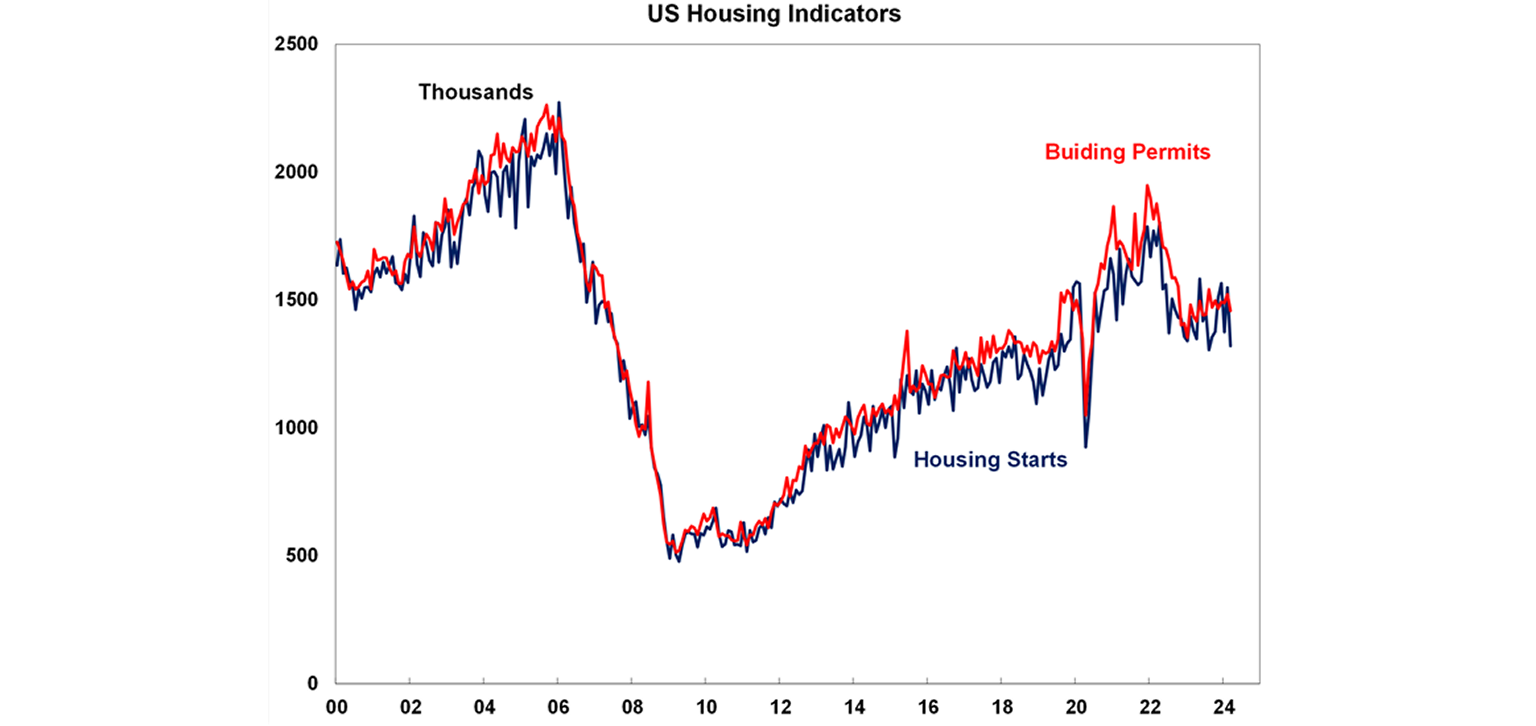
Mixed US data with a strong consumer but soft housing. Retail sales rose more than expected in March with February revised up suggesting the consumer is solid, although the strength over the last two months looks partly due to weather and seasonal distortions. Industrial production growth was also solid, with manufacturing conditions in the New York and Philadelphia regions improving in April but still soft on average.
US housing starts fell sharply in March, existing home sales fell, home builder conditions were flat in April and the flow on off the rise in bond yields and hence mortgage rates point to a slowing in housing indicators ahead. Meanwhile, the Conference Board’s leading index resumed falling again in March but initial jobless claims remain very low. Meanwhile, the Fed’s Beige Book of anecdotal evidence was “cautiously optimistic” on the outlook referring to “slight to moderate growth”, “moderate” wages growth and “modest” price increases.
So far so good for US March quarter earnings. Only 13% of S&P 500 companies have reported so far but 80% have beaten expectations, against a norm of 76% and earnings growth expectations have increased to 4.4%yoy, from 4.1% a week ago.
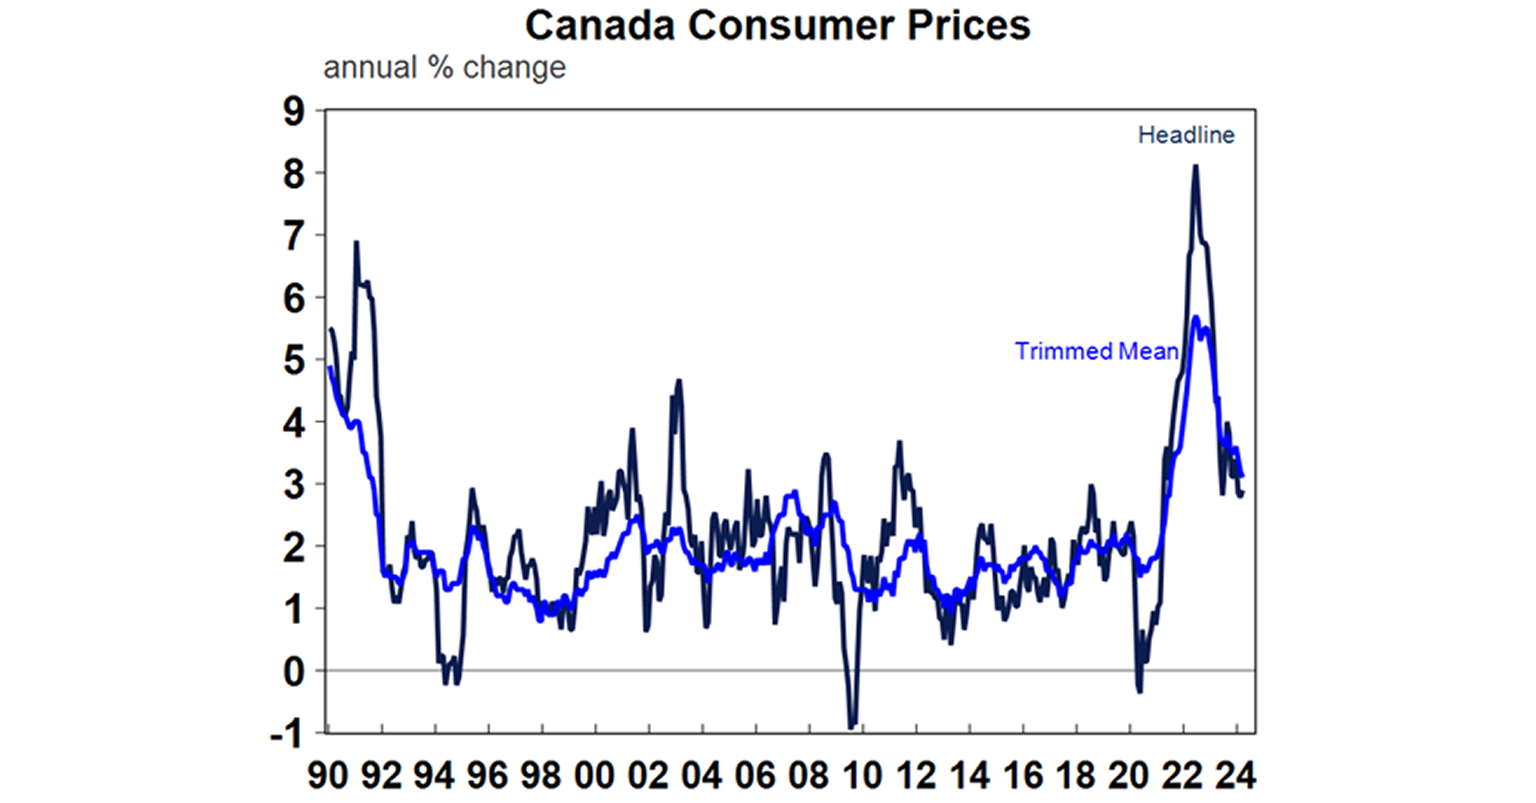
Canadian underlying inflation fell more than expected in March. Headline inflation ticked up to 2.9% with higher fuel prices but the underlying measures fell more than expected to an average 2.95%yoy, leaving the BoC looking like it might cut rates in June.
So far so good for US March quarter earnings. Only 14% of S&P 500 companies have reported so far but 80% have beaten expectations, against a norm of 76% and earnings growth expectations have increased to 4.7%yoy, from 4.1% a week ago.
Canadian underlying inflation fell more than expected in March. Headline inflation ticked up to 2.9% with higher fuel prices but the underlying measures fell more than expected to an average 2.95%yoy, leaving the BoC looking like it might cut rates in June.
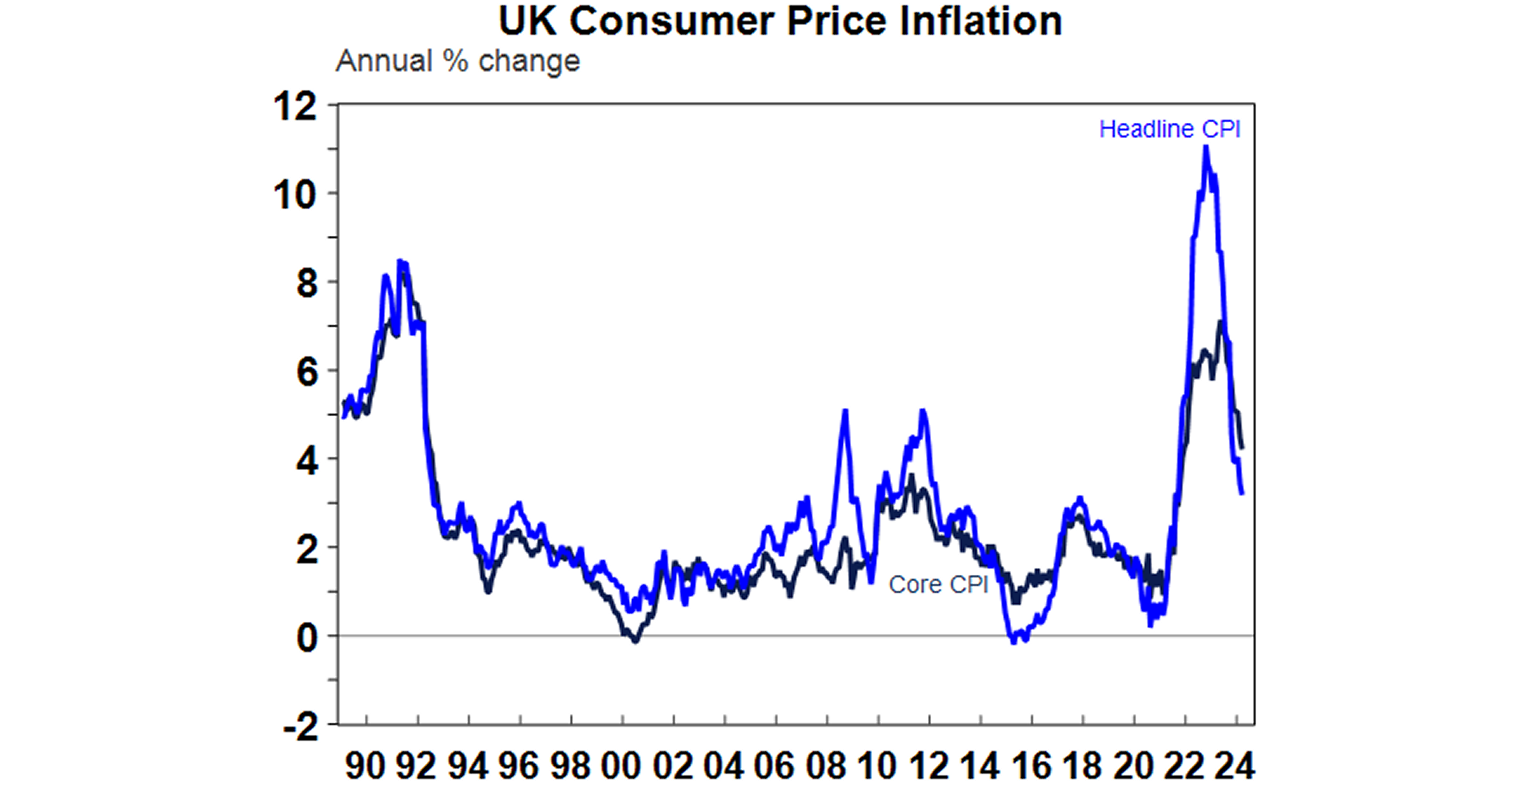
UK inflation fell in March but by less than expected. Headline inflation fell to 3.2%yoy and core inflation fell to 4.2%yoy, but sticky services inflation at 6%yoy will keep the BoE cautious with rate cuts unlikely until August. Similarly, although jobs fell in February and unemployment rose, wages growth slowed less than expected.
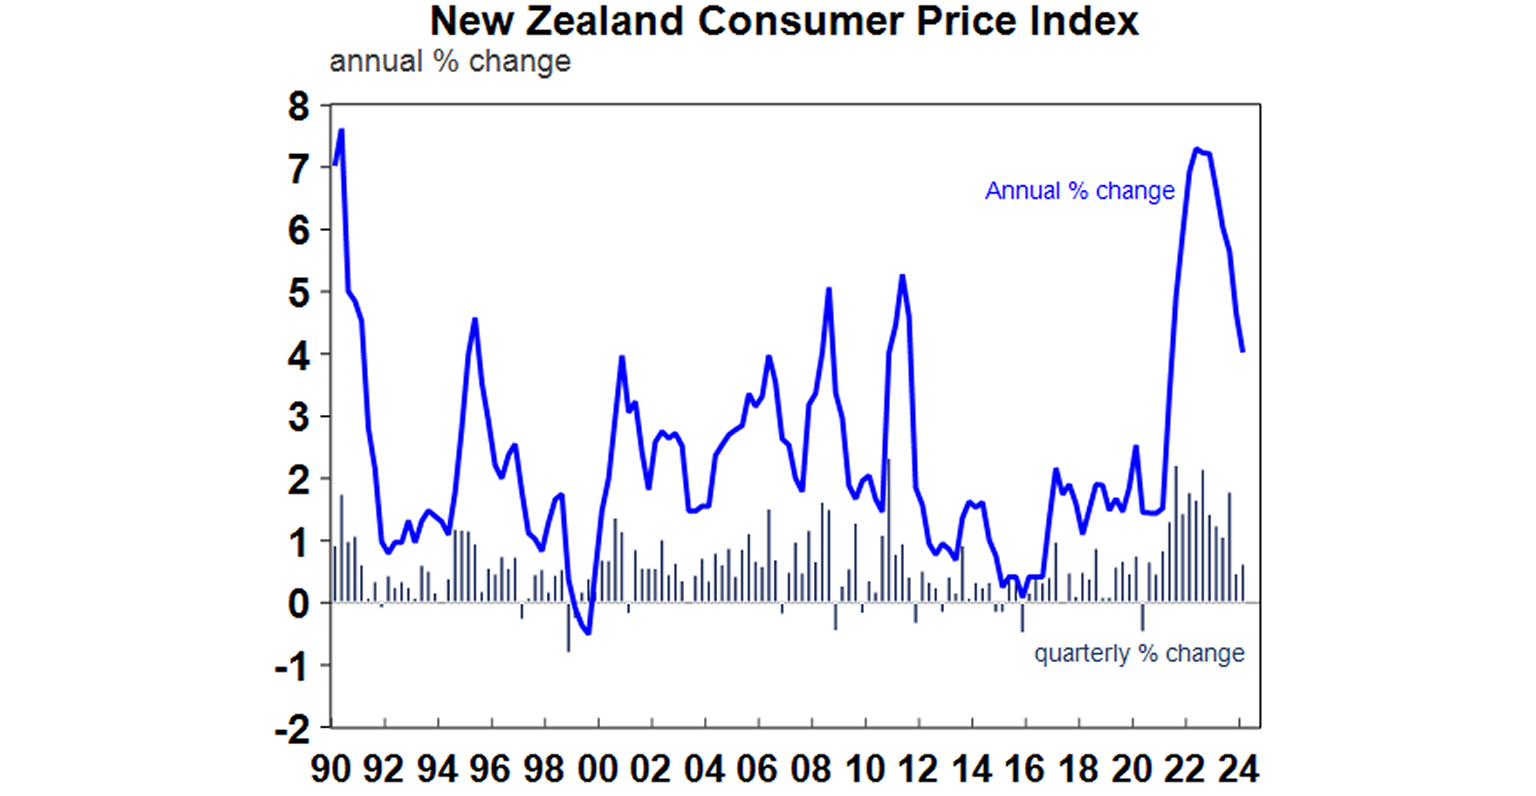
But NZ inflation fell more than expected in the March quarter. Headline infaltion fell to 4%yoy with underlying measures of inflation also down and the quarterly pace of headline and underlying inflation now running below the top of the 1-3% target range. Non-tradeable and services inflation remain a problem with rate cuts expected this year but not until around October.
Japanese inflation also fell in March. Headline CPI inflation fell to 2.7%yoy from 2.8%, and core inflation fell to 2.2%yoy from 2.5%.
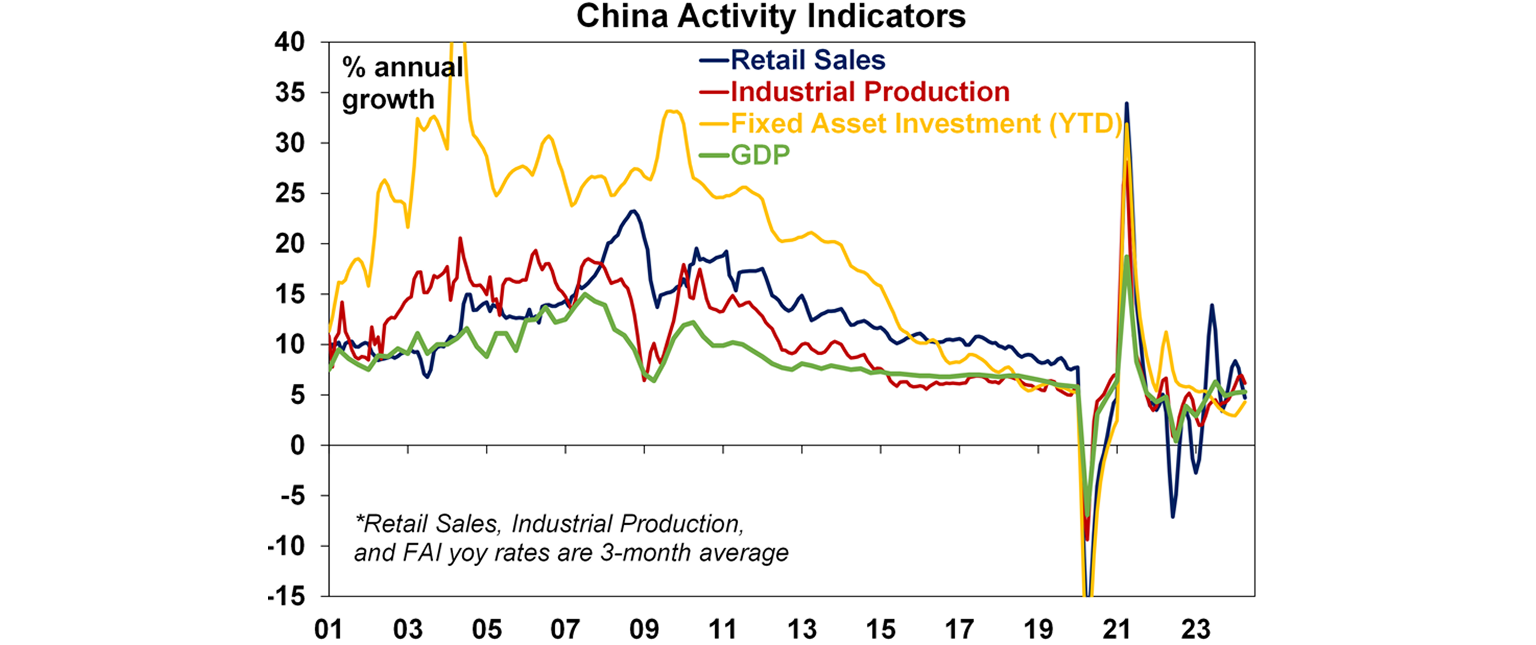
Chinese March quarter growth better than expected. Chinese property data remains depressed with further falls in property prices, sales and investment. But so far the rest of the economy is still growing at a mostly okay pace. March quarter GDP rose a stronger than expected 5.3%yoy, March retail sales and industrial production rose less than expected but investment rose more than expected. And a pick up in PMIs is a positive sign. Overall the Chinese economy looks on track for growth this year of around 4.5-5%. That said more policy stimulus is likely to be requried.
Australian economic events and implications
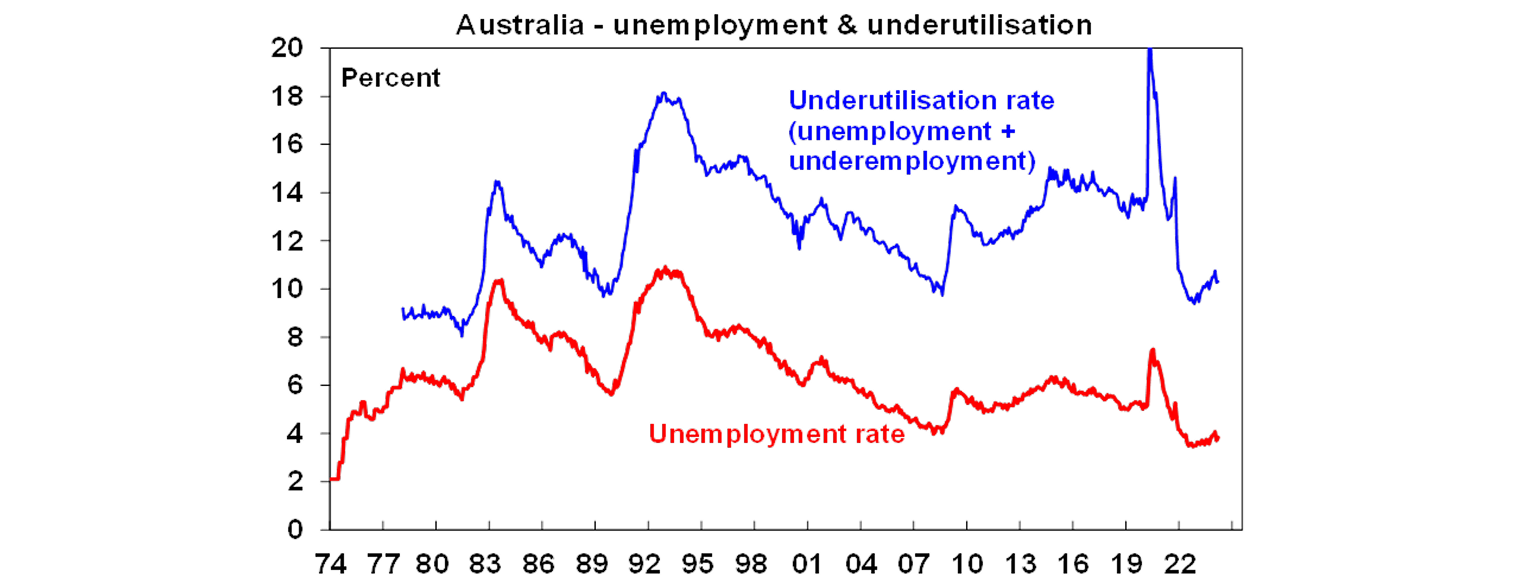
The Australian jobs market remains tight, but it is gradually cooling. While employment has been volatile lately due to changed seasonal patterns, trend jobs growth is still strong, hours worked is up, unemployment and underemployment remain low and the proportion of the population employed and the participation rate are still around record highs. All of which tell us that the jobs market remains tight – far tighter than we anticipated would be the case. However, there are signs of a gradual cooling with both unemployment and labour underutilisation up from their lows.
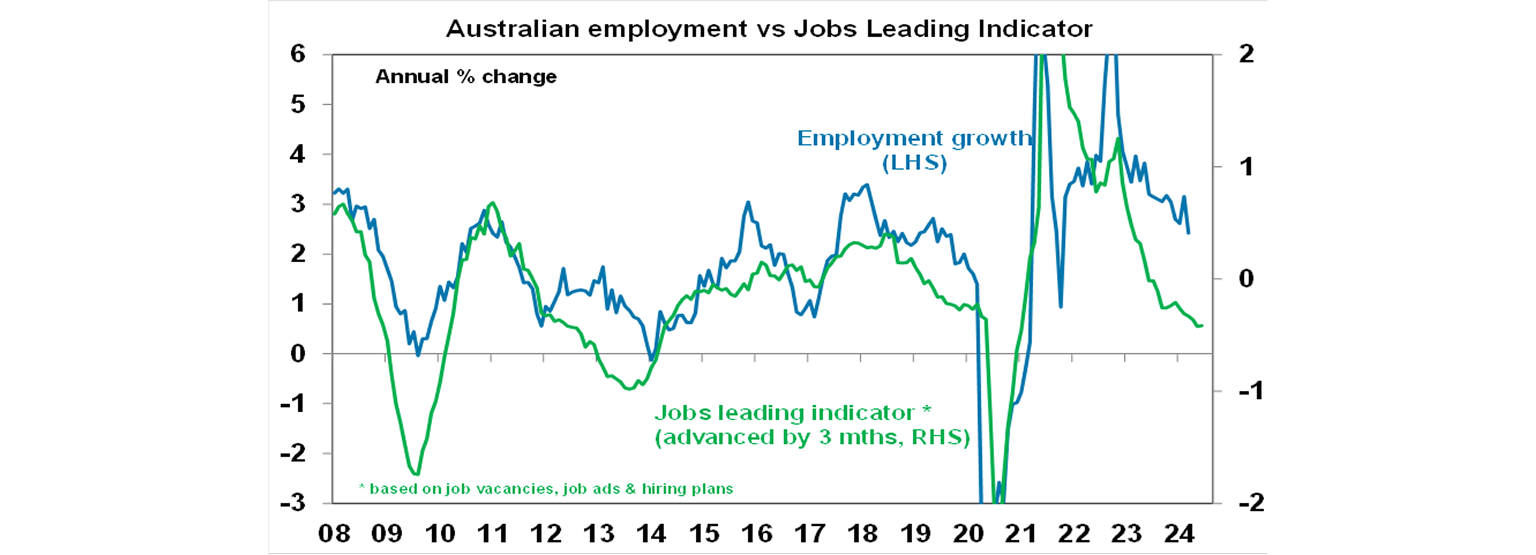
Furthermore, our Jobs Leading Indicator continues to point to slower jobs growth on the back of falling vacancies & hiring plans.
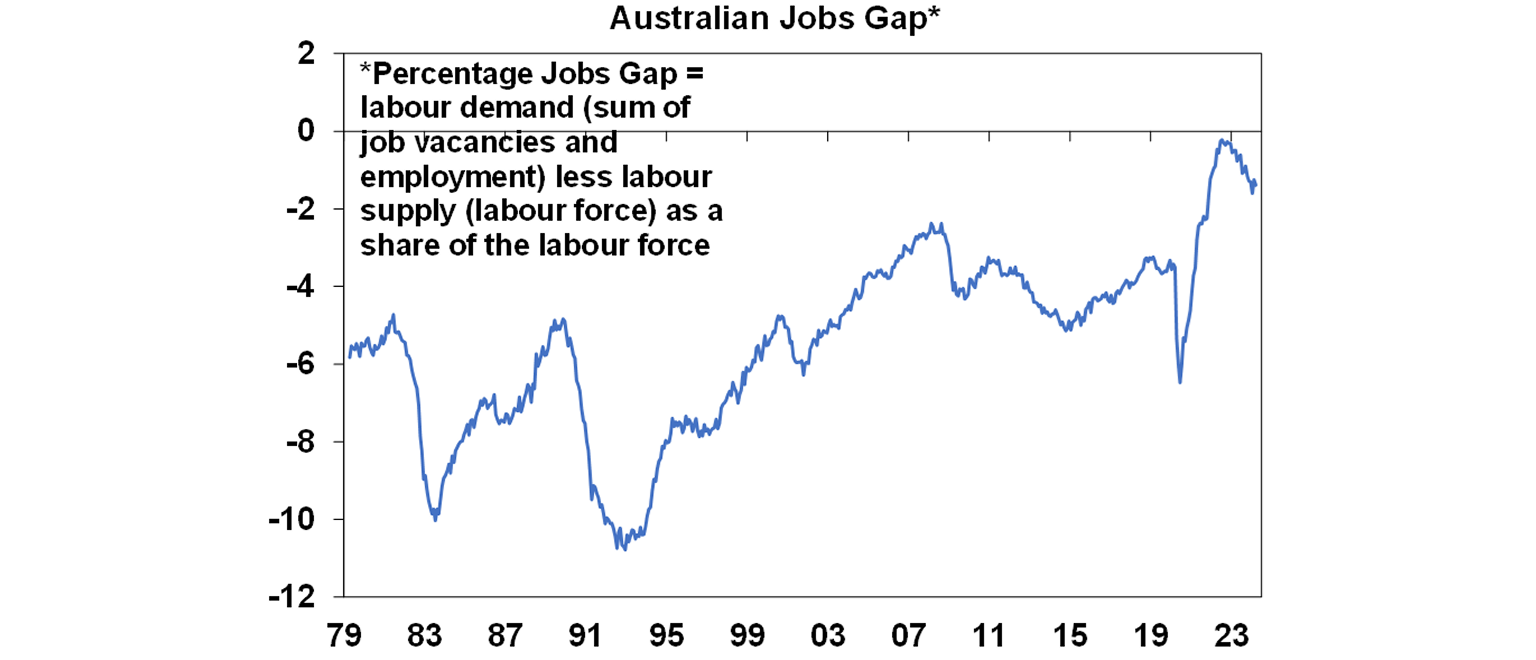
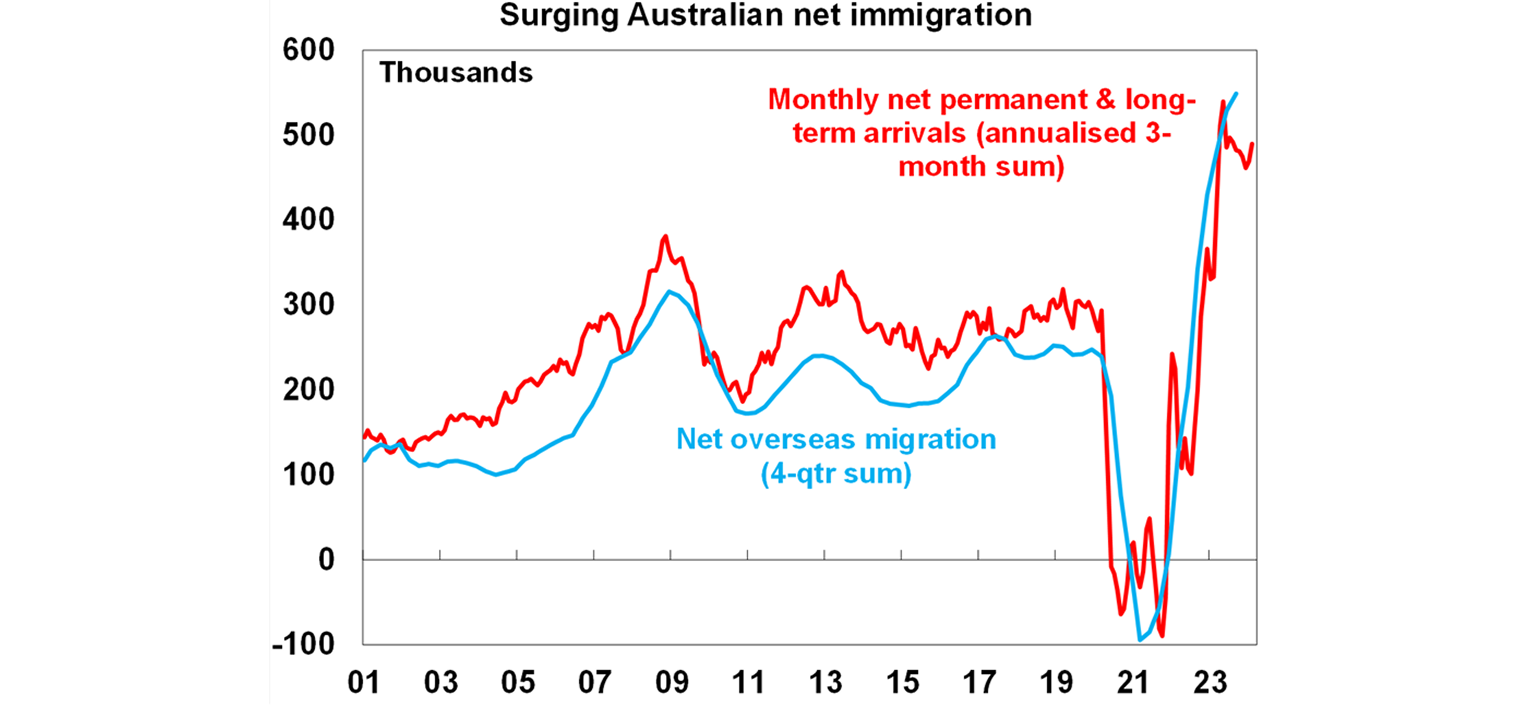
The tight but cooling jobs market can be seen in the gap between the demand for and supply of workers. This can be proxied as the gap between the sum of employment and job vacancies (ie demand for workers) and the labour force (ie labour supply). As can be seen in the next chart the gap remains high but has eased from near zero. The cooling but still tight jobs market will leave the RBA cautious on inflation and in no hurry to cut rates, for now. That said, the Australian jobs market may be seeing a similar positive supply shock to that in the US with strong immigration and high workforce participation absorbing job vacancies and heading off stronger wages growth even though jobs growth is still strong. If this continues to be the case, rate cuts will still ultimately be justified even if jobs growth remains strong.
Meanwhile, monthly arrivals data up to February suggests that while immigration may have peaked it remains around record levels. This means jobs growth needs to average around 39,000 a month at present to absorb the new entrants to the workforce on the back of very high immigration levels. And we should be building around 250,000 dwellings a year to keep up with population driven housing demand but with completions running around 170,000 we are just adding to the housing shortfall.
What to watch over the next week?
It’s PMI week again with March business conditions indices (or PMIs) due Tuesday for the US, Japan, Europe and Australia and likely to show that the global economy is continuing to grow at an okay pace. Interest will be on the cost and price components which for the G3 have stopped improving recently, mainly reflecting the US.
Apart from the PMIs, in the US the focus will be on March quarter GDP growth (Thursday) and core private final consumption (PCE) inflation (Friday). The GDP data is likely to show another quarter of solid growth albeit at 2.3% annualised a bit slower than the 3.4% pace seen in the December quarter. Meanwhile, core PCE inflation is expected to come in around 0.26%mom with a fall to 2.7%yoy from 2.8%. While lower than the CPI this is likely to still be too high for the Fed’s comfort. Meanwhile, expect a rise in durable goods orders (Wednesday). The March quarter profit reporting season will also hot up.
The Bank of Japan (Friday) is likely to leave monetary policy on hold after its rate hike at its March meeting. However, it may move its forward guidance to sound more neutral and data dependent, as part of the transition to more normal monetary policy and given the surprising further fall in the Yen.
In Australia, the March quarter CPI (Wednesday) is expected to rise 0.7%qoq taking annual inflation down to 3.4%yoy, from 4.1%yoy in the December quarter, which is slightly below the RBA’s implied 3.5%yoy forecast. The key drivers are expected to be increases in rents, education, health and insurance partly offset by softness in clothing, household goods, utilities, holiday travel and fuel. The trimmed mean is expected to rise 0.7%qoq or 3.7%yoy, which is also just below the RBA’s implied forecast for 3.8%yoy. The monthly CPI for March is also likely to be 3.4%yoy.
Outlook for investment markets
Easing inflation pressures, central banks moving to cut rates and prospects for stronger growth in 2025 should make for good investment returns this year. However, with a high risk of recession, delays to rate cuts and significant geopolitical risks, the remainder of the year is likely to be a far rougher and more constrained than the first three months were.
We expect the ASX 200 to return 9% this year and rise to around 7900. A recession is probably the main threat.
Bonds are likely to provide returns around running yield or a bit more, as inflation slows, and central banks cut rates.
Unlisted commercial property returns are likely to be negative again due to the lagged impact of high bond yields & working from home.
Australian home prices are likely to see more constrained gains compared to 2023 as still high interest rates constrain demand and unemployment rises. The supply shortfall should provide support though and rate cuts from mid-year should help boost price growth later in the year.
Cash and bank deposits are expected to provide returns of over 4%, reflecting the back up in interest rates.
A rising trend in the $A is likely taking it to $US0.72, due to a fall in the overvalued $US, but in the near term the risks for the $A are on the downside as the Fed delays rate cuts and given the high risk of an escalating conflict in the Middle East.
You may also like
-

Weekly market update - 26-06-2026 The past week saw global shares fall with tech shares under renewed pressue on concerns about an AI bubble and valuations, with reports that a ship had been struck by a missile while moving through the Strait of Hormuz not helping and adding to concerns that the Strait’s reopening and the US/Iran peace deal was fragile. Partly reflecting the weak global lead along with lower commodity prices and profit taking in the banks the Australian share market also fell with a decline of around 0.9% for the week. While consumer and health shares rose this was more than offset by weakness in tech, resources, telcos and financials. -

Oliver's insights - Teflon share markets Over the last 18 months investment markets have faced a string of threats. Many of these have involved the US and President Trump’s policies - tariffs, a US/China trade war, Trump’s attacks on NATO allies, Trump’s attacks on the Fed, and the War with Iran and the associated oil supply shock. Even Trump’s erratic policy making itself would normally be seen as a concern. -

Weekly market update 19-06-2026 The deal provided a boost for global share markets with US shares up 0.9% for the holiday shortened week to Thursday with a more hawkish Fed limiting the gains and US futures falling 0.2% on Friday due to a delay to the start of US/Iran talks towards a permanent deal.
Important information
Any advice and information is provided by AWM Services Pty Ltd ABN 15 139 353 496, AFSL No. 366121 (AWM Services) and is general in nature. It hasn’t taken your financial or personal circumstances into account. Taxation issues are complex. You should seek professional advice before deciding to act on any information in this article.
It’s important to consider your particular circumstances and read the relevant Product Disclosure Statement, Target Market Determination or Terms and Conditions, available from AMP at amp.com.au, or by calling 131 267, before deciding what’s right for you. The super coaching session is a super health check and is provided by AWM Services and is general advice only. It does not consider your personal circumstances.
You can read our Financial Services Guide online for information about our services, including the fees and other benefits that AMP companies and their representatives may receive in relation to products and services provided to you. You can also ask us for a hardcopy. All information on this website is subject to change without notice. AWM Services is part of the AMP group.