Introduction
The 8th March marks International Women’s Day. Some might say that International Women’s Day has only gained popularity in recent years across the Western World but it actually has historical origins back to the early 1900’s, particularly in the former USSR, where I was born. It is still a day of celebration for girls and women in many ex-Soviet countries where girls and women are given flowers and gifts (and even a public holiday in some countries!). So I thought it was a good time to reflect on issues around gender inequality in Australia.
Women in the Australian labour market
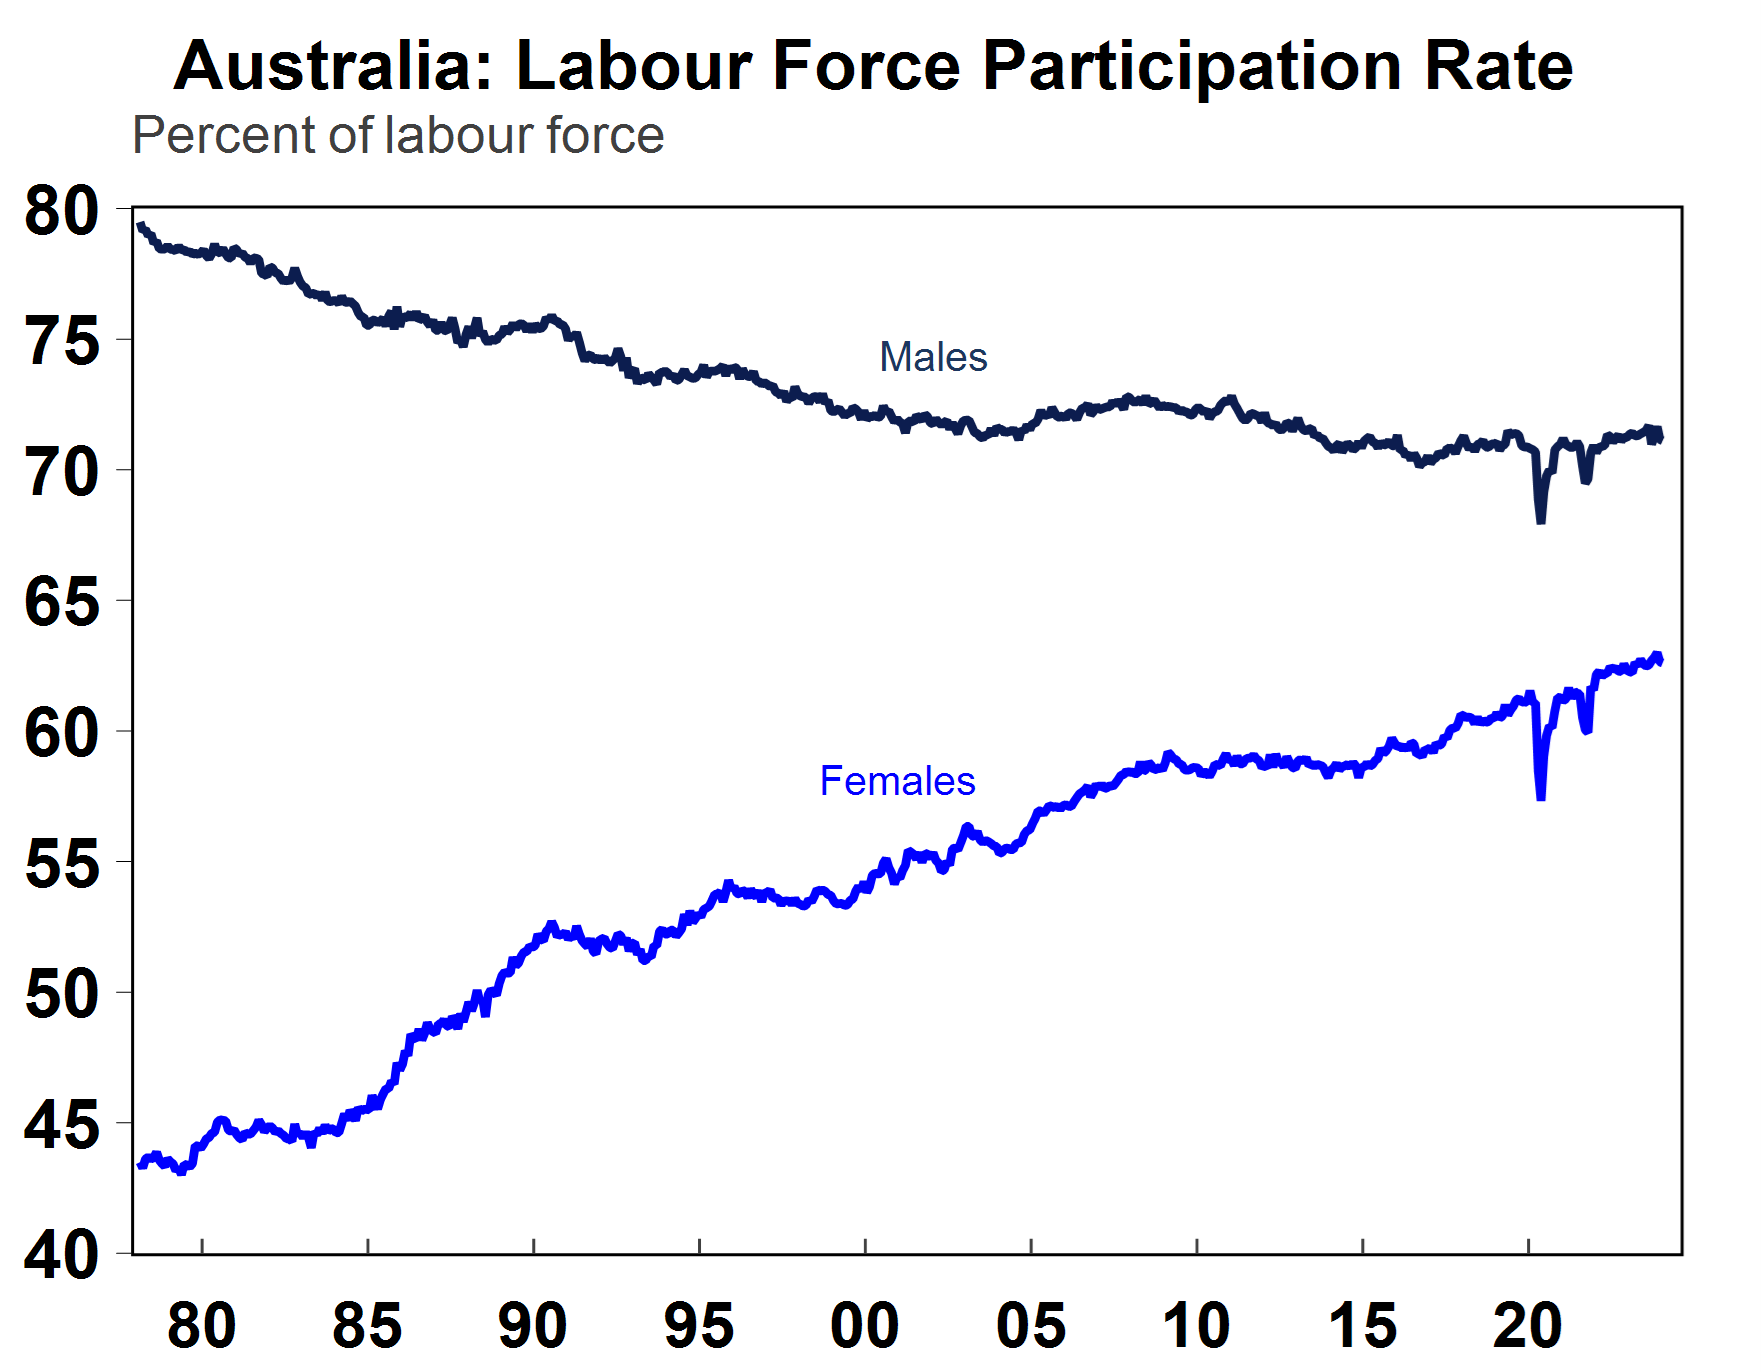
The female participation rate (the number of women either employed or unemployed as a share of the labour market) is 62.6%, lower than the 71.1% for males (see the chart below) but is at around a record high and well above the ~43% that was recorded in 1978. So female participation in the labour force has gone up significantly over the past 50 years.
Source: Macrobond, AMP
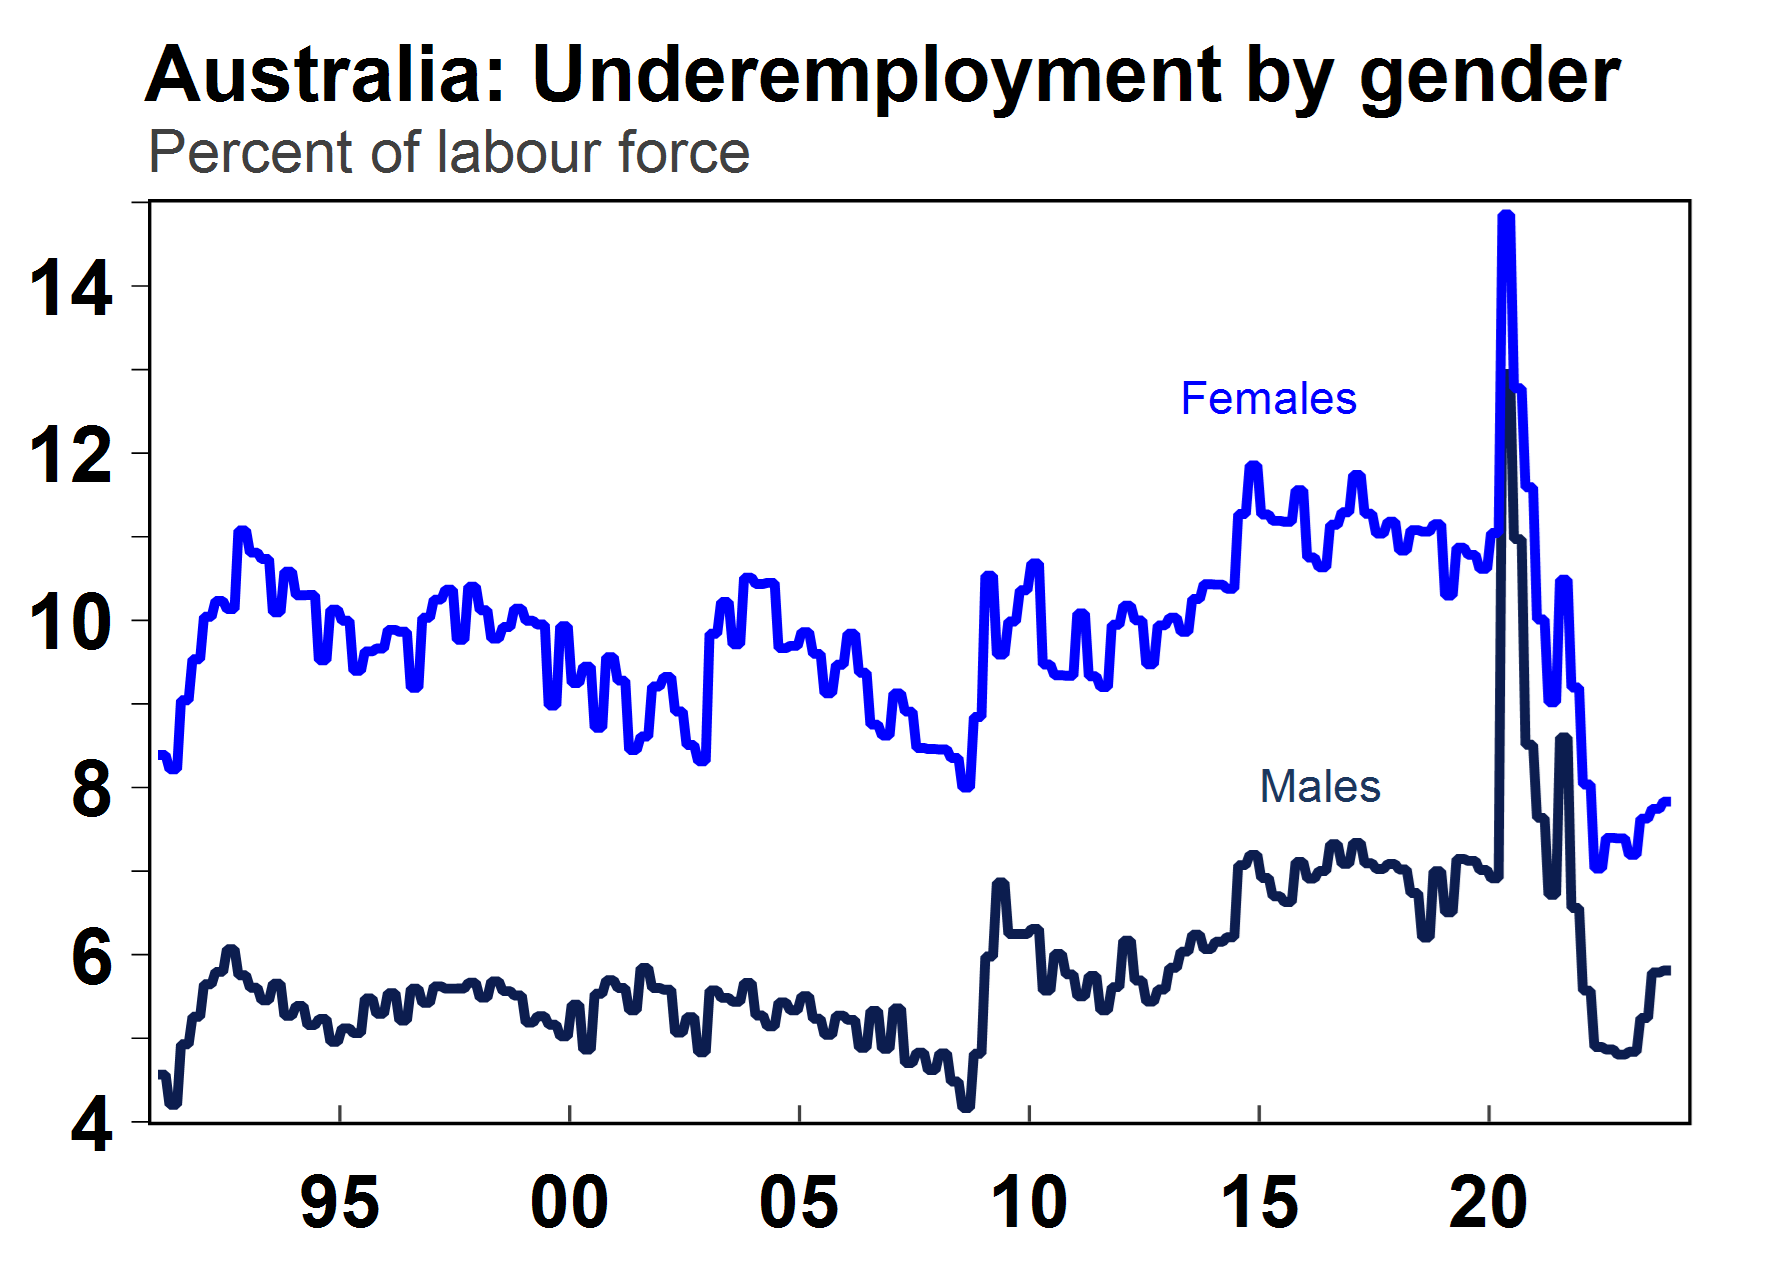
In Australia, 47% of women in the labour market work part-time, more than double the 20% of men who work part-time. The higher rate of part-time participation by females results in higher “underemployment” (i.e. females wanting to work more hours). Female underemployment is 7.8% and males is 5.8% (see the next chart).
Source: Macrobond, AMP
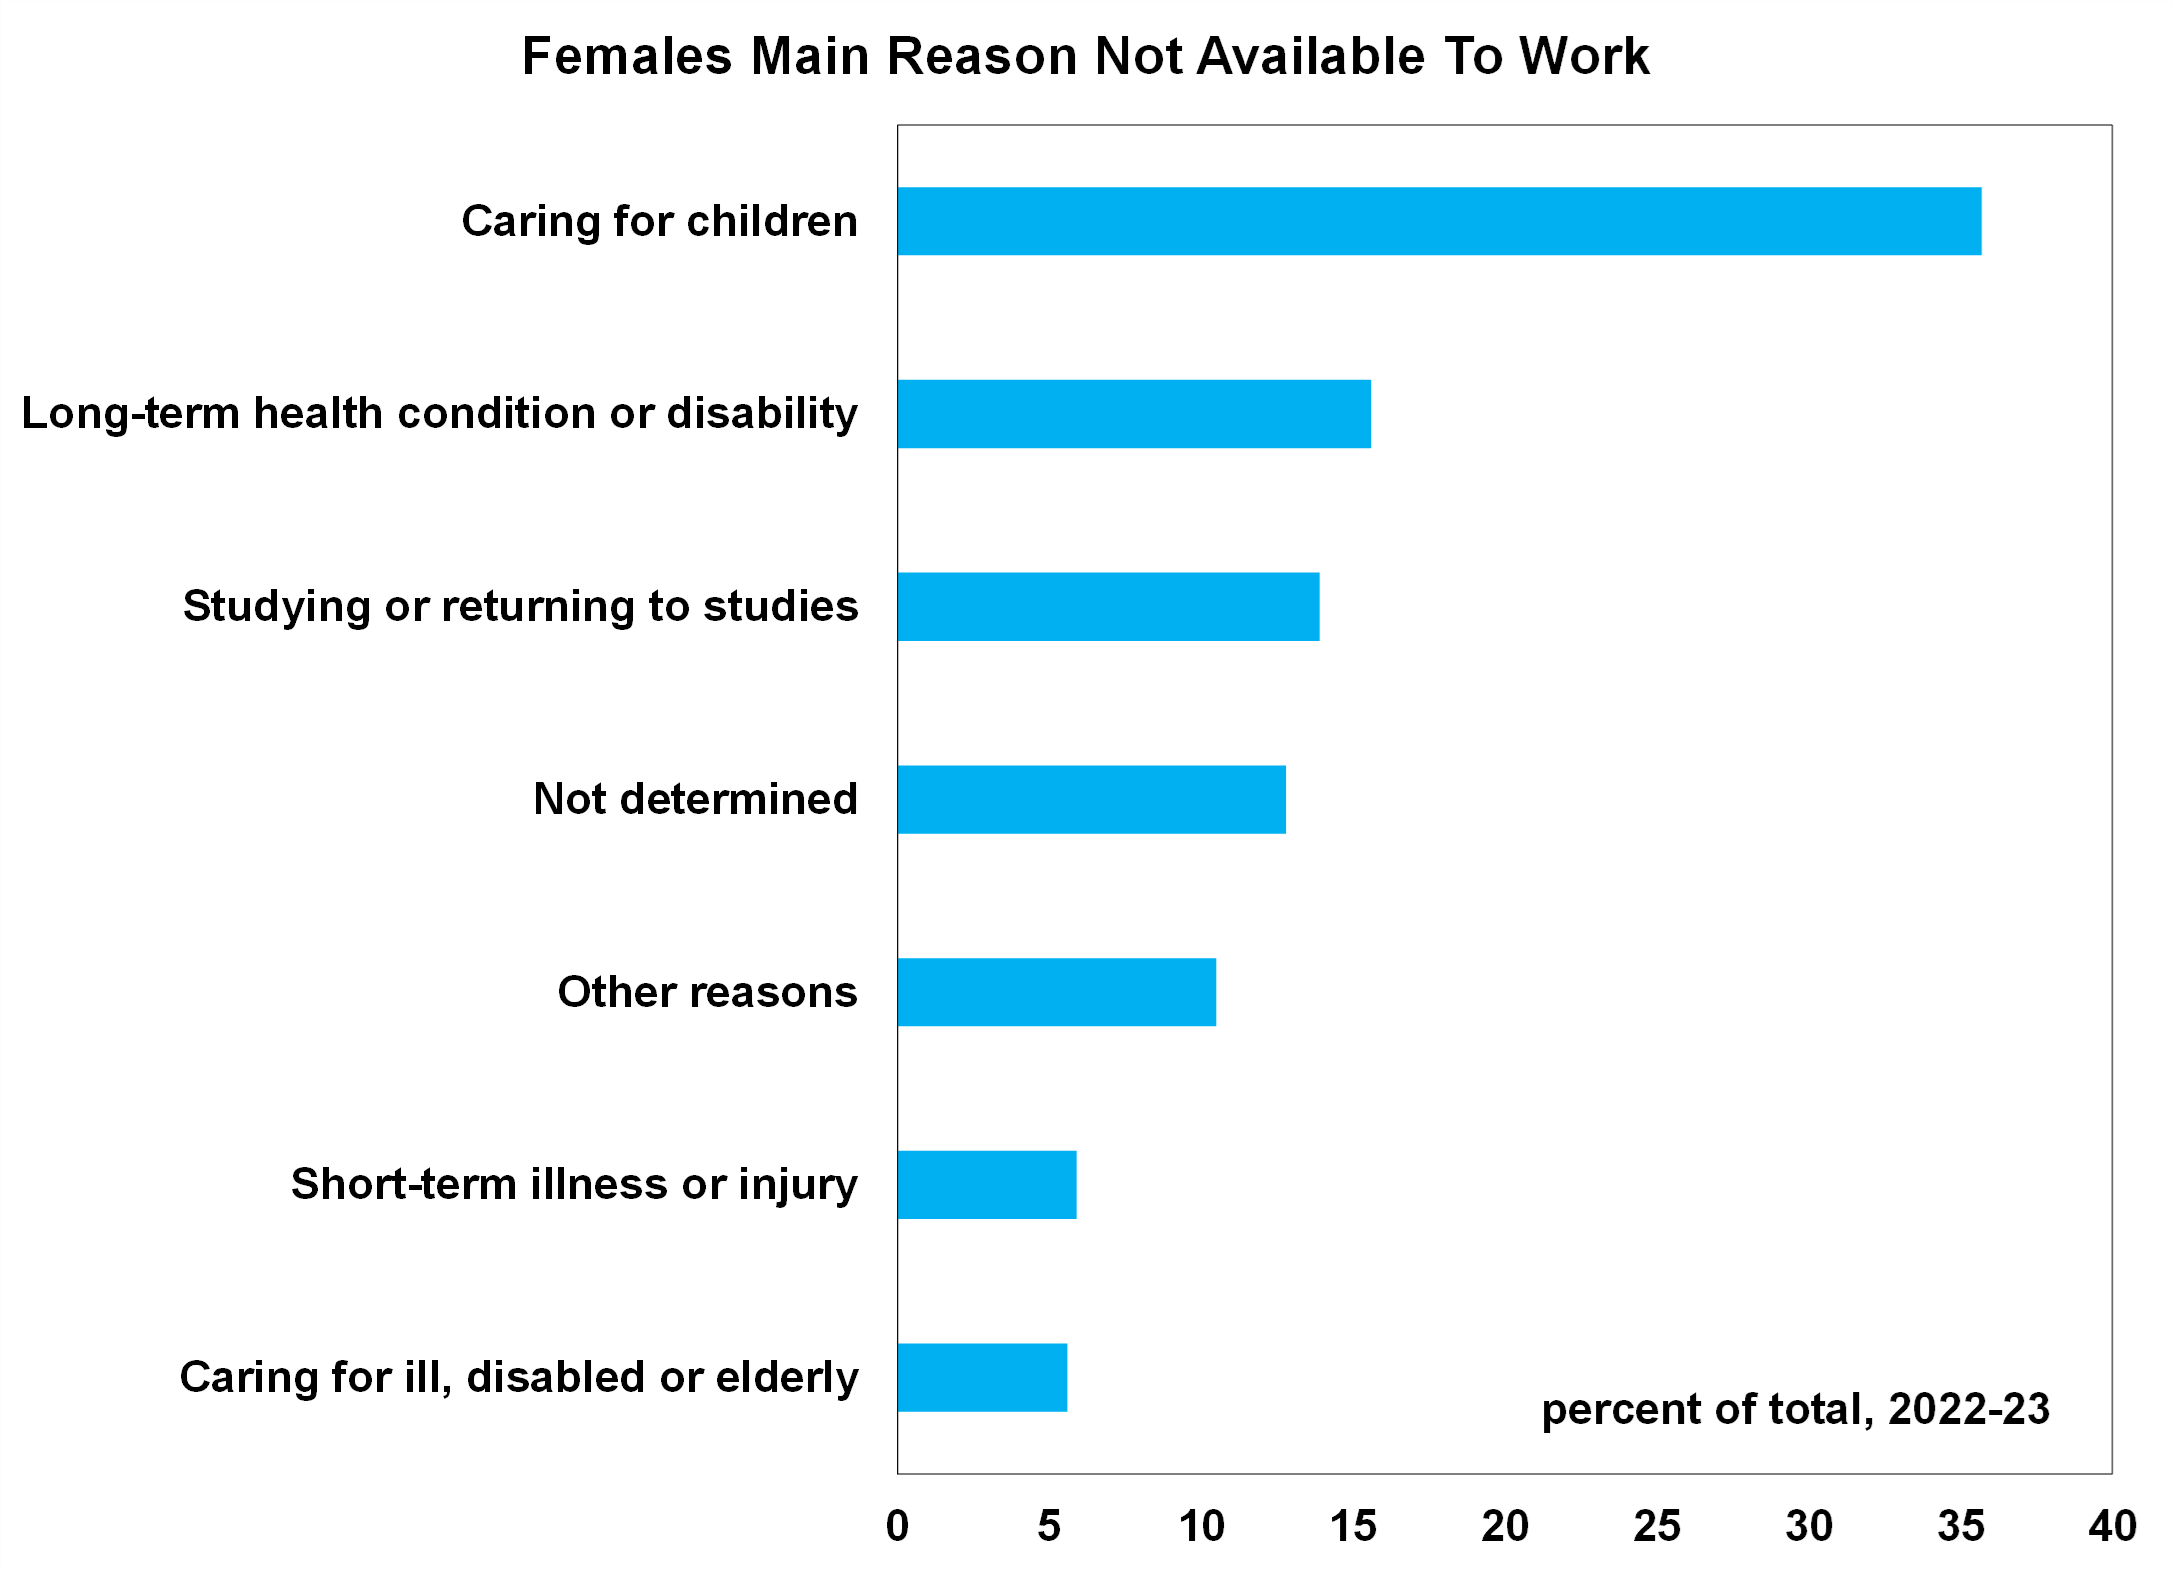
As expected, the main reason that females are not being available for more hours is because they are caring for children (see the chart below) with nearly 36% of women in 2022-23 citing that caring for children was the main reason they were unable to work. So, the gap in labour force participation between males and females is likely to narrow a bit further over time but is unlikely to ever completely close, because at the end of the day if women decide to have children then they are likely to take time out of work.
Source: ABS, AMP
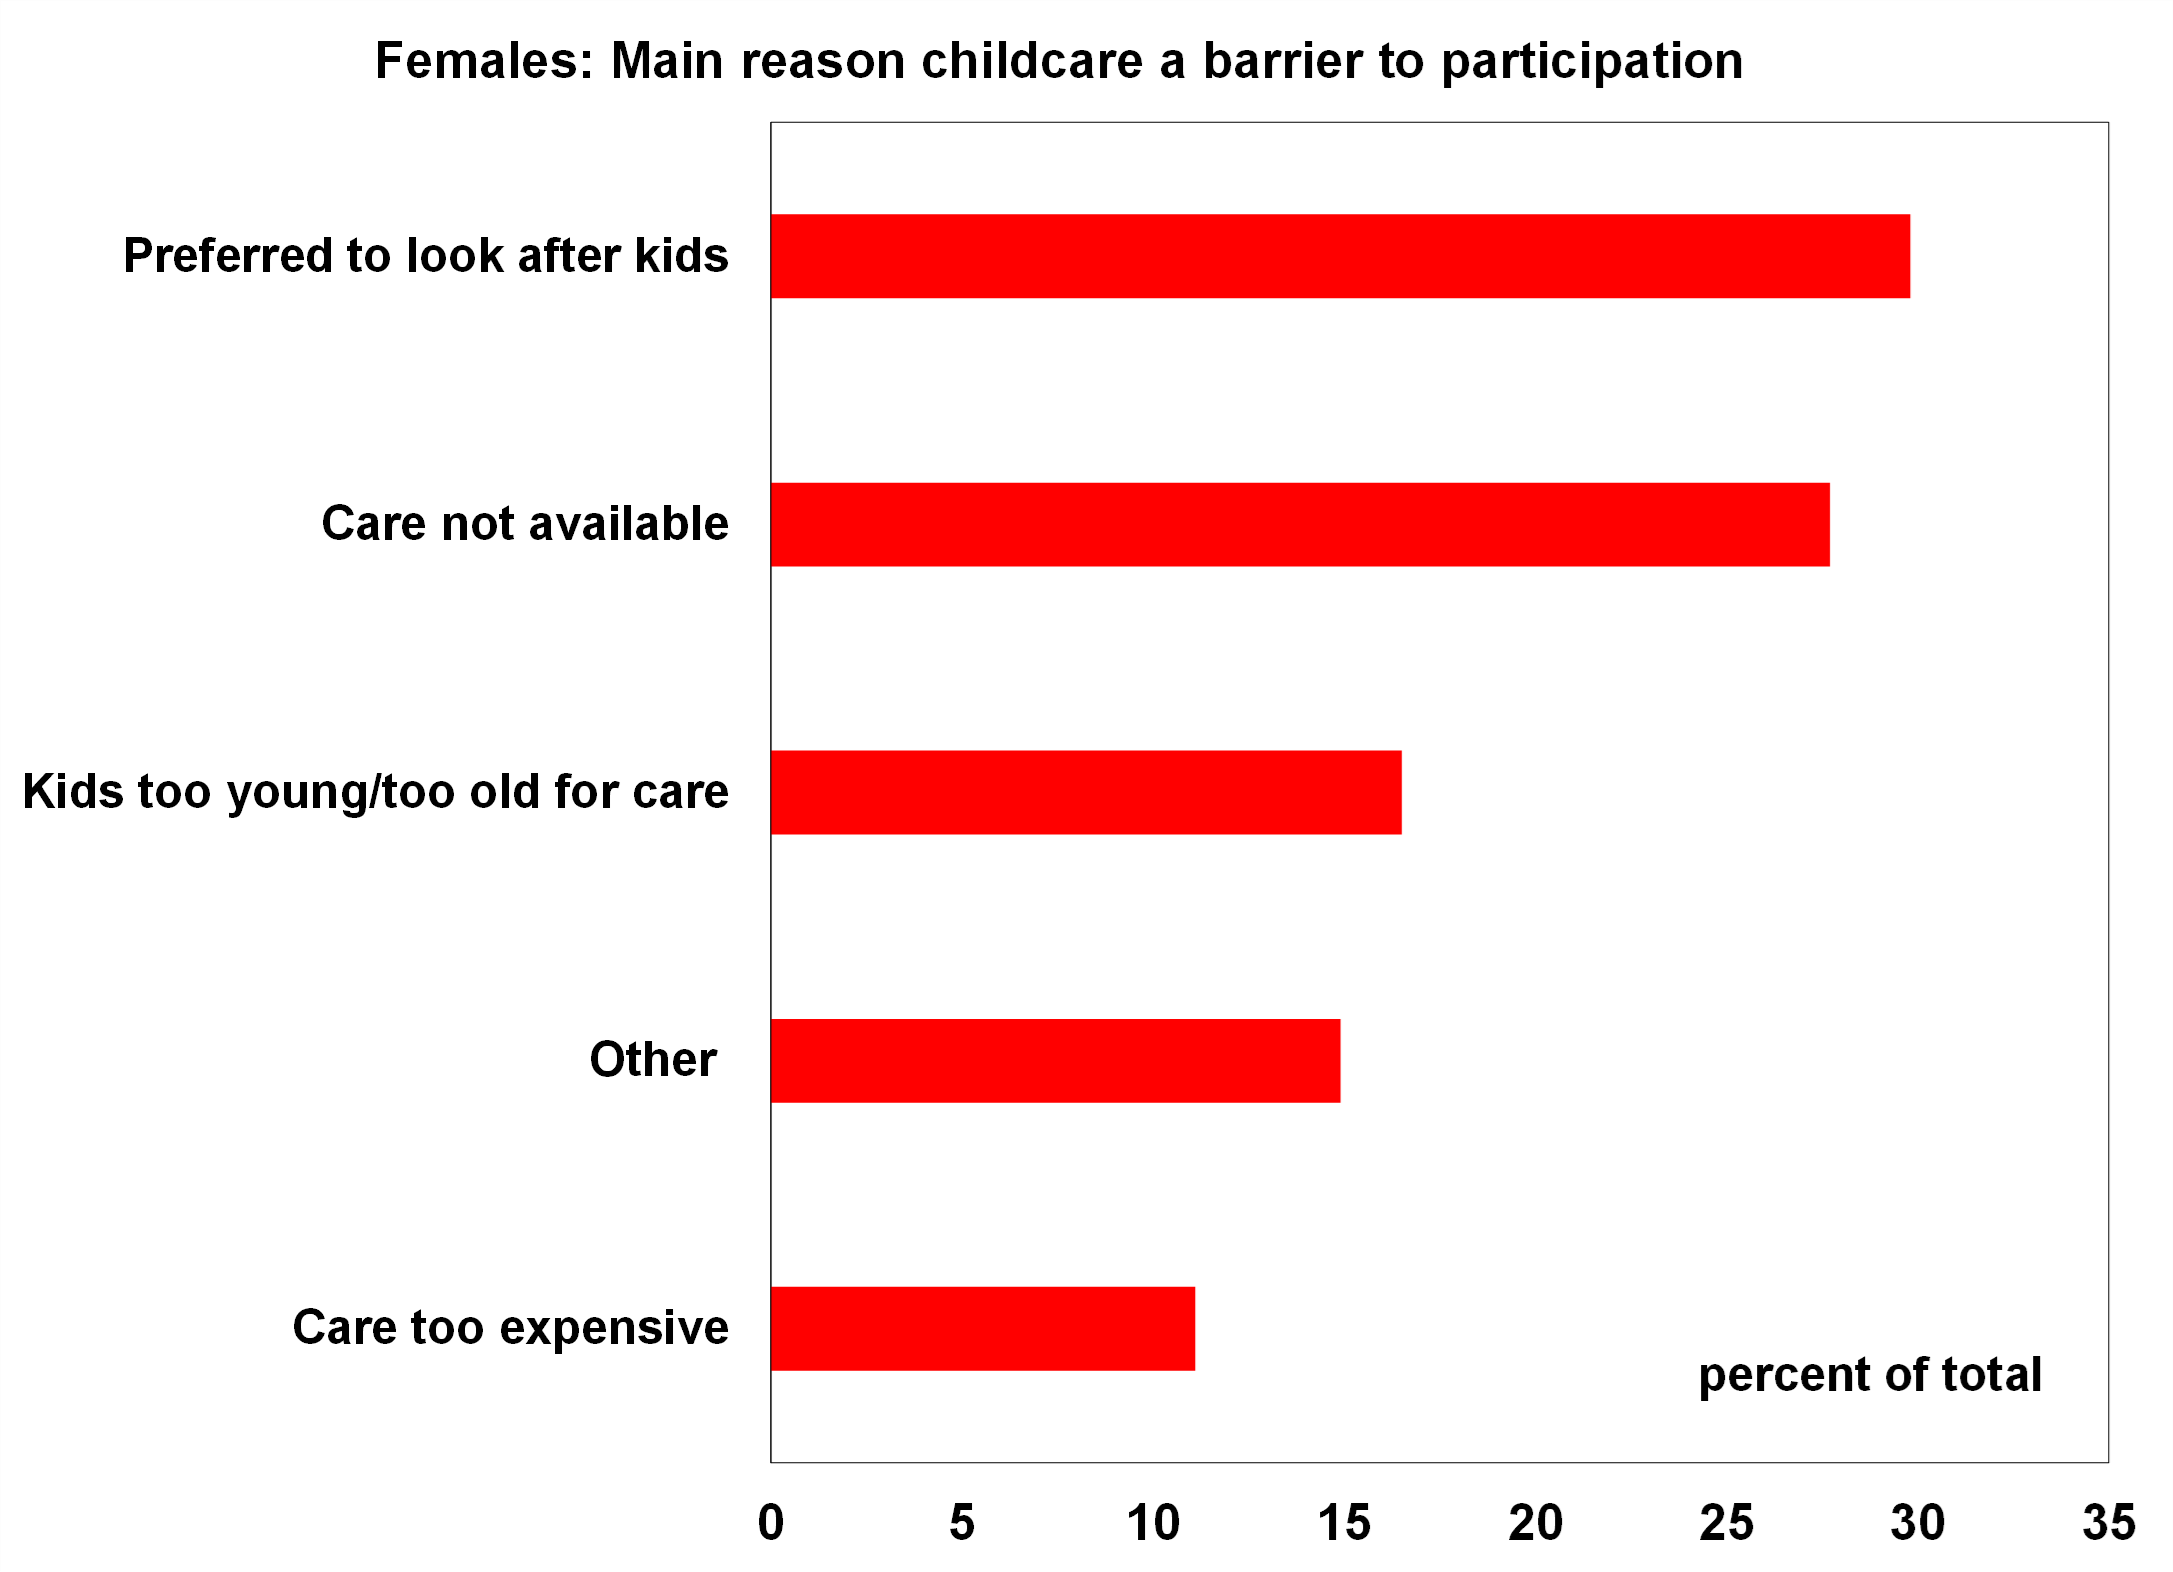
Interestingly, of the females that said that childcare was the main barrier to workforce participation, the main reason that it was an issue for them was because they preferred to look after their children, followed by childcare not being available (see the chart below) and childcare costs being the 5th reason that childcare was a barrier to particiaption (rather than the usual statistics indicating that it is the main reason for women not returning to work). This shows that there is some natural preference for many women to look after their children.
Source: ABS, AMP
The gender pay gap
The gender pay gap refers to the difference in earnings from work for males and females for a full-time equivalent person. According to the OECD, there is an 11.6% difference in male and female pay across OECD countries (see the chart below) with Australia doing better than the average at 9.9%.
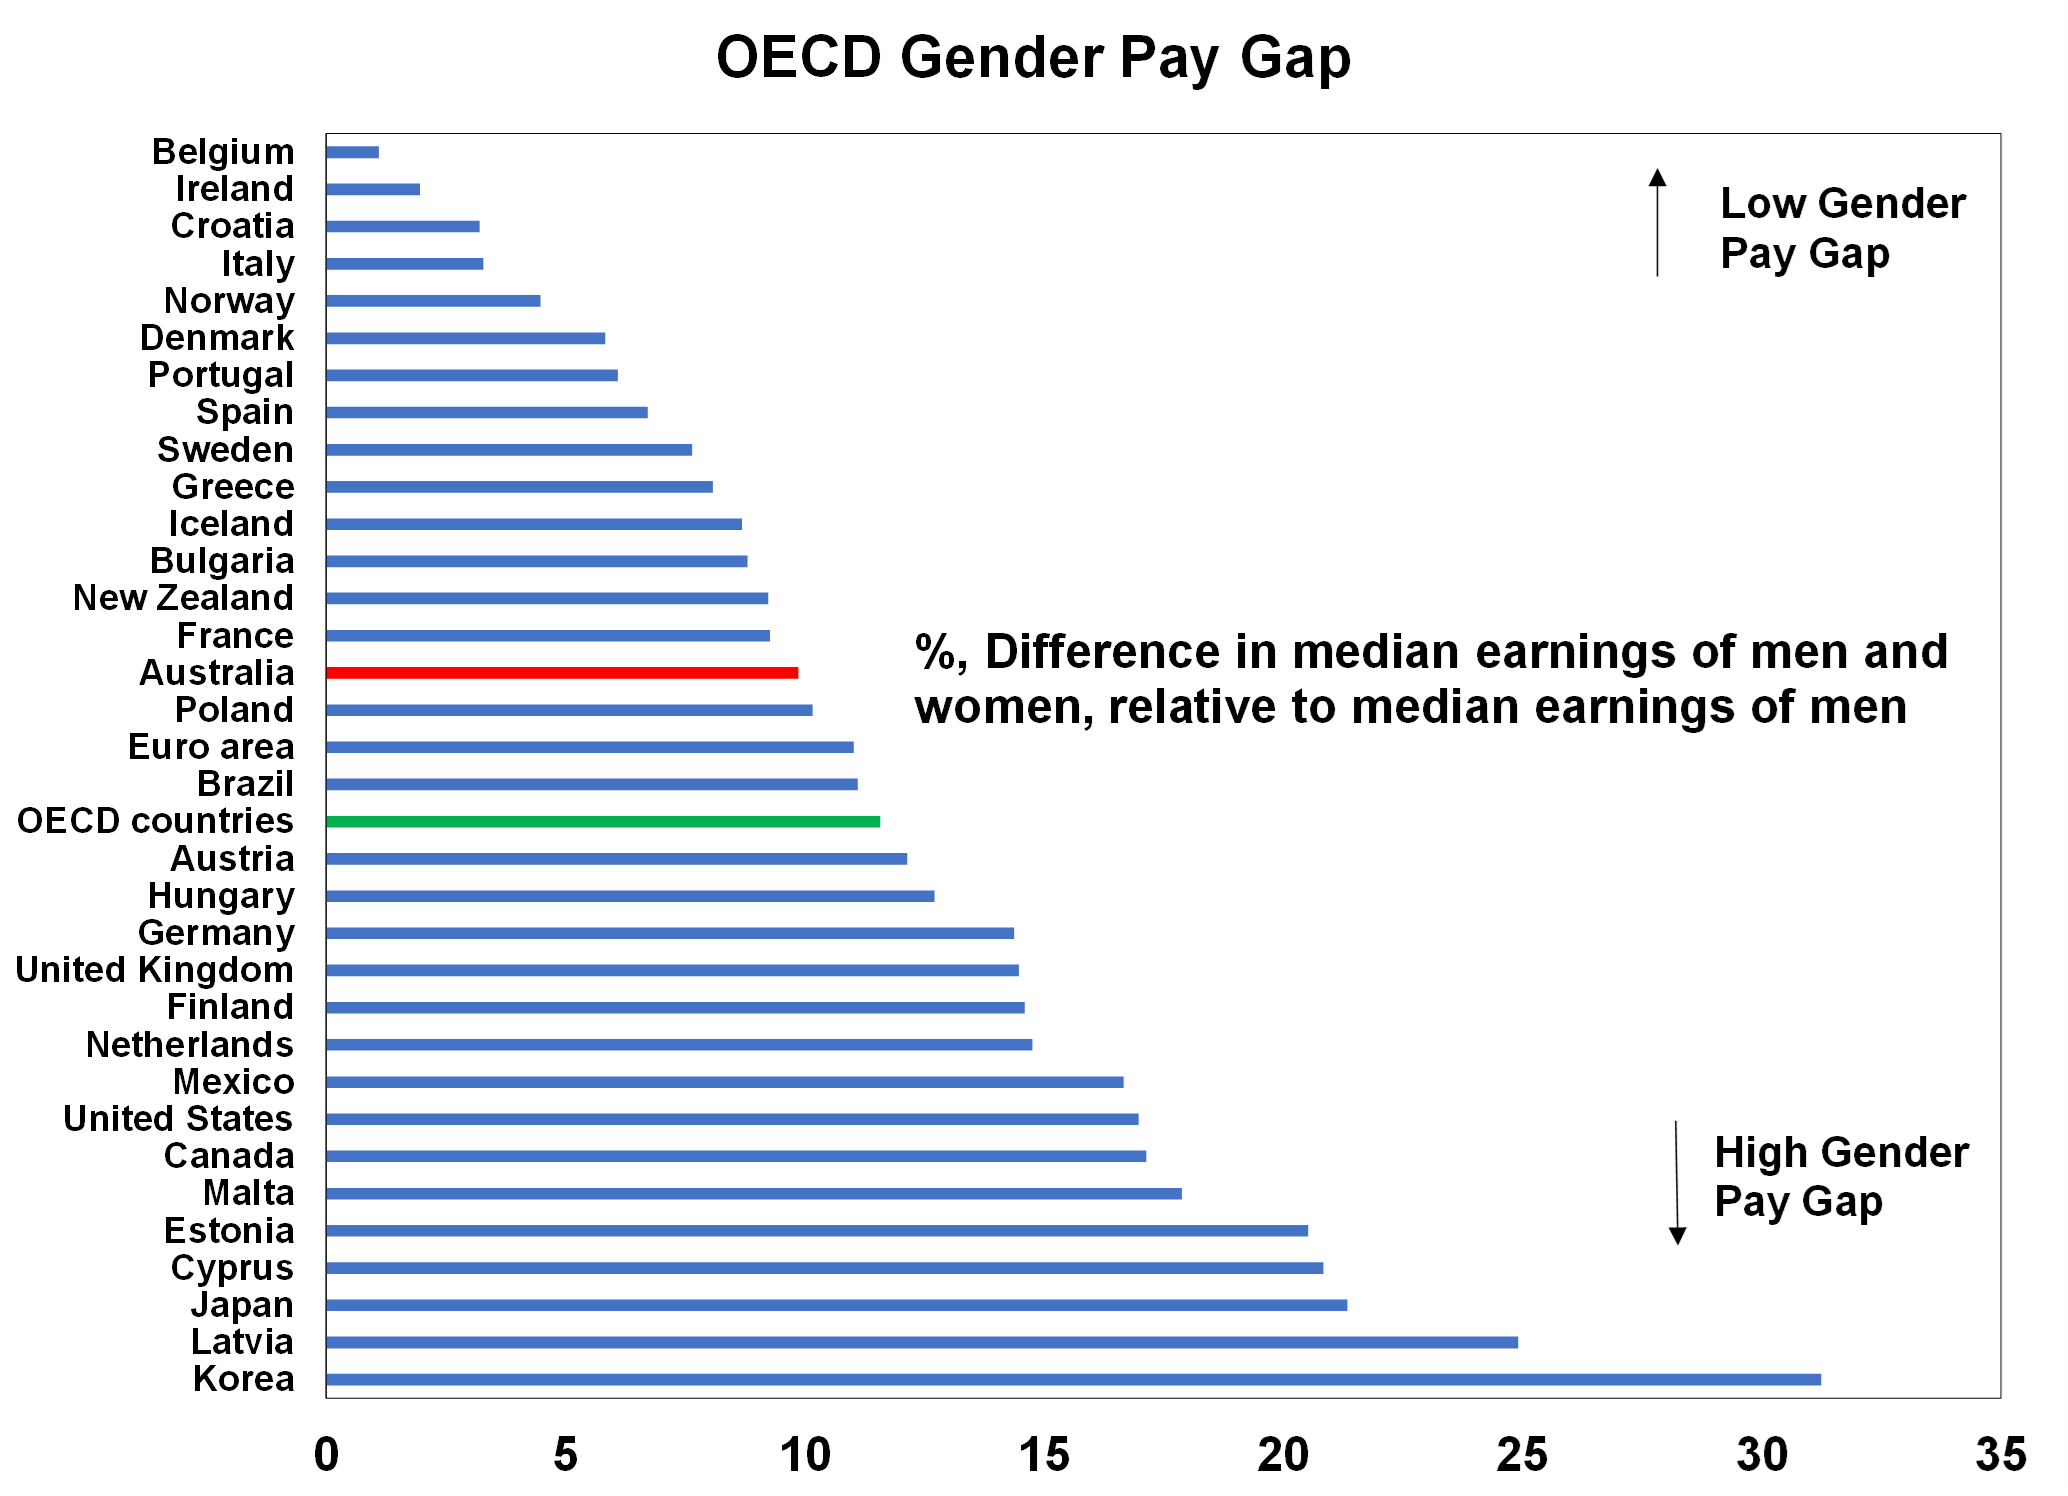
Source: ABS AMP
Unconscious gender biases in the workplace are still a big problem and need to be continually improved, but the other two main reasons for the difference in earnings between genders is the line of work undertaken and the decision to have children which takes time out of the workforce and can then result in a change of role or moving to part-time work. There is a significantly higher share of females in service-based industries (see the chart below) of health care and social assistance and education which are typically less lucrative, have higher flexibility around hours of work and require less travel requirements. While male dominance in manual industries like construction, mining, transport and postal, electricity, gas and water services and the manufacturing industries are typically paid higher rates because they are associated with less flexible hours and risky and manual work. There is probably also some societal bias that has typically placed less value on “softer” services skills.
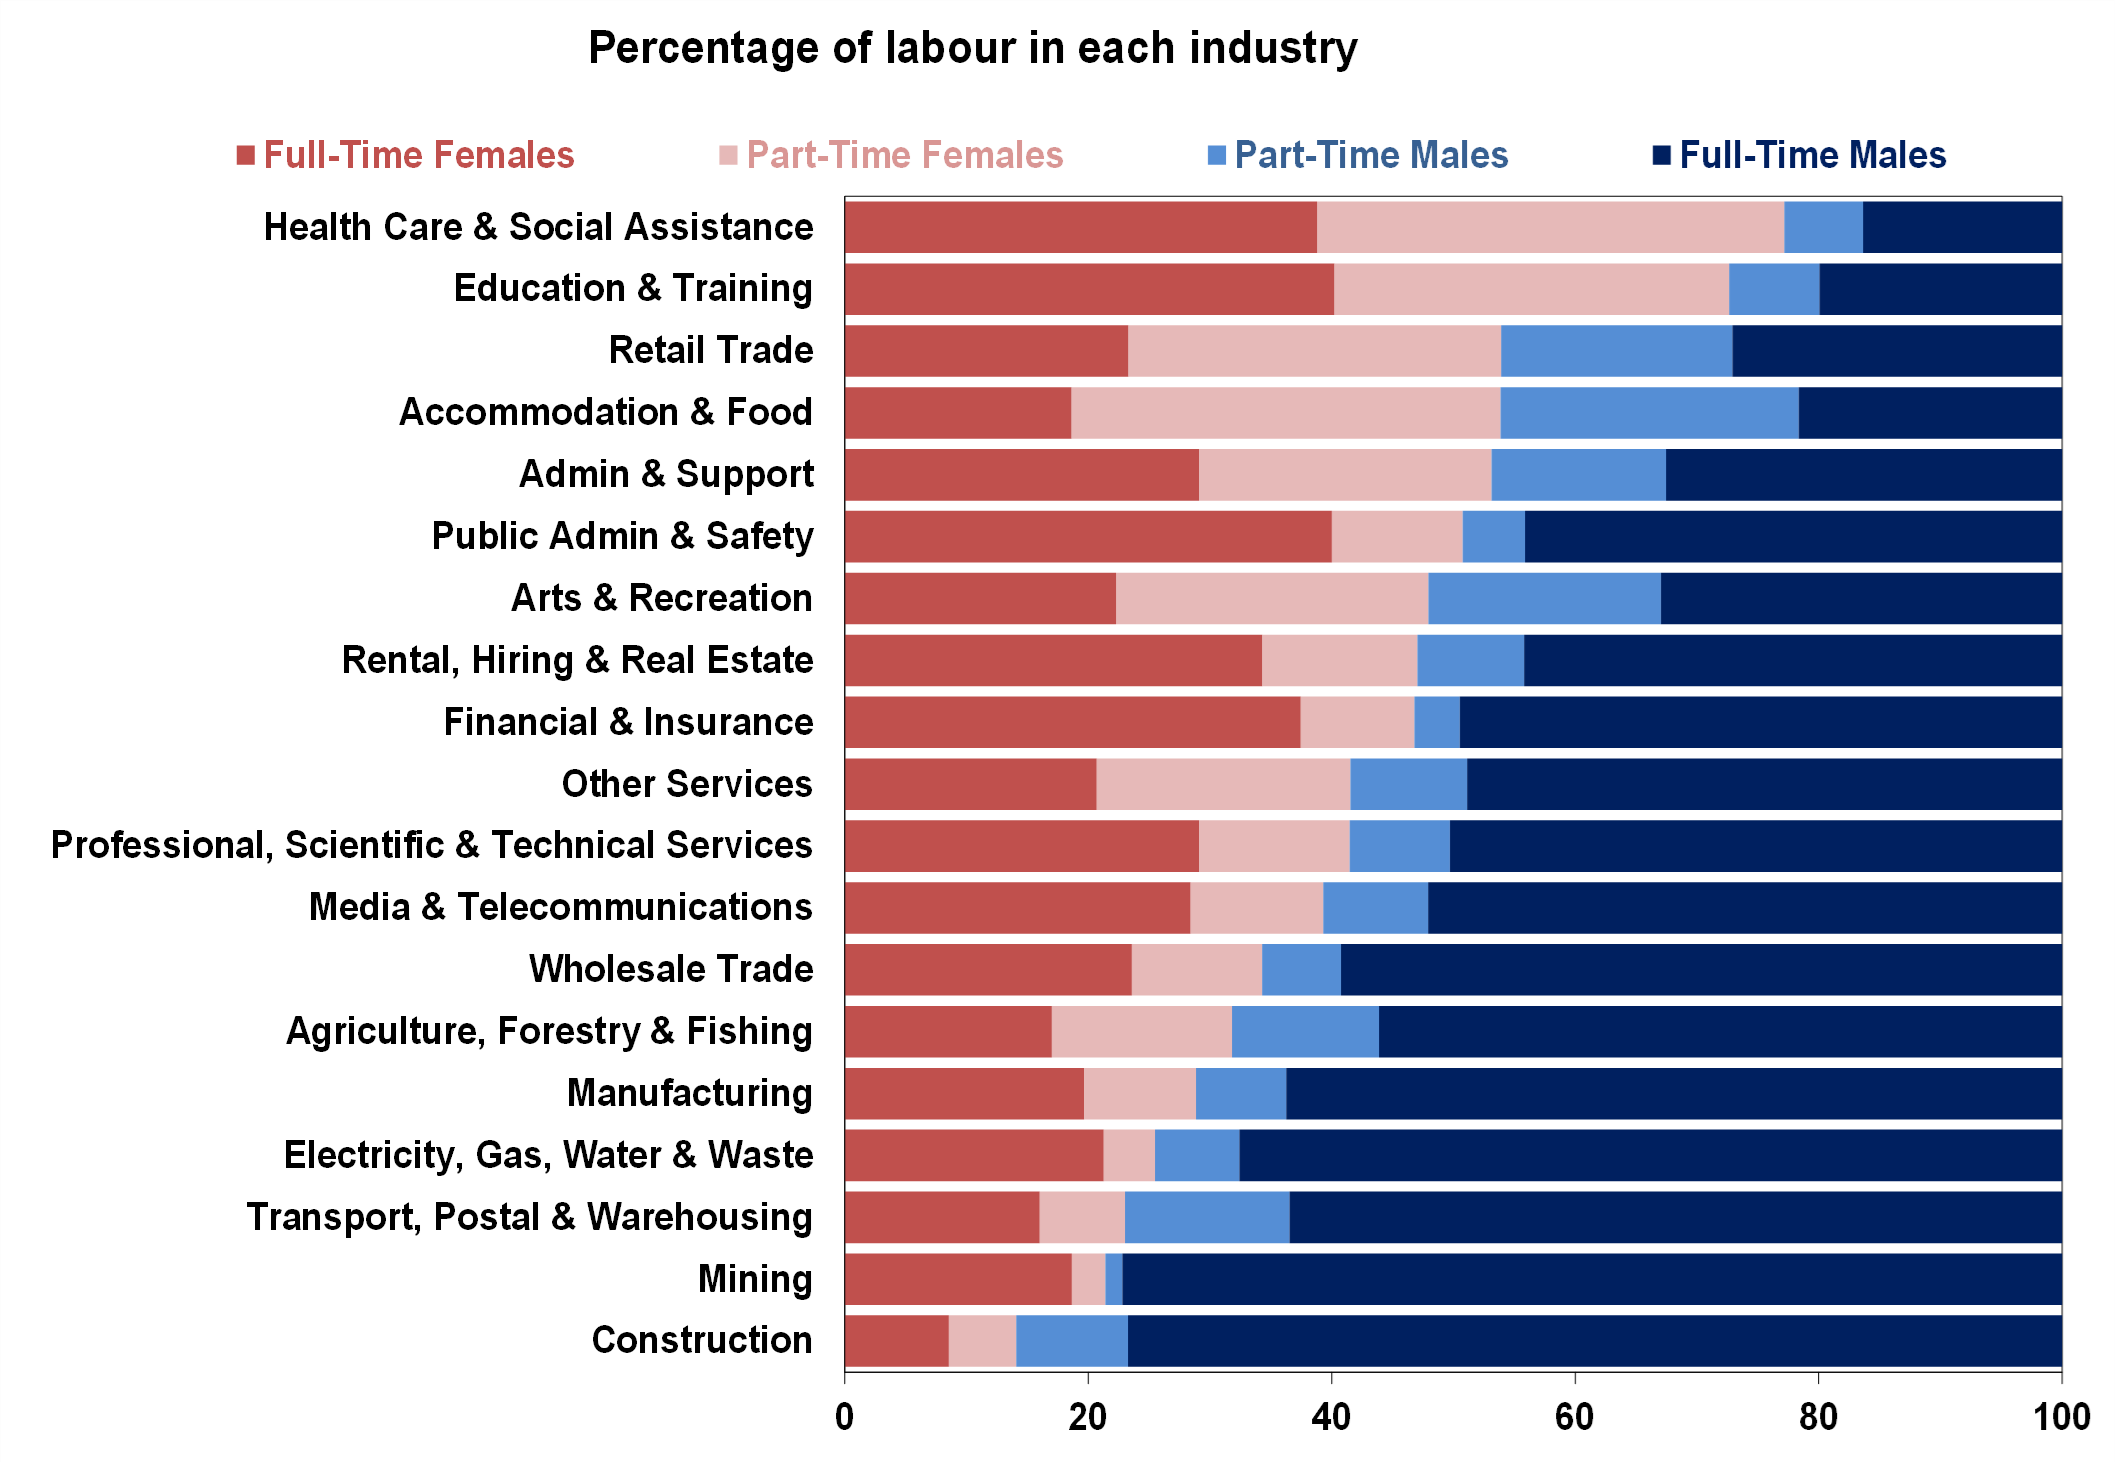
Source: ABS AMP
The increasing importance of artifical intelligence means that both routine manual and routine cognitive jobs are at risk of being replaced which may impact male employment in these sectors which have a higher male full-time share. And an aging population means that the share of non-routine manual work will continue to rise which could help women. However, the larger share of males in the technology industry could mean that women are also left behind as technology increases in importance.
The difference in male and female job careers starts before the workplace. The chart below looks at HSC school enrollments in subjects with the biggest gender gaps. Females dominate in subjects like textiles and design, society and culture, Aboriginal studies and food technology while males significantly dominate in software design, engineerng studies and information processes and technology.
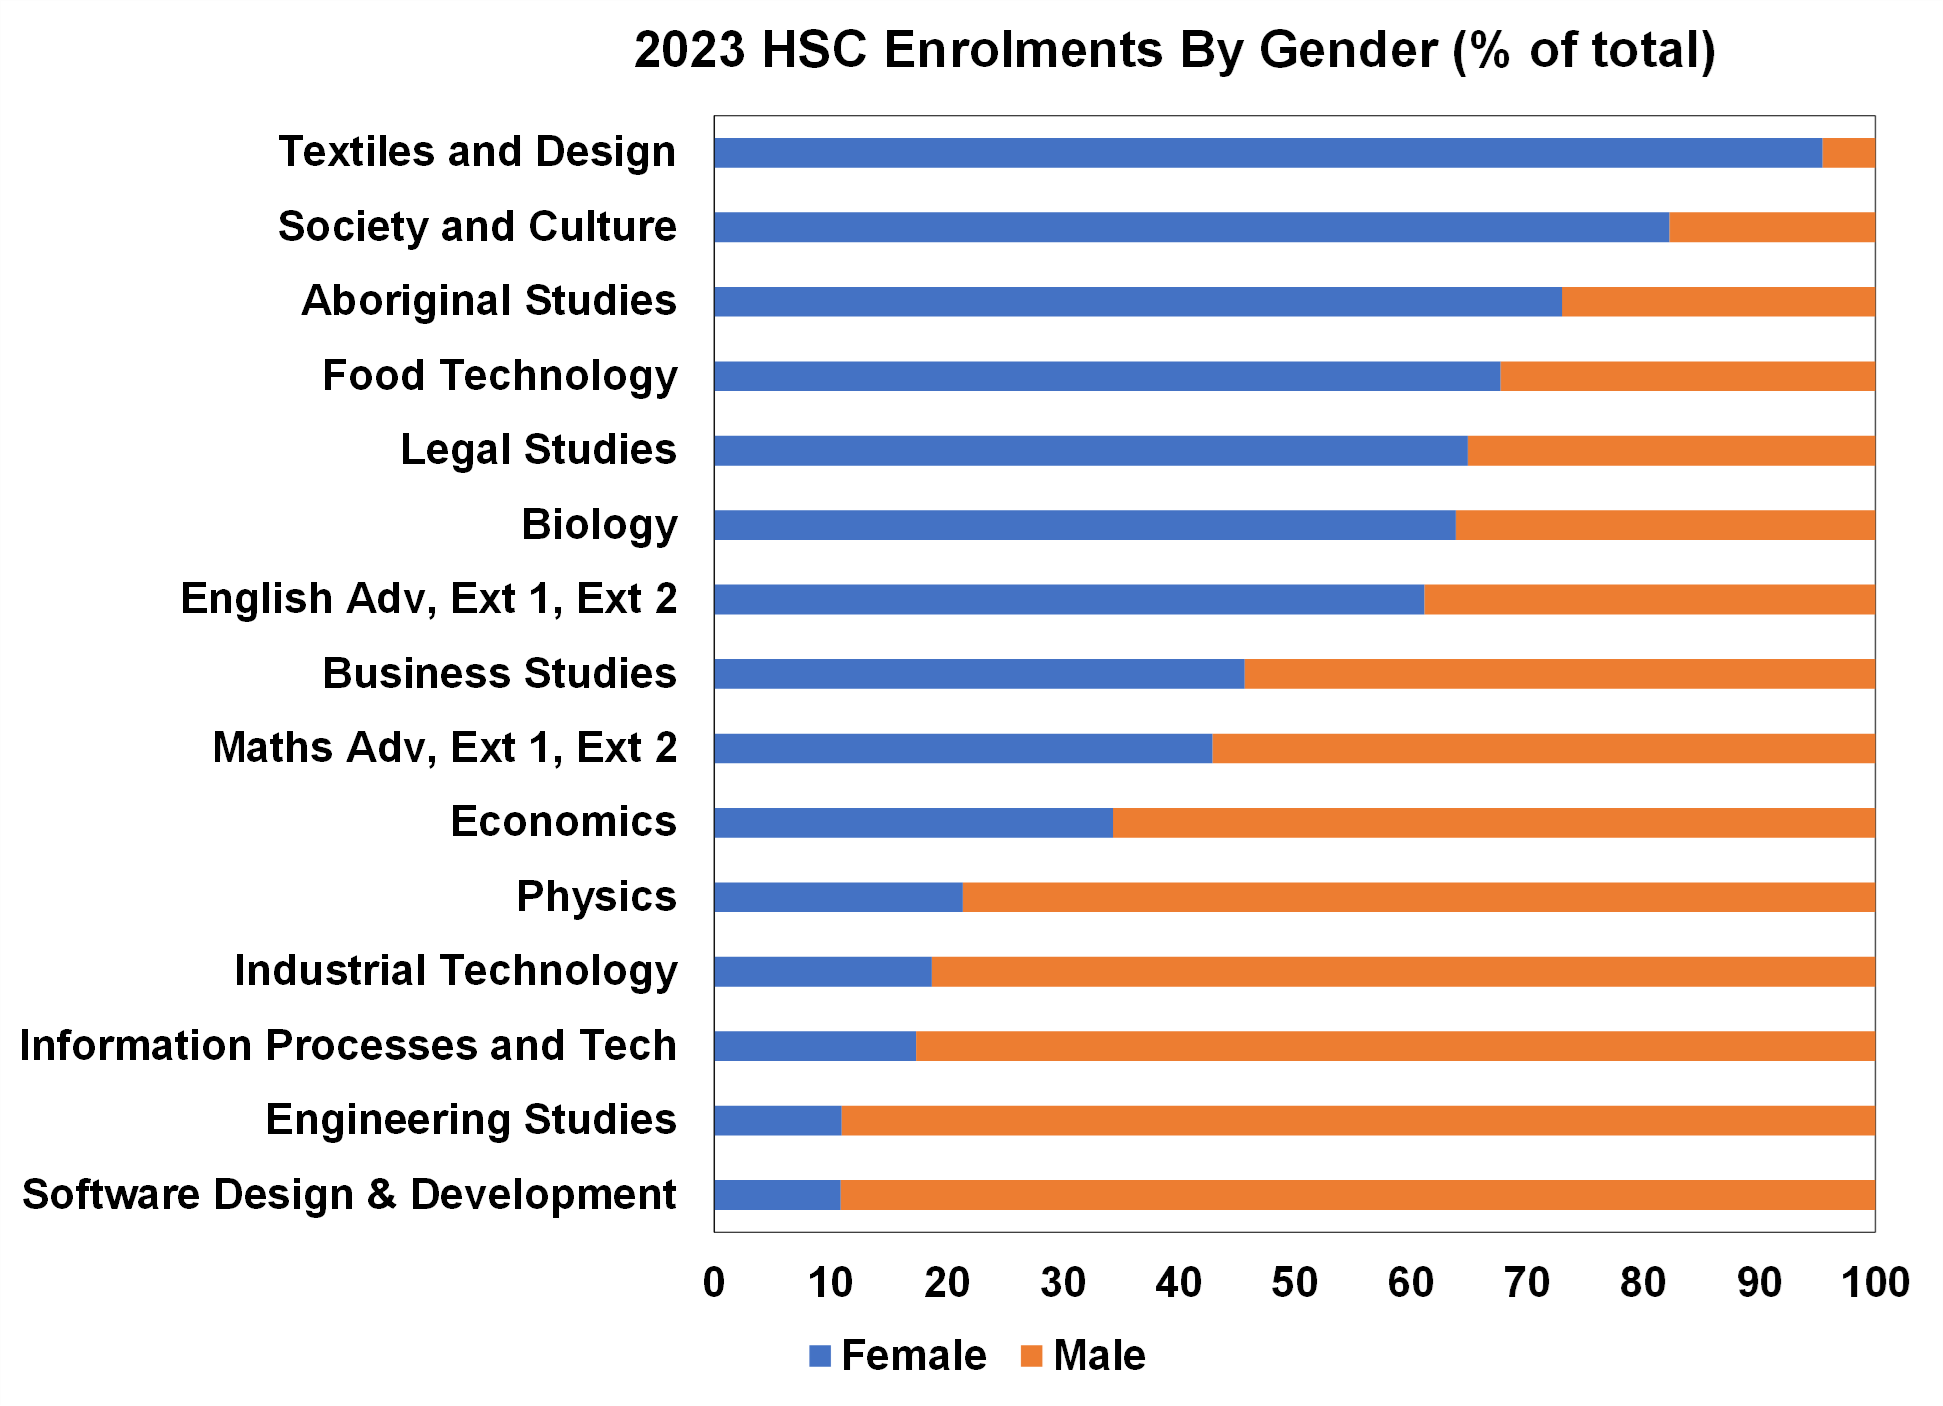
Source: NSW Government, AMP
What policies can help these issues
From our point of view, there are three main areas that Australia needs to improve on to continue making progress on gender equaltiy. Firstly, there needs to be education around financial literacy starting at a primary school level, to lift financial literacy for women which is falling behind males as we have written about previously. Secondly, despite the recent postitive changes to childcare subsidies and the broadening of the paid parental leave scheme from the Labor government, there is still a need for more support for paid parental leave as Australian leave policies are not as generous compared to global peers that are having better results in reducing the gender pay gap. Early childcare funded by the private sector and government pre school funding is not sufficient. The countries that do the best on gender equality all have very generous parental leave schemes and universal access to early childcare. And lastly, there needs to be continued change in Australian society accepting men taking time off to look after the family and encouraging a more holistic perspective on the work-life balance as well as teaching girls the possible career pathways (and financial consequences) of the subjects that are taken at school. The countries that tend to do the best in terms of gender equality and life balance are those with very generous welfare systems (that allow long leave periods) where equality within the family is ingrained in the culture. Men also need to take more of a role in unpaid domestic work. While men (on average) work more hours per day than women which leaves less time for other home-based activities, once you include total “work” which includes paid work, education and all unpaid domestic work including childcare then females on average still “work” an additional 18 minutes a day comapred to men, which equates to 110 hours or 4.6 days per year which means less free time (and arguably more stress!).
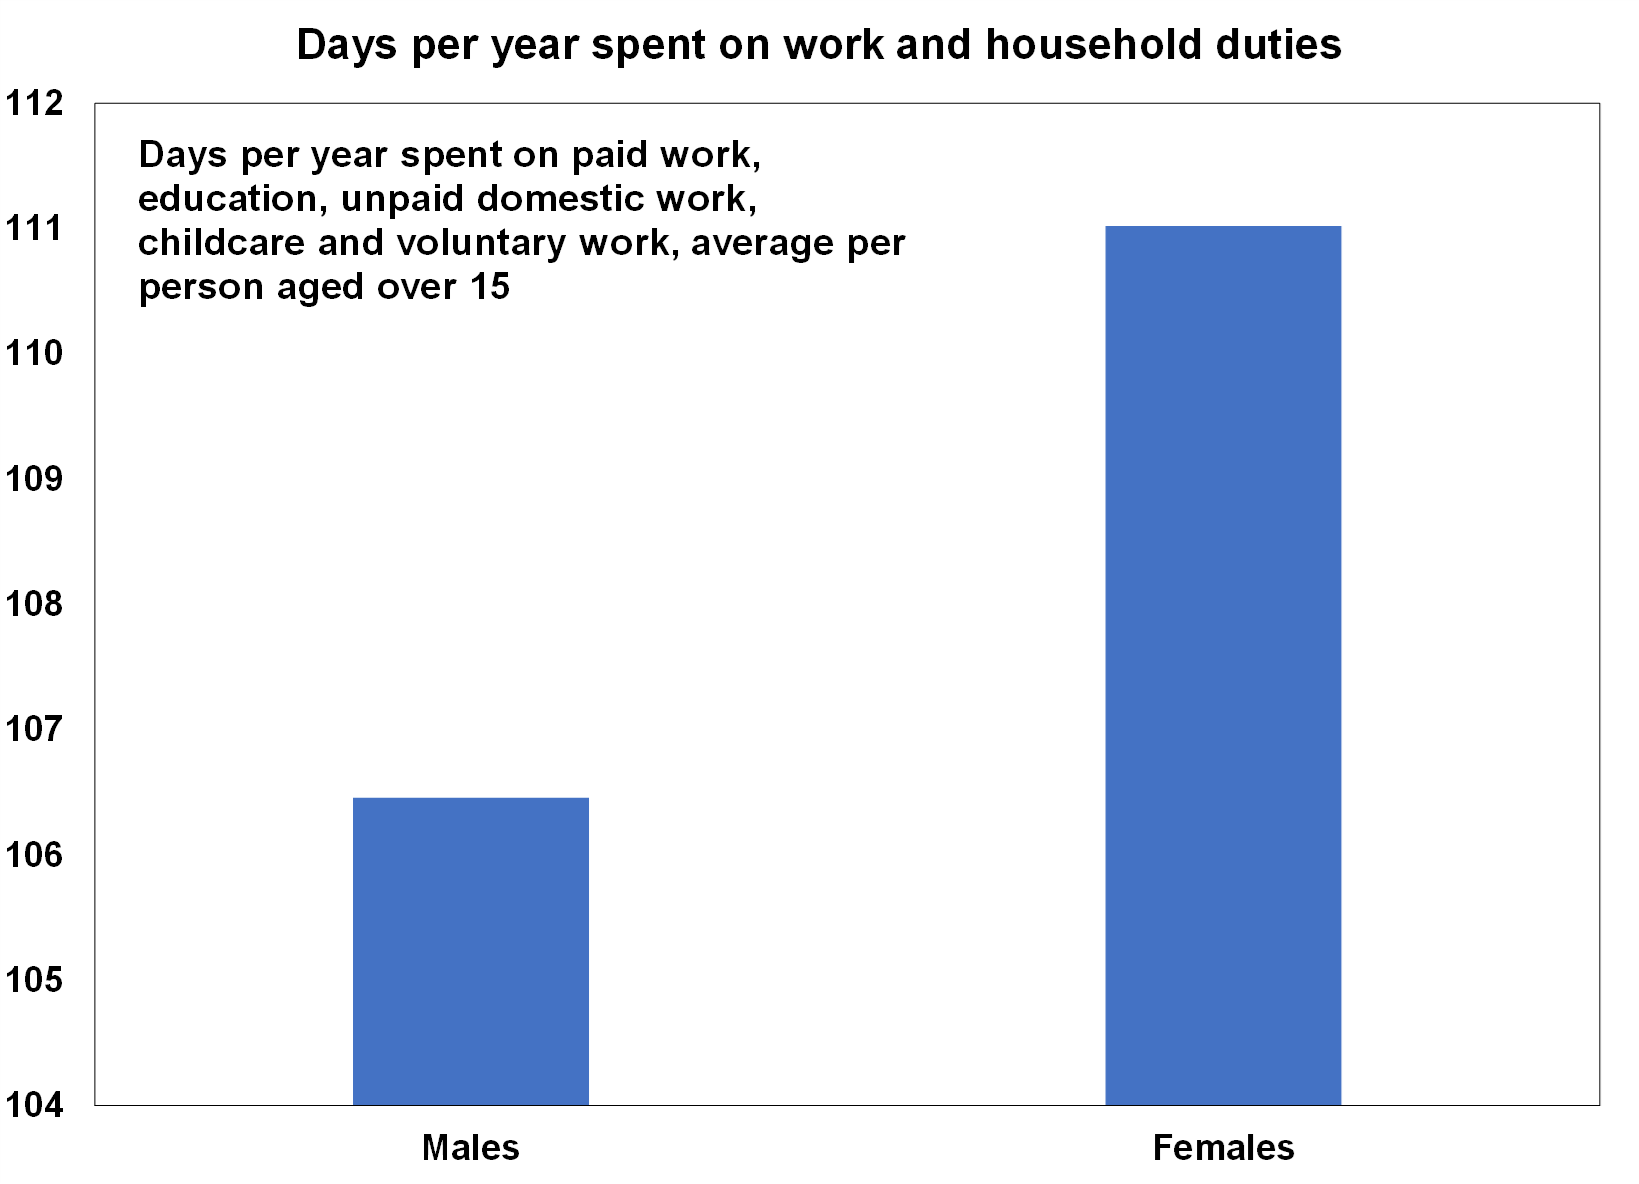
Source: ABS, AMP

Oliver's insights - the art of happiness
29 April 2024 | Blog This article looks at happiness and whether economics is failing us with its focus on GDP and consumption. Read more
Weekly market update 26-04-2024
26 April 2024 | Blog Dr Shane Oliver notes that shares have bounced but is the correction over?; strong US earnings; US PCE less bad than feared; Australian rate cuts delayed, another rate hike is a high risk; and more. Read more
Weekly market update 19-04-2024
19 April 2024 | Blog Dr Shane Oliver comments on the correction time for shares; escalation risk in Israel's counter-retaliation; rate cut delays but inflation still falling ex US; supply boost helping cool Aust labour market; expect Aust Q1 CPI to slow to 3.4%yoy; and more. Read moreWhat you need to know
While every care has been taken in the preparation of this article, neither National Mutual Funds Management Ltd (ABN 32 006 787 720, AFSL 234652) (NMFM), AMP Limited ABN 49 079 354 519 nor any other member of the AMP Group (AMP) makes any representations or warranties as to the accuracy or completeness of any statement in it including, without limitation, any forecasts. Past performance is not a reliable indicator of future performance. This document has been prepared for the purpose of providing general information, without taking account of any particular investor’s objectives, financial situation or needs. An investor should, before making any investment decisions, consider the appropriateness of the information in this document, and seek professional advice, having regard to the investor’s objectives, financial situation and needs. This article is solely for the use of the party to whom it is provided and must not be provided to any other person or entity without the express written consent AMP. This article is not intended for distribution or use in any jurisdiction where it would be contrary to applicable laws, regulations or directives and does not constitute a recommendation, offer, solicitation or invitation to invest.
The information on this page was current on the date the page was published. For up-to-date information, we refer you to the relevant product disclosure statement, target market determination and product updates available at amp.com.au.

