Key points
- There is concern that services inflation in Australia will stay high which will threaten the RBA’s 2-3% inflation target.
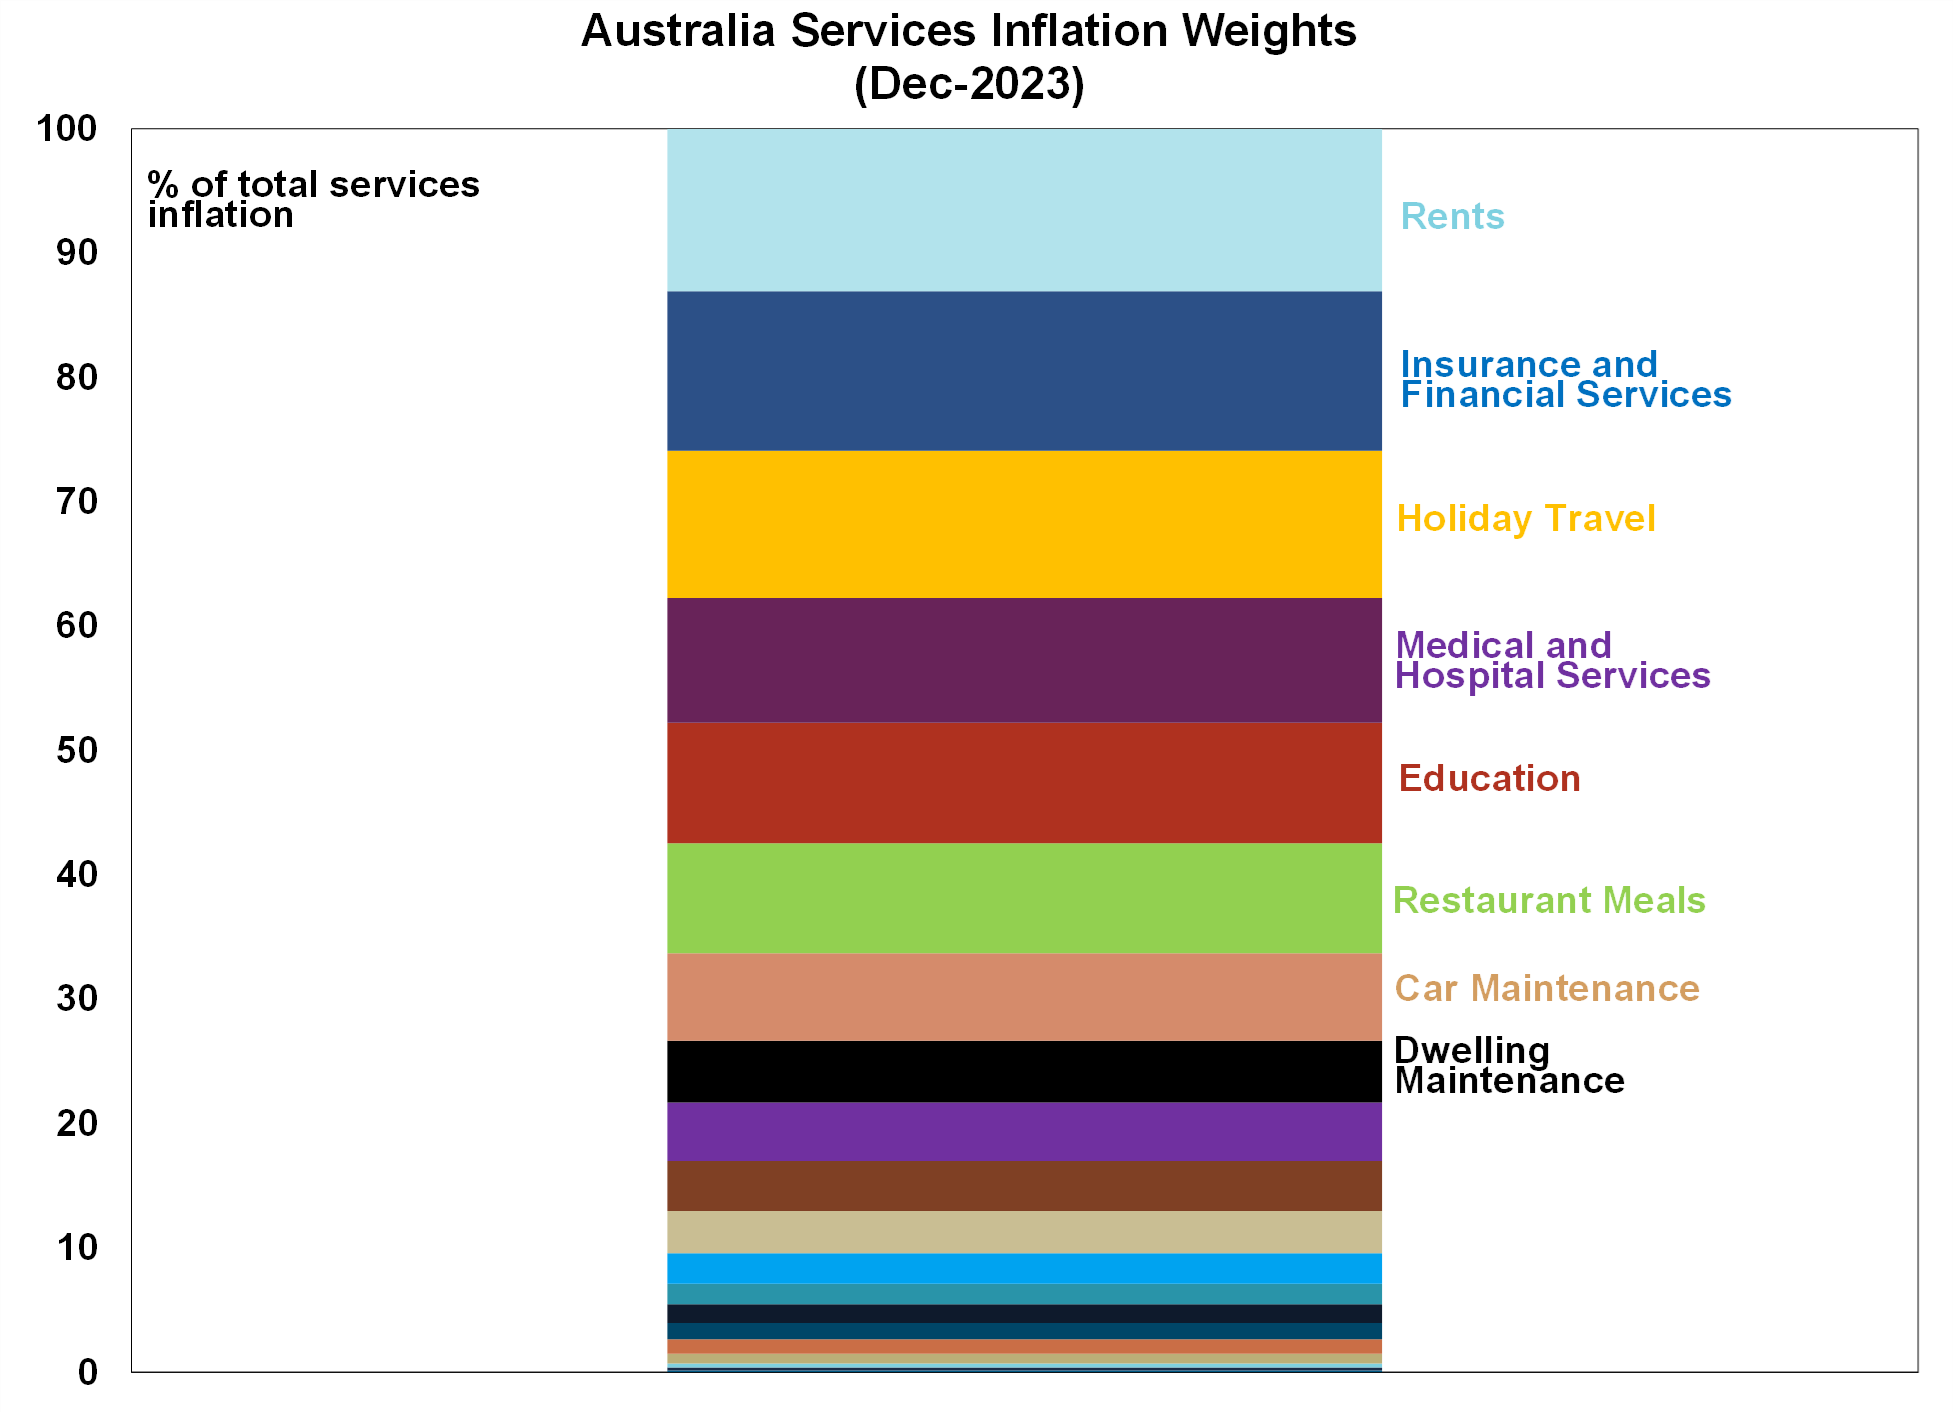
- The largest services categories in the consumer price index are: rents, insurance and financial services, holiday travel (domestic and international), medical and hospital services, education and restaurant meals.
- Inflation in most of these categories looks to be past its peak. Immigration in early 2024 remains too high but should slow from here which will reduce rental growth; consumer spending on travel and eating out has slowed right down and wages growth which impacts all services inflation will soften as the unemployment rate increases.
- We think the RBA’s forecasts on inflation (which expect headline and trimmed mean inflation to be over 3% by Dec-2024) are too high. A faster decline in inflation over 2024 should see the start of rate cuts by around mid-year.
Introduction
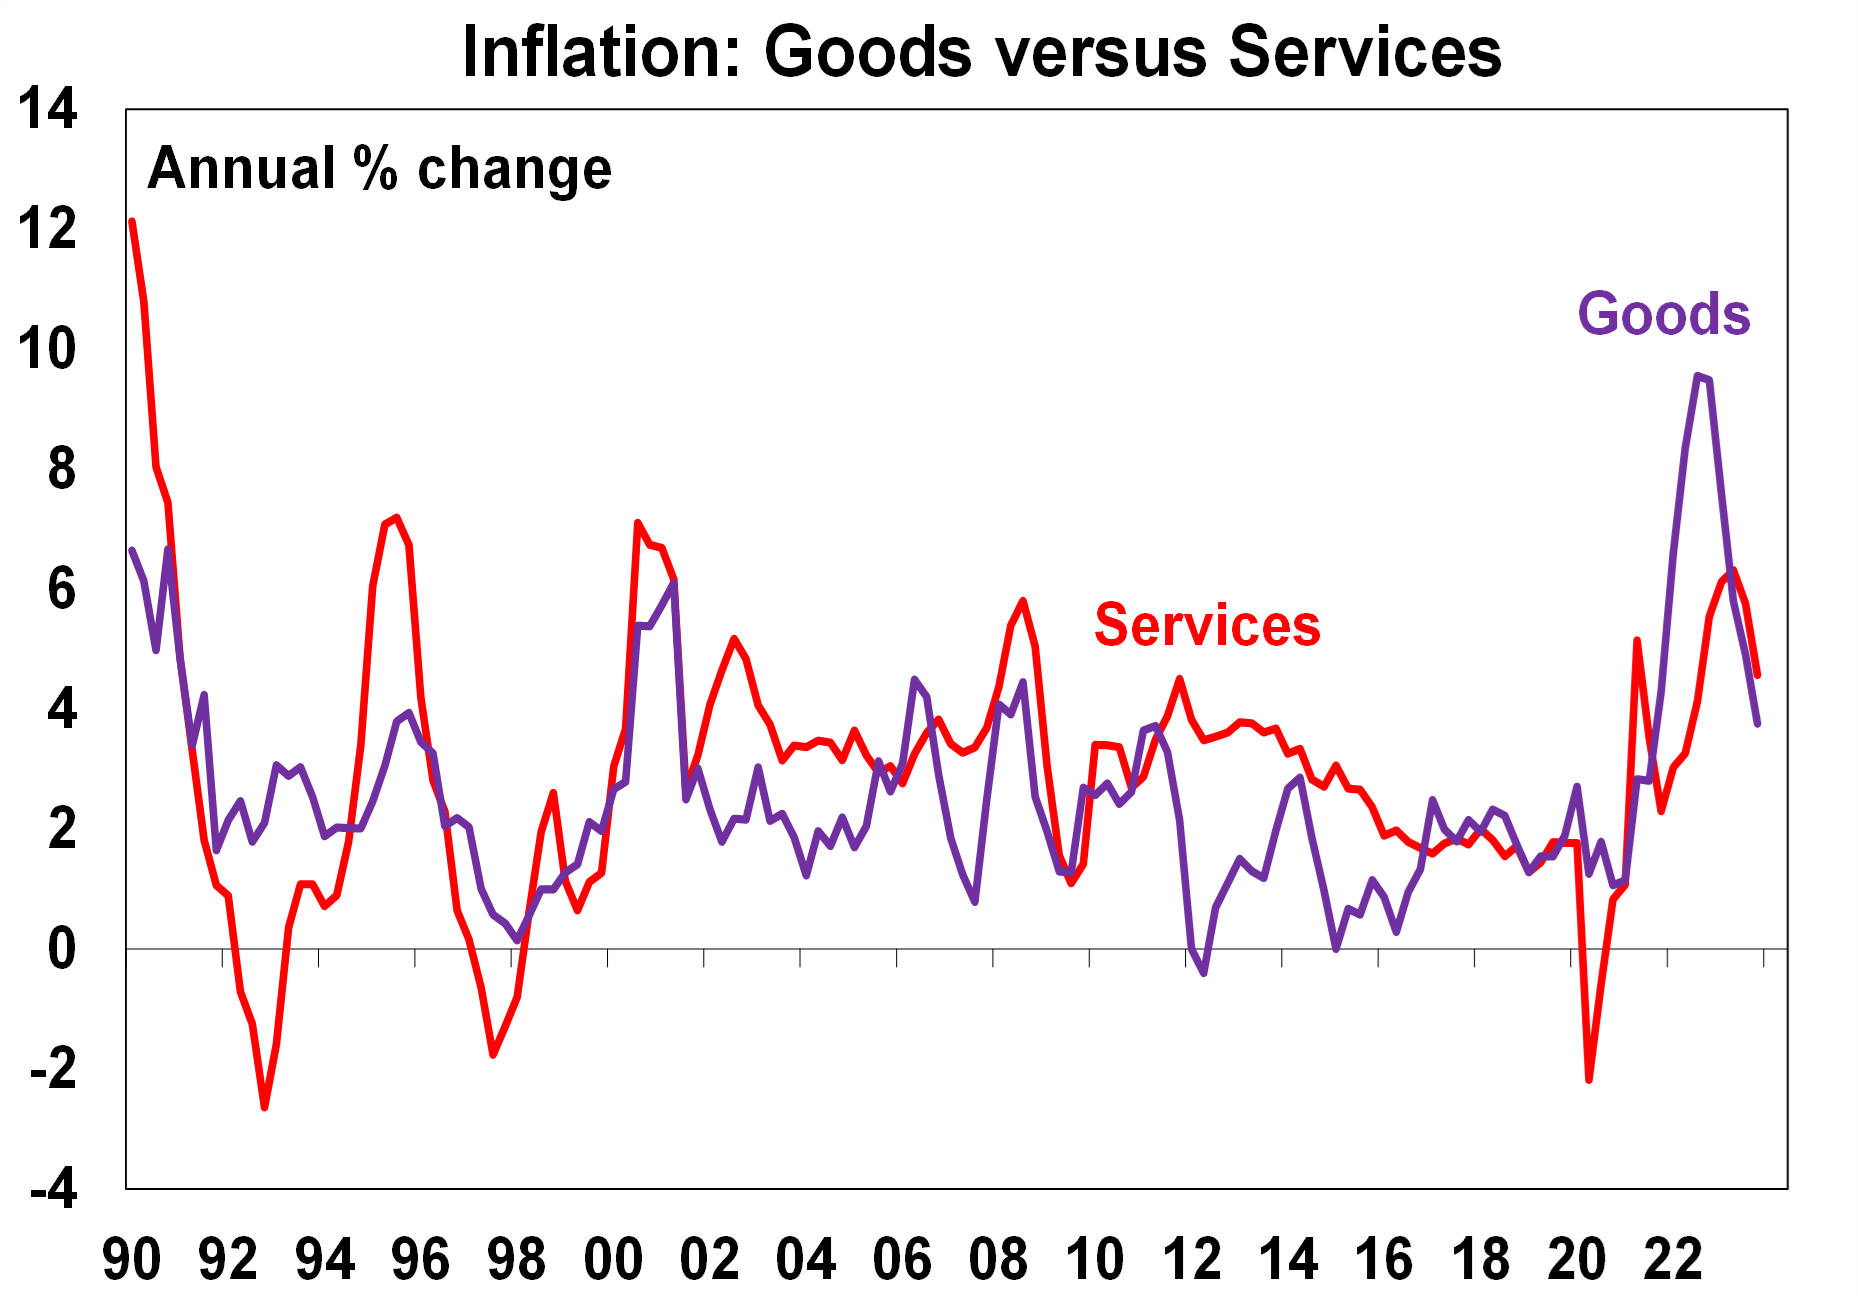
The Reserve Bank of Australia is forecasting a further slowing in inflation to 3.3% by June and 3.2% by December and these forecasts are underpinned by expectations of a further moderation in services inflation. Goods inflation has more than halved from its peak of 9.6% per annum in September 2022 to its current level of 3.8% year on year to December 2023 (see the chart below). Services inflation is running at 4.6% year on year to December 2023.
Source: ABS, AMP
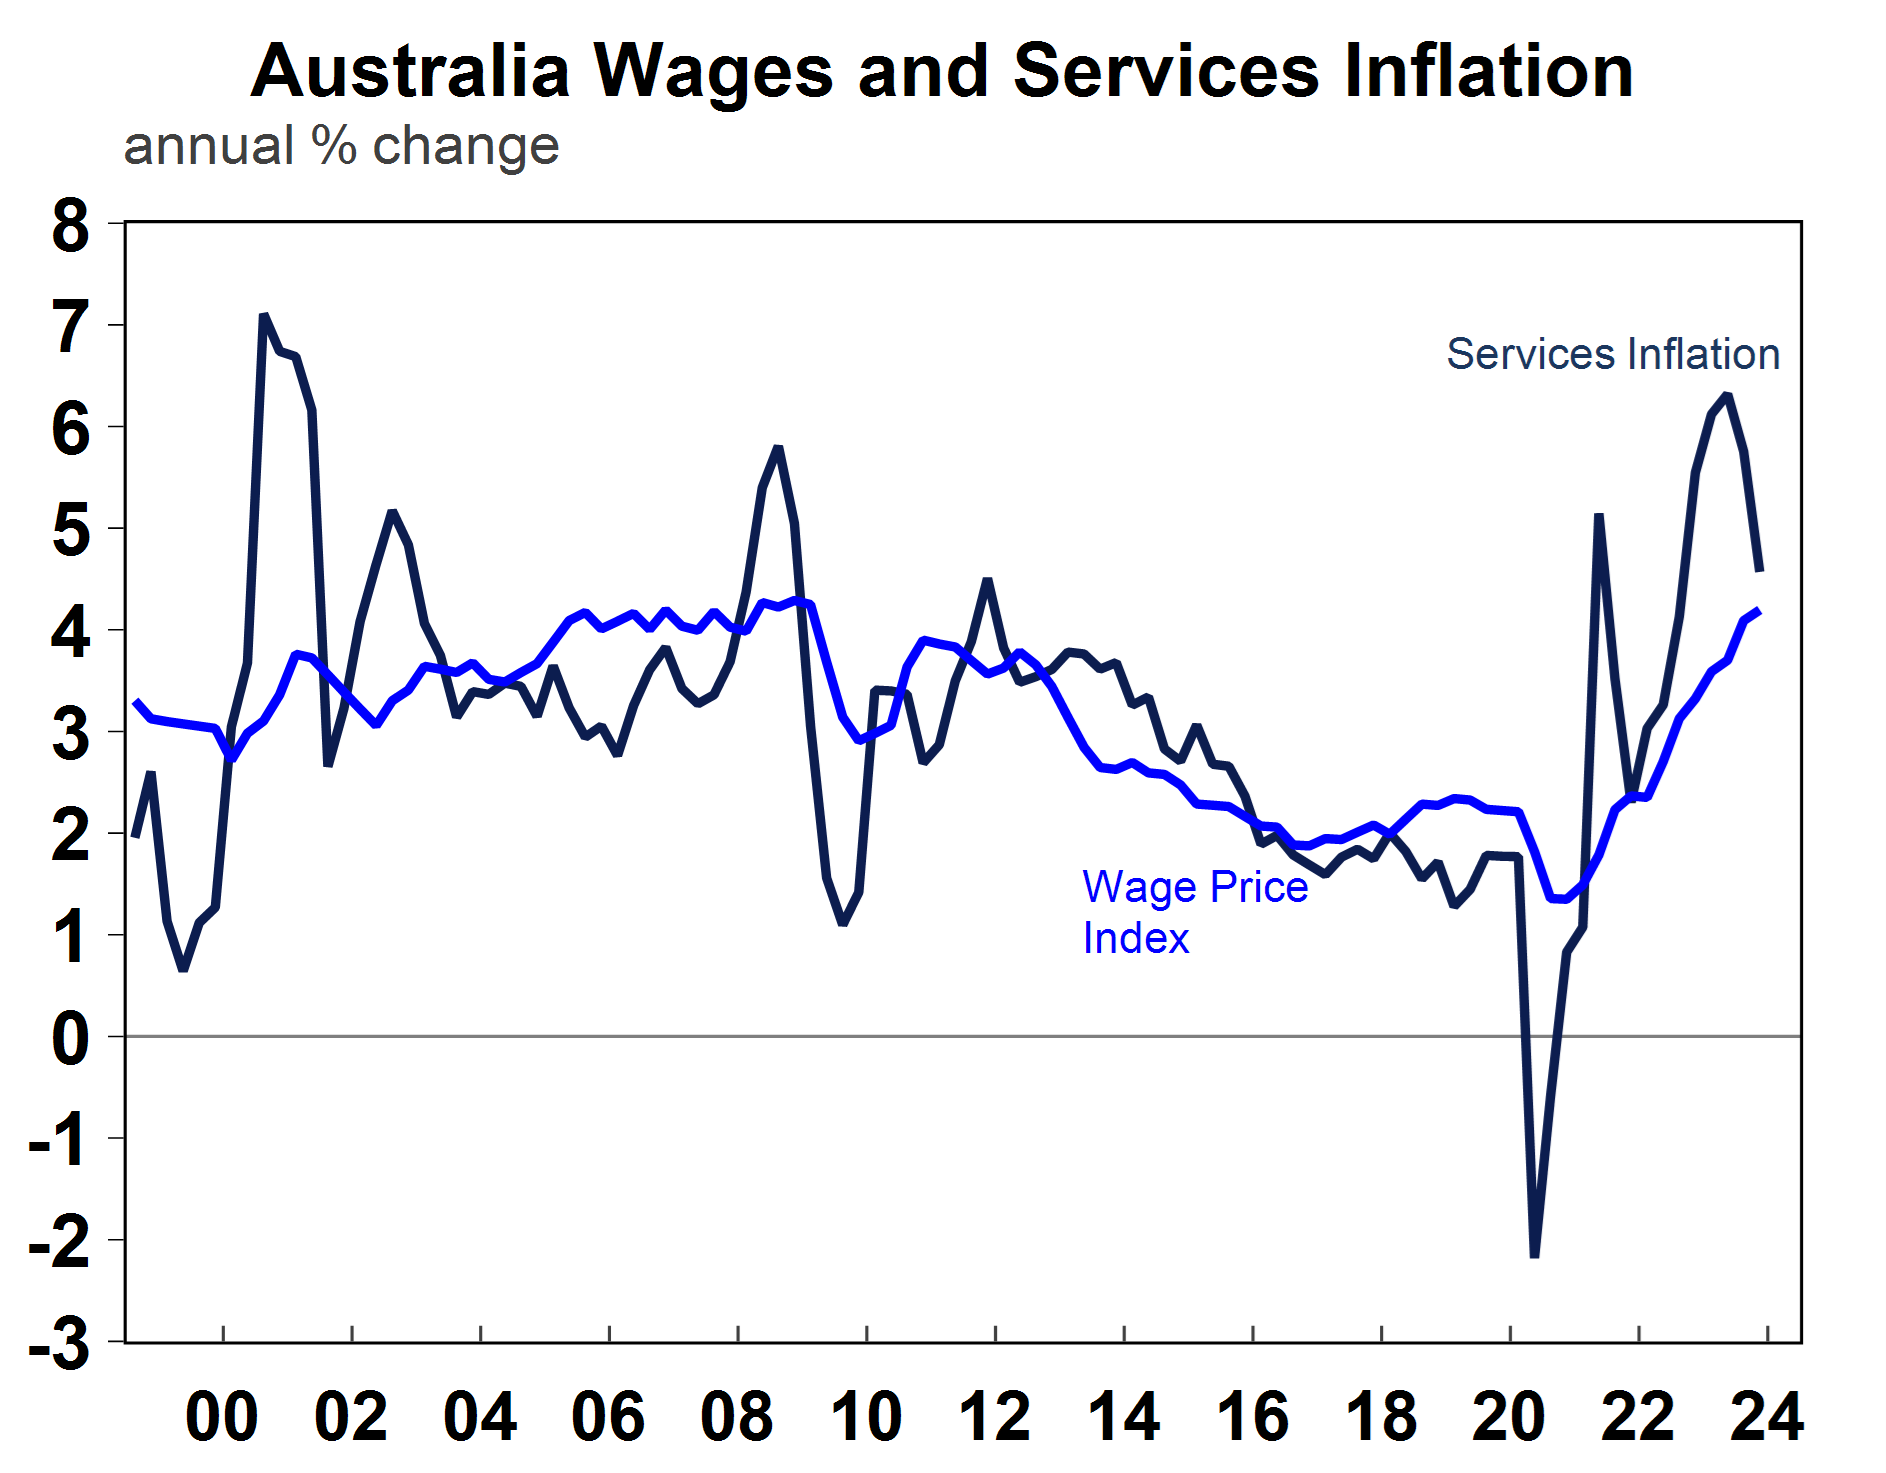
We recently wrote about the strong impact of wages on services inflation in the US. In Australia, wages and services inflation tend to move in similar trends (see the chart below) but services inflation is less sensitive to changes in wages compared to countries like the US. Wages growth has more inertia in the Australian labour market because more than 60% of the workplace is tied to either minimum wage, award or enterprise bargaining agreements which are tied and influenced to decisions from the Fair Work Commission in their annual wage review (occurring in June). Public sector wages also tend to be multi-year agreements which causes inertia in the wage system.
Source: Macrobond, AMP
This means that in Australia, it is important to look at other components of services inflation.
Contributors to services inflation in Australia
The categories that have the highest weights for services in the ABS basket include rents (13%), insurance and financial services (12.8%), holiday travel (11.9%), medical and hospital services (10%), education (9.7%) and restaurant meals (8.9%). These make up over 66% of the services basket (see the chart below).
Source: ABS, AMP
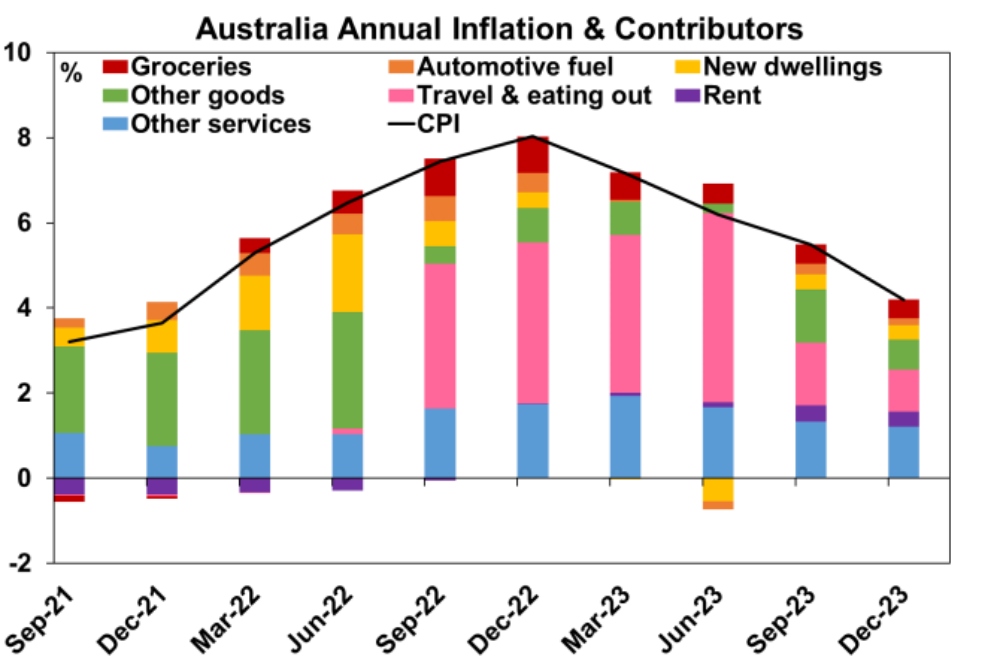
But, the contribution to inflation is affected by the weights of items and price changes. The next chart shows the main contributors to inflation (which includes goods and services) over recent quarters and also the areas that have captured attention in the media around “cost of living” issues.
Source: Macrobond, AMP
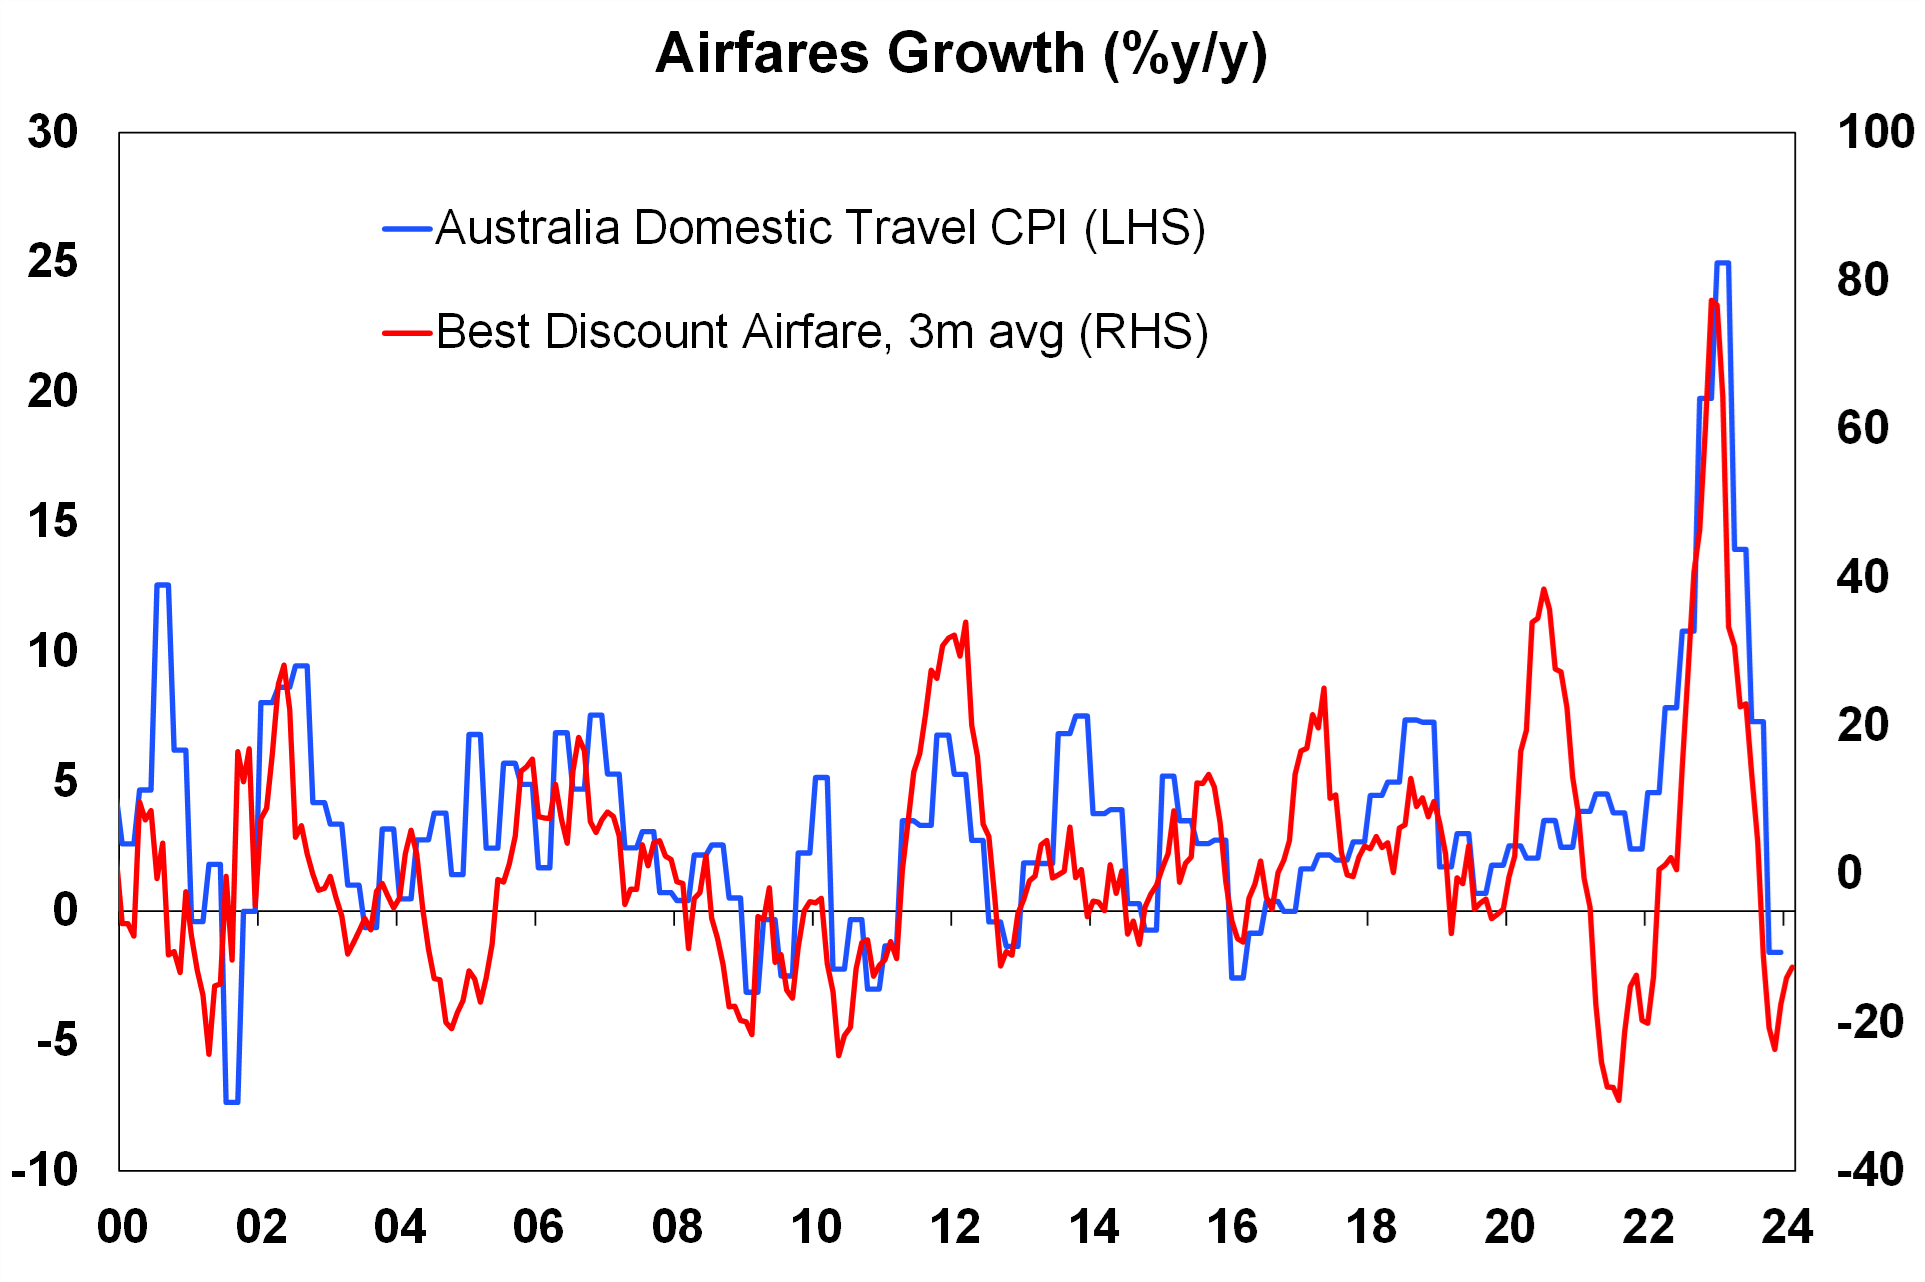
Travel and eating out has made a big contribution to services inflation since late 2022, although it has been slowing in the last two quarters and a further decline is likely. Consumer spending volumes on recreation and culture is down by 3.6% over the year to December and hotels, cafes and restaurants spending was 2.7% lower. This reflects a normalisation in services spending after the pandemic (which initially got a big boost in 2022 following the lockdowns) and the broader pressures on consumer budgets including inflation, interest rate hikes and income tax bracket creep.
Source: Bloomberg, AMP
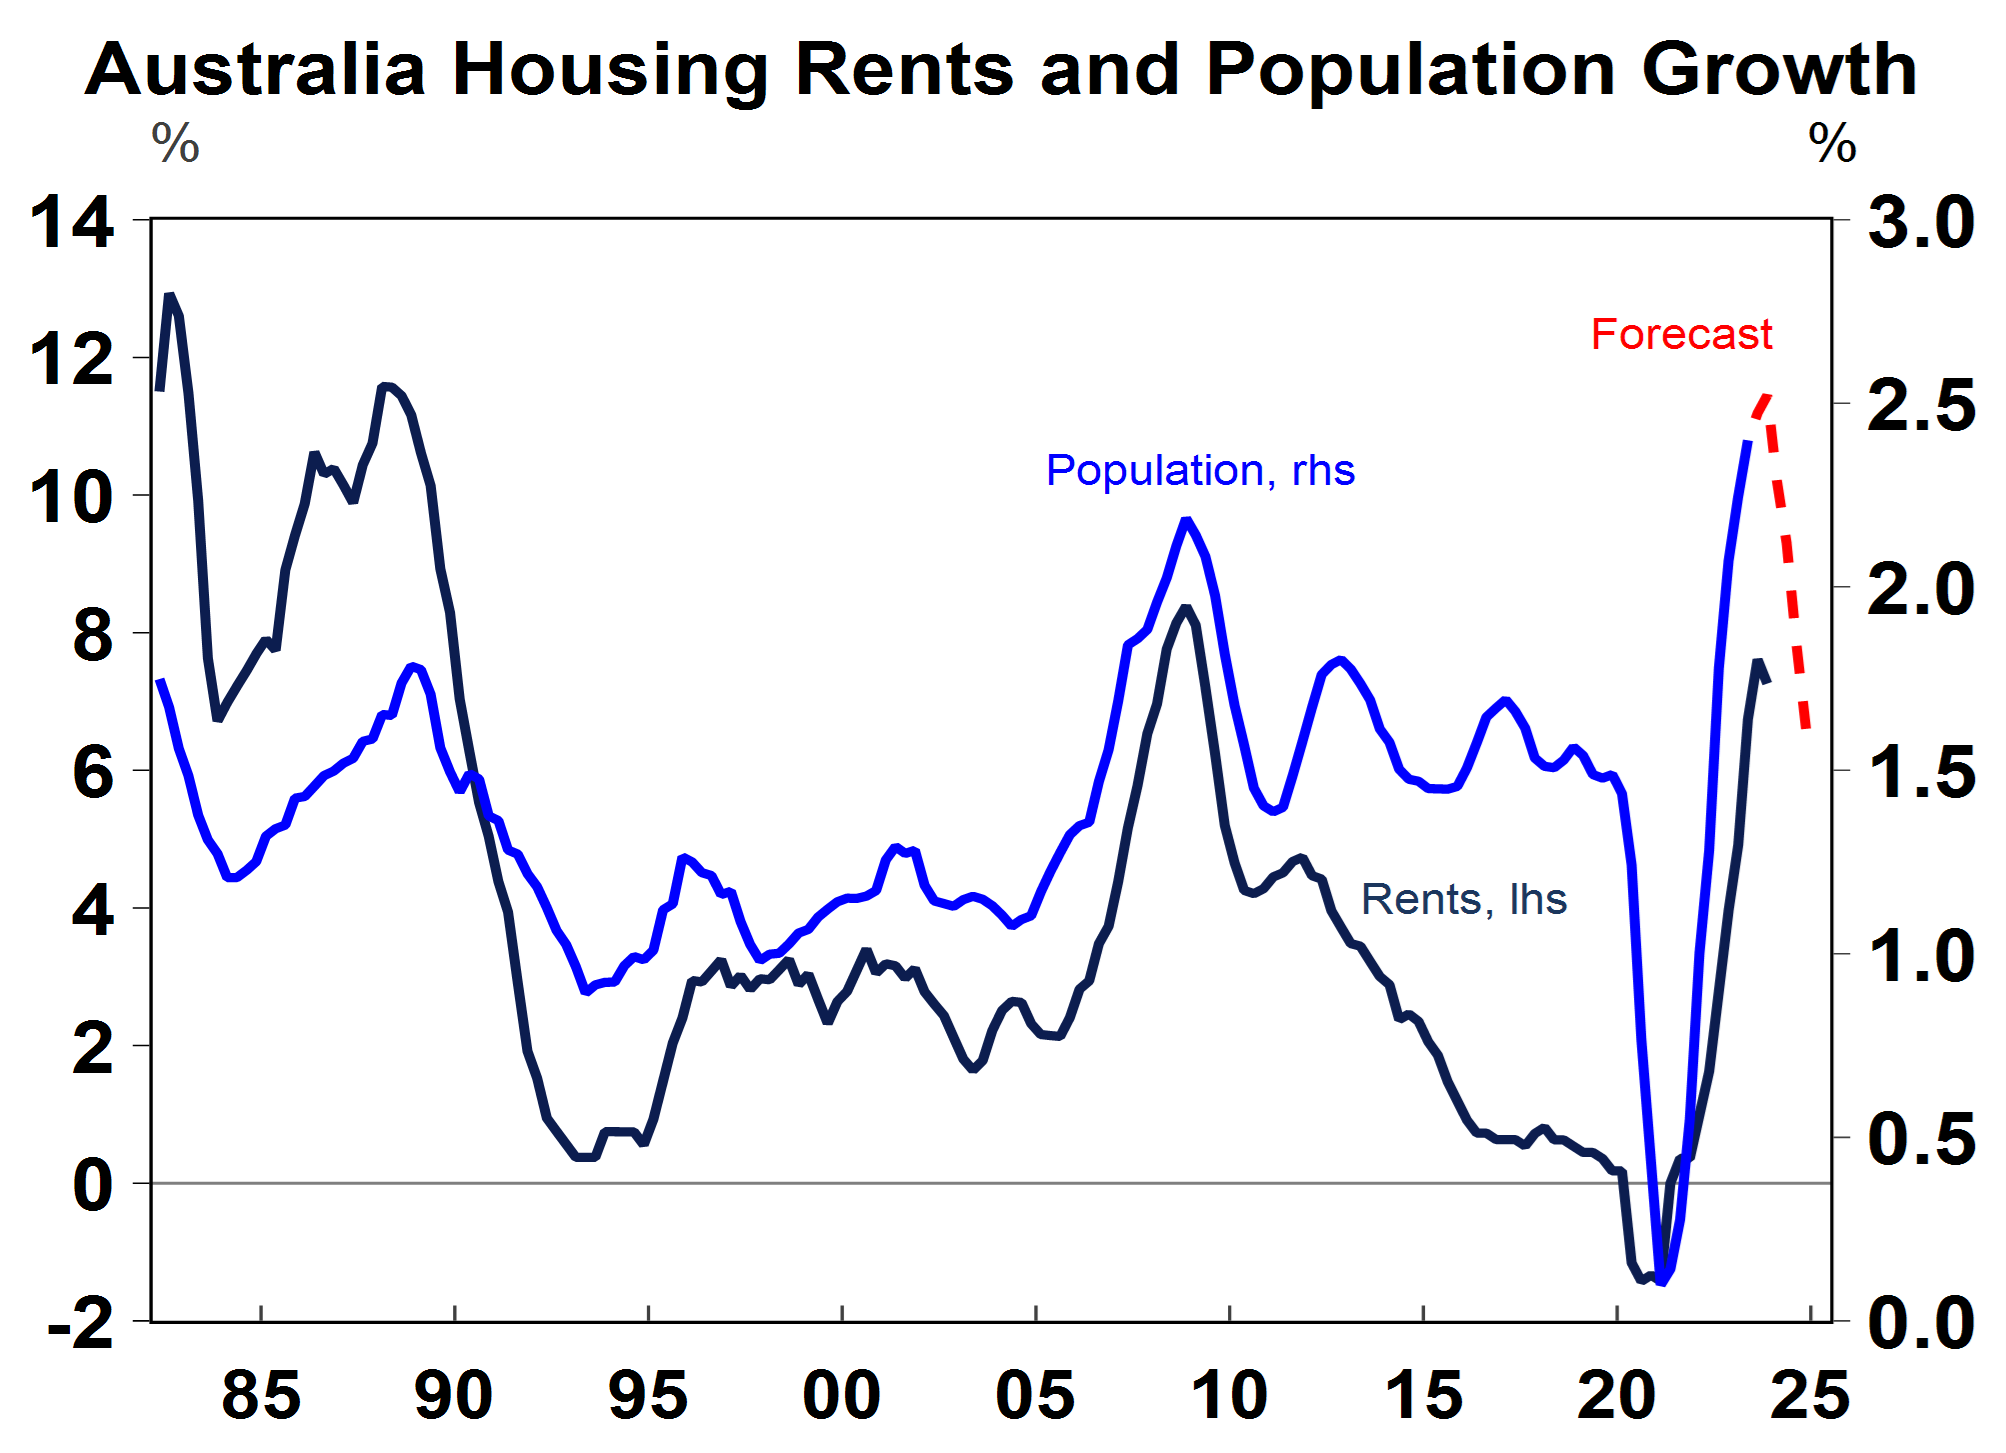
While rental inflation has generated a lot of headlines in Australia lately, it hasn’t been a particularly significant contributor to inflation in recent quarters. Rents were running at 7.3% over the year to December 2023, around their highest levels since early 2009 and this includes the impact of the Commonwealth Rent Assistance support, which is helping to keep a lid on average rents. High rental growth has been driven by strong demand for housing (because of high population growth) at a time when the supply of housing has been constrained (see the next chart). Demand for new housing is running at around 220K per year thanks to the population boom (driven by immigration) which looks to have increased by around 660K over the year to December 2023 (or 2.5% year on year growth) while new housing completions are running around 175K into late 2023 which leaves an ongoing housing shortfall and puts upward pressure on rents. The rate of population growth should slow in 2024, running 1.6% over the year to December 2024, based on Treasury forecasts of population growth and more stringent government requirements around student visa approvals which should help to weaken housing demand. However, monthly net migration data indicates that permanent and long-term migration is still tracking at over 500K in early 2024 which is too high.
New asking rents (which are a leading indicator of rents in the consumer price data) have slowed from 2023 highs (peaking at around 15% year on year) but are still high at around 10% per annum for houses and units.
Source: Macrobond, AMP
Other large-weighting services items like insurance and financial costs are driven by premium adjustments (based on natural disasters, climate changes and changing demographics) and wages. Medical and hospital costs are also driven by wages and demographics. This means that the outlook for wages will give a guide to broader services inflation in 2021.
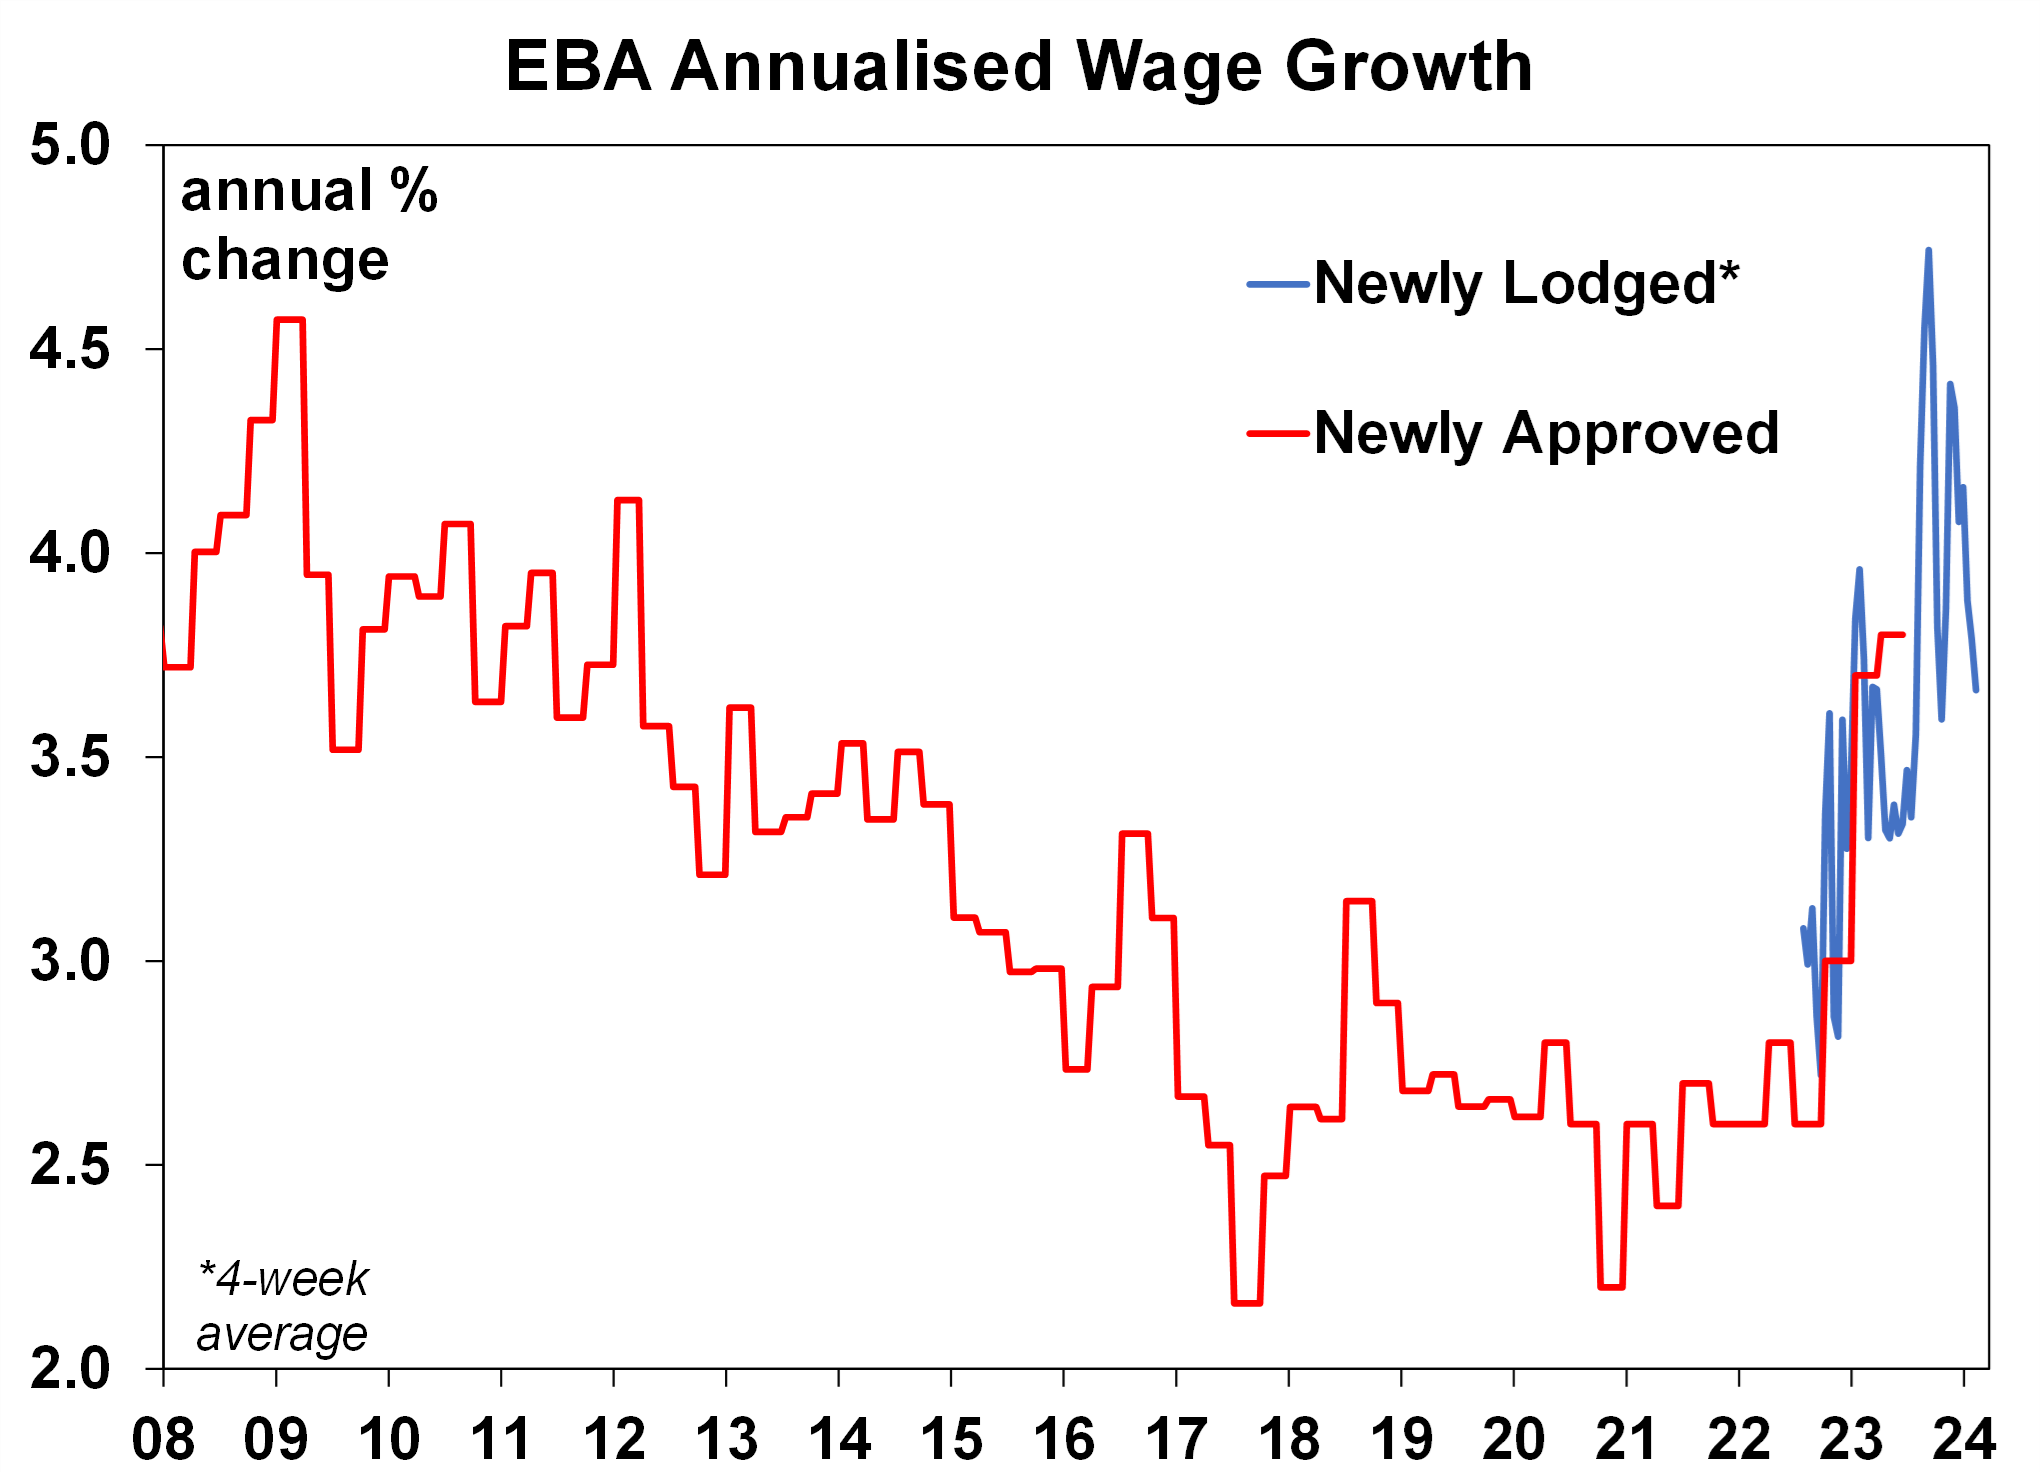
Wages growth will be influenced by labour market conditions and changes to the minimum wage agreement in June. Current wages are running at over 4% on an annual basis which threatens the RBA’s 2-3% inflation target but we think annual growth will slow to 3.4% by December. The increase in the unemployment rate (from 3.4% to 4.1%), rising underutilisation and slowing in labour market indicators (like job advertisements and hiring intentions) indicates a slowing in wages growth. We expect wages growth to be around 3.4% over the year to December. Newly approved EBA’s have also seen a decline in wages agreed (see the chart below). But, the Fair Work Commission will make their decision on minimum wages in June which could see renewed upward pressure on wages if a large increase to wages is awarded.
Source: Bloomberg, AMP
Implications for investors
In our view, services inflation in Australia will slow further in 2024 as population growth declines, consumer spending remains constrained and the labour market weakens which reduces wages growth. The RBA expect headline inflation to be 3.2% by Dec-2024 but we think it will be just under 3% for the headline and trimmed mean measures. The better outlook for inflation and weak growth fundamentals should allow the RBA to start cutting interest rates from around mid-year, although there is a high risk that rate cuts get delayed to August or September.

Weekly market update 26-07-2024
26 July 2024 | Blog Dr Shane Oliver discusses the risk off as tech hit continues; correction risks into August/September; global rate cutting cycle underway; Australian June quarter CPI to rise but the hurdle to another RBA rate hike should be high; and more. Read more
Oliver's insights - rise of populism and bigger government
24 July 2024 | Blog This article takes a look at the rise of populism and what it means for economic policies and investors. Read more
Weekly market update 19-07-2024
19 July 2024 | Blog This week shares are down; US election/Trump prospects starting to impact; global rates easing cycle on track; China Plenum; Australian jobs still tight but easing so RBA needs to be careful; and more. Read moreWhat you need to know
While every care has been taken in the preparation of this article, neither National Mutual Funds Management Ltd (ABN 32 006 787 720, AFSL 234652) (NMFM), AMP Limited ABN 49 079 354 519 nor any other member of the AMP Group (AMP) makes any representations or warranties as to the accuracy or completeness of any statement in it including, without limitation, any forecasts. Past performance is not a reliable indicator of future performance. This document has been prepared for the purpose of providing general information, without taking account of any particular investor’s objectives, financial situation or needs. An investor should, before making any investment decisions, consider the appropriateness of the information in this document, and seek professional advice, having regard to the investor’s objectives, financial situation and needs. This article is solely for the use of the party to whom it is provided and must not be provided to any other person or entity without the express written consent AMP. This article is not intended for distribution or use in any jurisdiction where it would be contrary to applicable laws, regulations or directives and does not constitute a recommendation, offer, solicitation or invitation to invest.
The information on this page was current on the date the page was published. For up-to-date information, we refer you to the relevant product disclosure statement, target market determination and product updates available at amp.com.au.

