


The US labour market – beyond the headlines
The outlook for services inflation is one of the key uncertainies facing central banks at the moment. In this edition of Econosights we look at US inflation as a guide for other major economies.
5 min read

Key points
US inflation has fallen from its 2022 highs thanks to a slowing in goods inflation. Further downside to goods prices is limited, so the next leg down for inflation hinges on a decline in services inflation.
Services inflation moves closely with wages growth. And wages growth is driven by conditions in the labour market.
Our leading indicator of US employment growth shows that employment growth is likely to slow from here and we expect the US unemployment to rise to 4.1% by September.
There is a risk that the US labour market stays tight as the growth backdrop has held up well and as businesses hoard workers. This would keep wages growth and services inflation too high, delaying the start of interest rate cuts and it would be negative for sharemarkets that are currently pricing in three rate cuts from the Fed by the end of the year.
Introduction
The outlook for services inflation is one of the key uncertainies facing central banks at the moment. In this edition of Econosights we look at US inflation as a guide for other major economies. US goods inflation is running at just 0.1% over the year to January, falling from its high of 14.2% annual growth in March 2022. But services inflation is still elevated, currently at 5% over the year to January. Trends in services inflation tend to follow goods inflation, but with a lag. Services inflation is also closely linked to wages growth (see the chart below) because labour costs are a major input into a businesses expenses and changes in household earnings drive consumer spending patterns and inflation as a result.
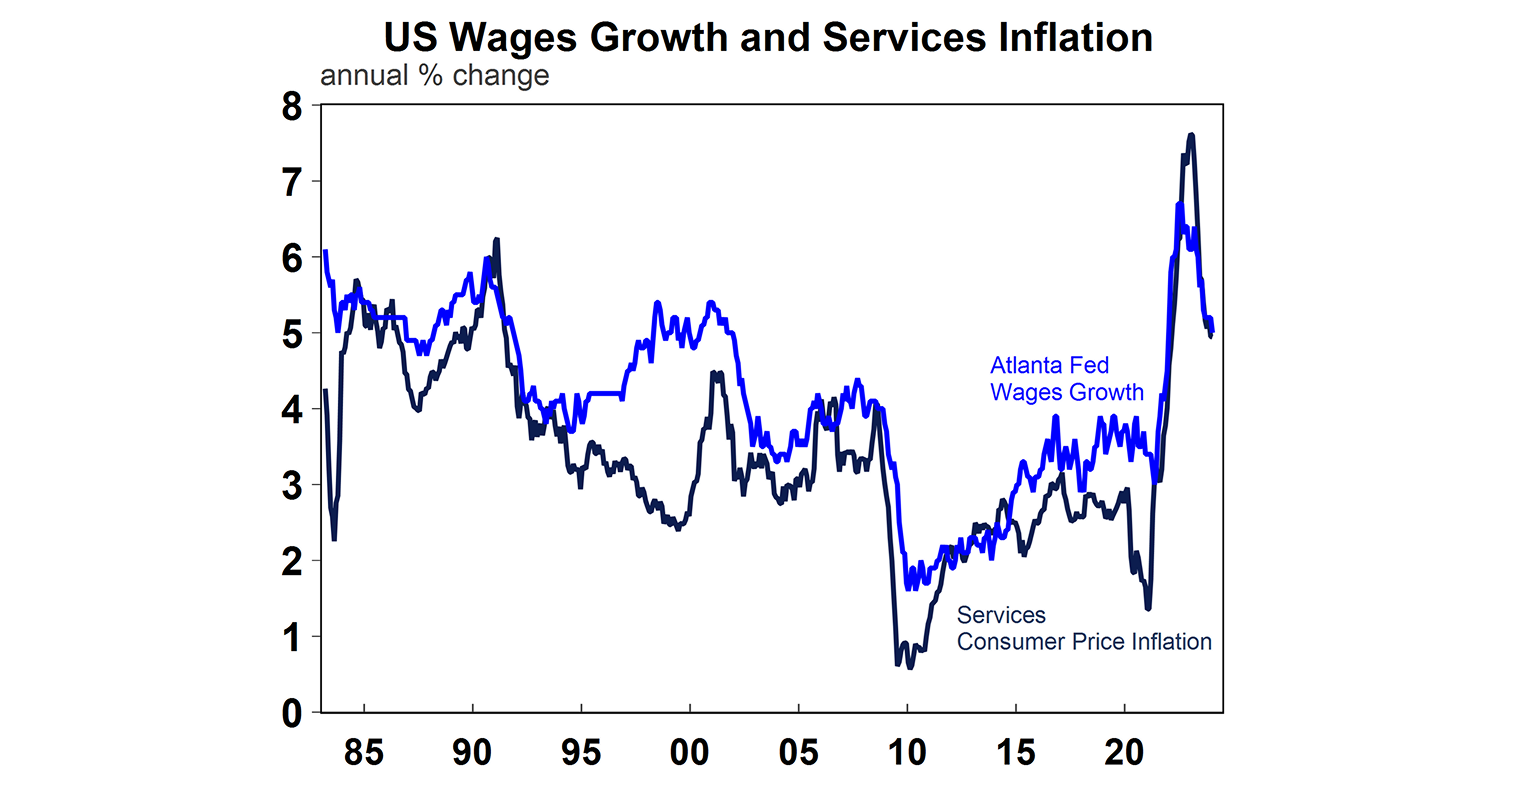
US wages (according to the Atlanta Fed measure) are running at 5% over the year to January, down from a high of 6.7% in mid-2022 but still higher than the long-run average of ~4% which is the level closer to the Federal Reserve’s 2% inflation target once you account for productivity growth. This indicates that wages growth needs to slow further, if the Fed is to meet its inflation goal.
The outlook for wages growth is based on conditions in the labour market. A tight labour market, characterised by strong employment, a low unemployment rate and high job openings, tends to lead to higher wages growth, and vice versa. Let’s look more closely at the conditions in the US labour market which serve as a guide to the outlook for wages and therefore inflation.
The leading indicators of jobs growth
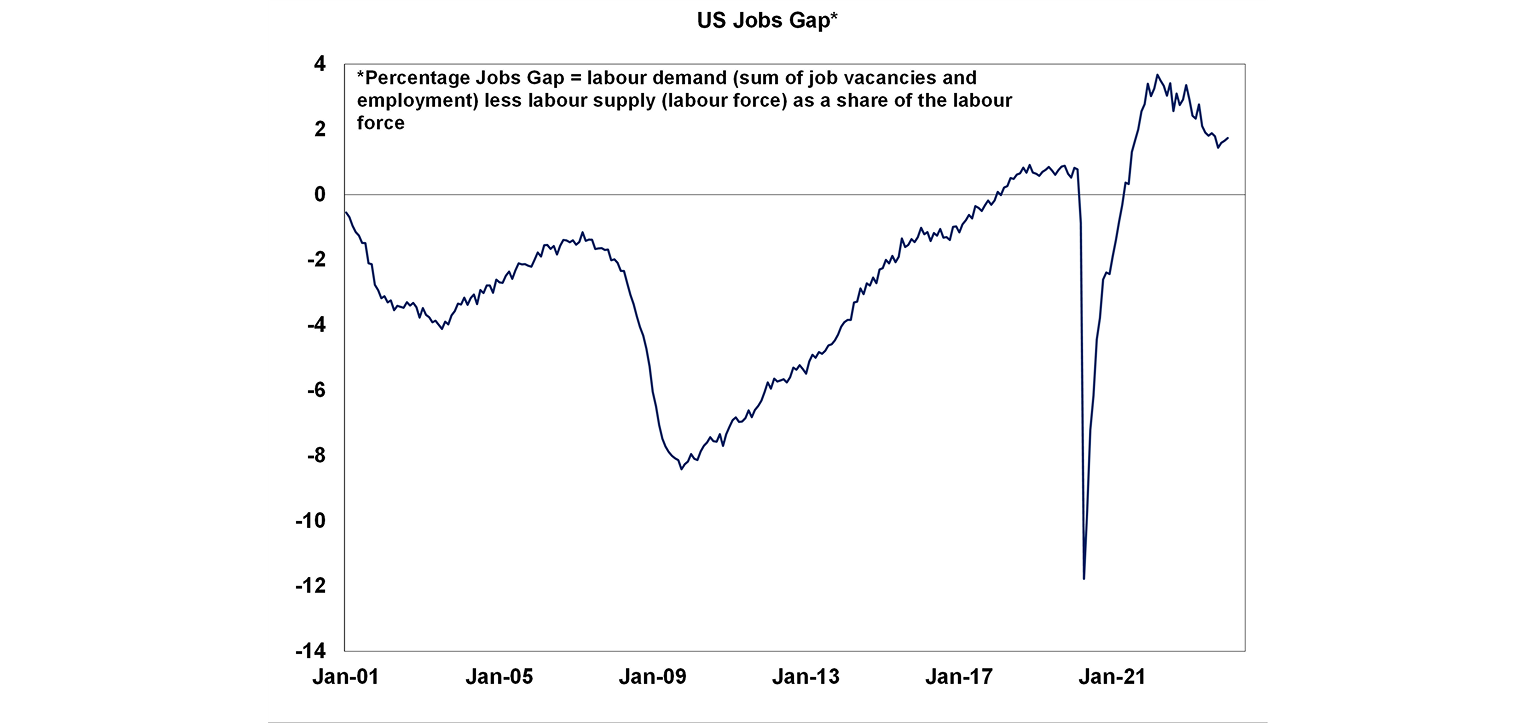
The current situation in the US labour market can be summed up in the chart below. Labour demand (which is the sum of job vacancies and employment) has been well above the supply of labour (measured by the labour force) since mid-2021, which is measured as a positive “jobs gap”. Since this particular data set started in 2001, the jobs gap has never been as positive as in this current cycle which explains why wages growth have increased significantly. The jobs gap is currently declining as job vacancies have fallen and employment growth has slowed, but is still positive and well above pre Covid levels.
The headline US jobs data shows that the unemployment rate has incresed from a low of 3.4% in January 2023 to its current level of 3.7%. While the unemployment rate is a very useful guide to the overall state of the labour market, it is really a lagging indicator of the labour market because the last thing that usually occurs in an economic downturn (or upturn) are the layoffs (or new hiring) of staff.
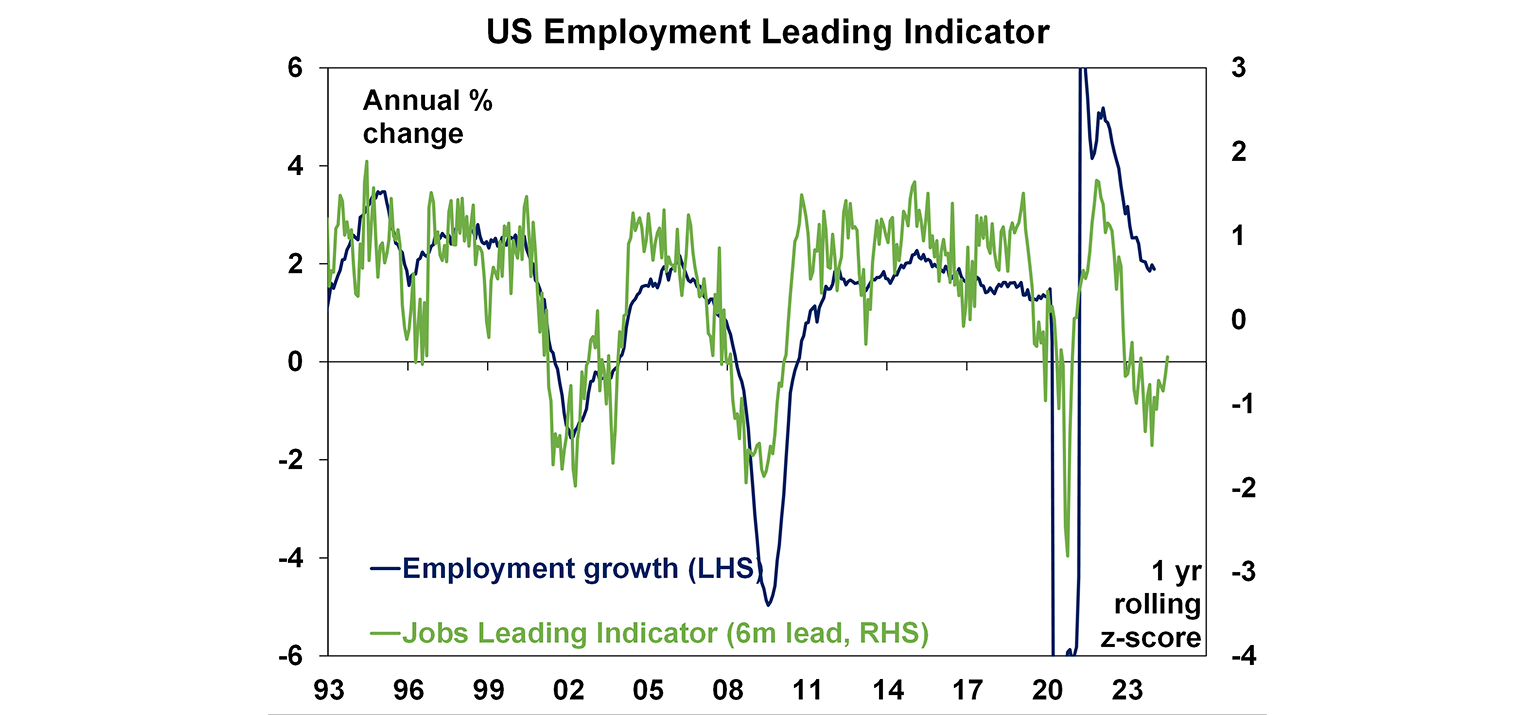
In our view it is better to look at leading indicators of employment growth. We have put together a leading indicator of employment growth using initial jobless claims, temporary services staff help, the NFIB index of businesses increasing emloyment, job openings, the Conference Board “jobs hard to get” index from its survey of consumers and the quits rate (which shows the number of workers quitting for new jobs as a percentage of employment) – see the chart below. This leading indicators shows that employment growth is expected to slow from here. We expect the unemployment rate to reach a peak of 4.1% by the September quarter.
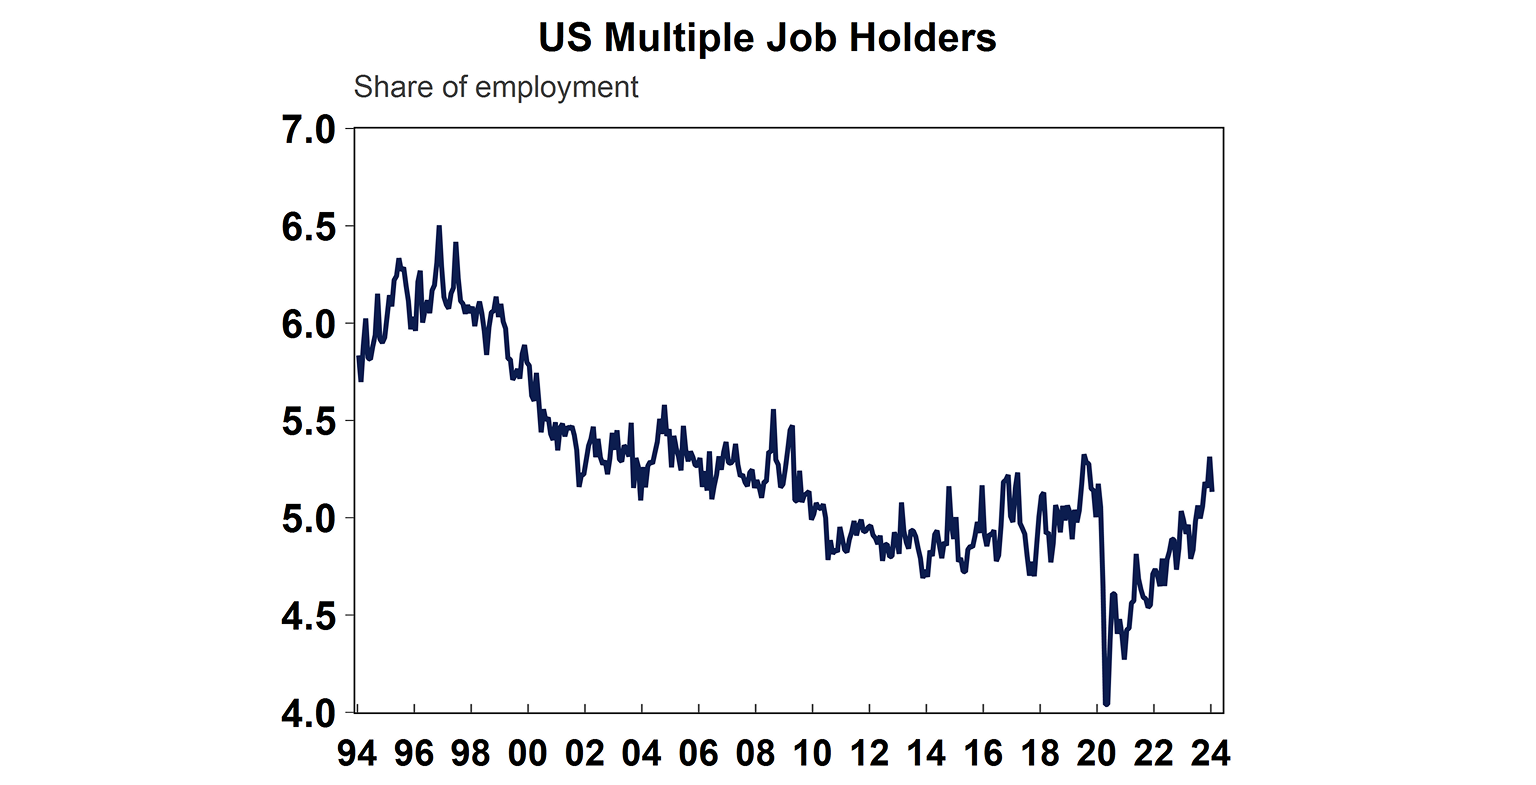
Beyond the leading indicators, there are some other other detailed labour market figures that reveal interesting conditions in the labour market. The share of workers holding multiple jobs has increased back to its pre-Covid level of 5% (see the chart below) which could be a sign that houeshold incomes are under pressure from interest rate hikes and elevated inflation, and also reflects strong labour market conditions which has encouraged more people into the labour market. But, the number of multiple job holders is still below its pre-2010 average of 5-6% which dispels the myth that the labour maket is becoming increasingly driven by gig-work and people being forced by economic conditions to take on more than one job.
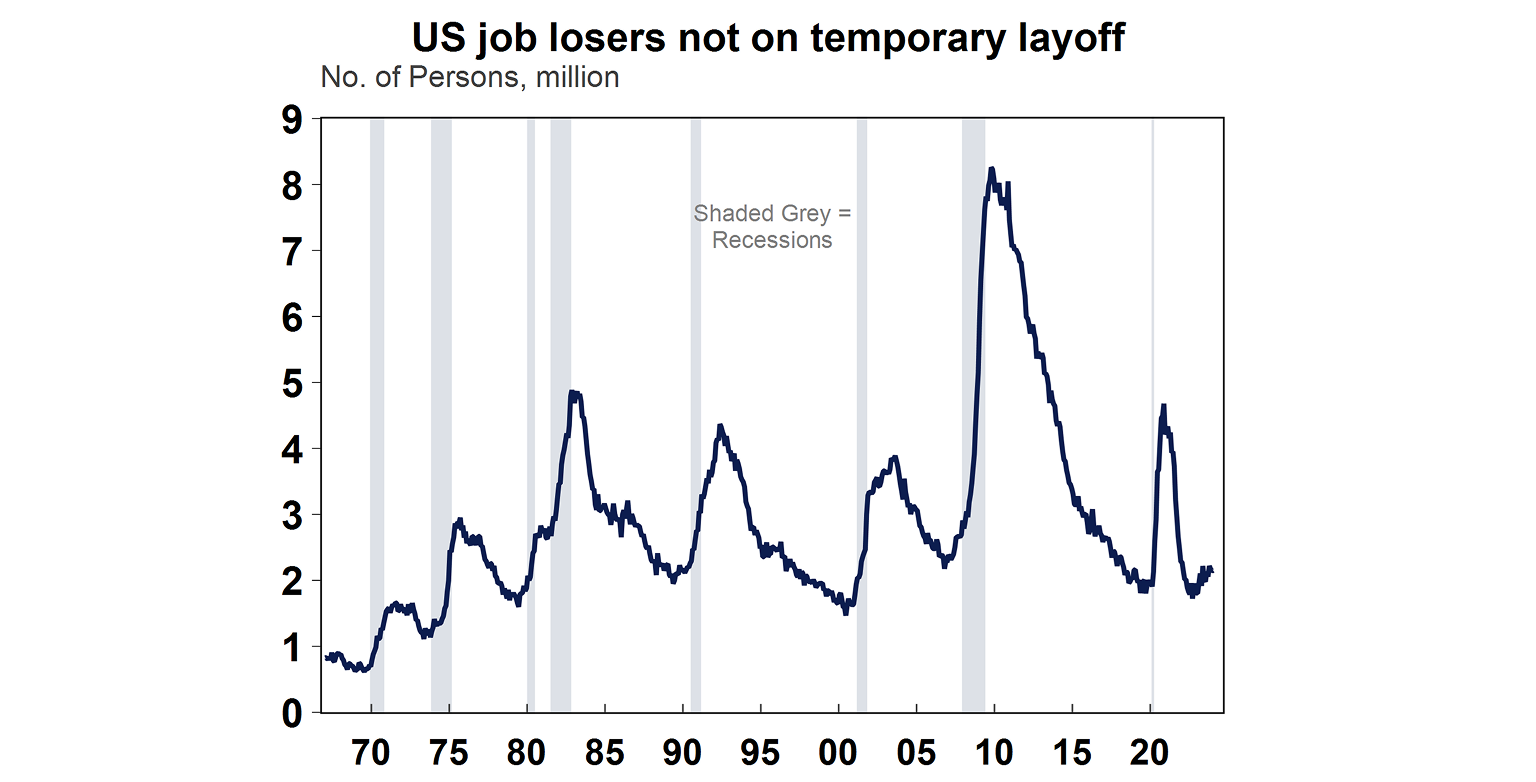
We have also been tracking the number of people who have lost their job but are not on temporary layoff (see the next chart). Those who have lost their job and are on temporary layoff are not usually a concern because this reflects the usual friction in the labour market as people move jobs. However, if the number of unemployed people who are on permanent layoff increases significantly this can be a sign that workers are having difficulty finding a new job once layed off and a signal that the unemployment rate is due to keep rising. As the next chart shows, history suggests that a sizeable rise in the number of people on permanent layoff increases, a recession usually follows.
How much does the unemployment rate go up in downturns?
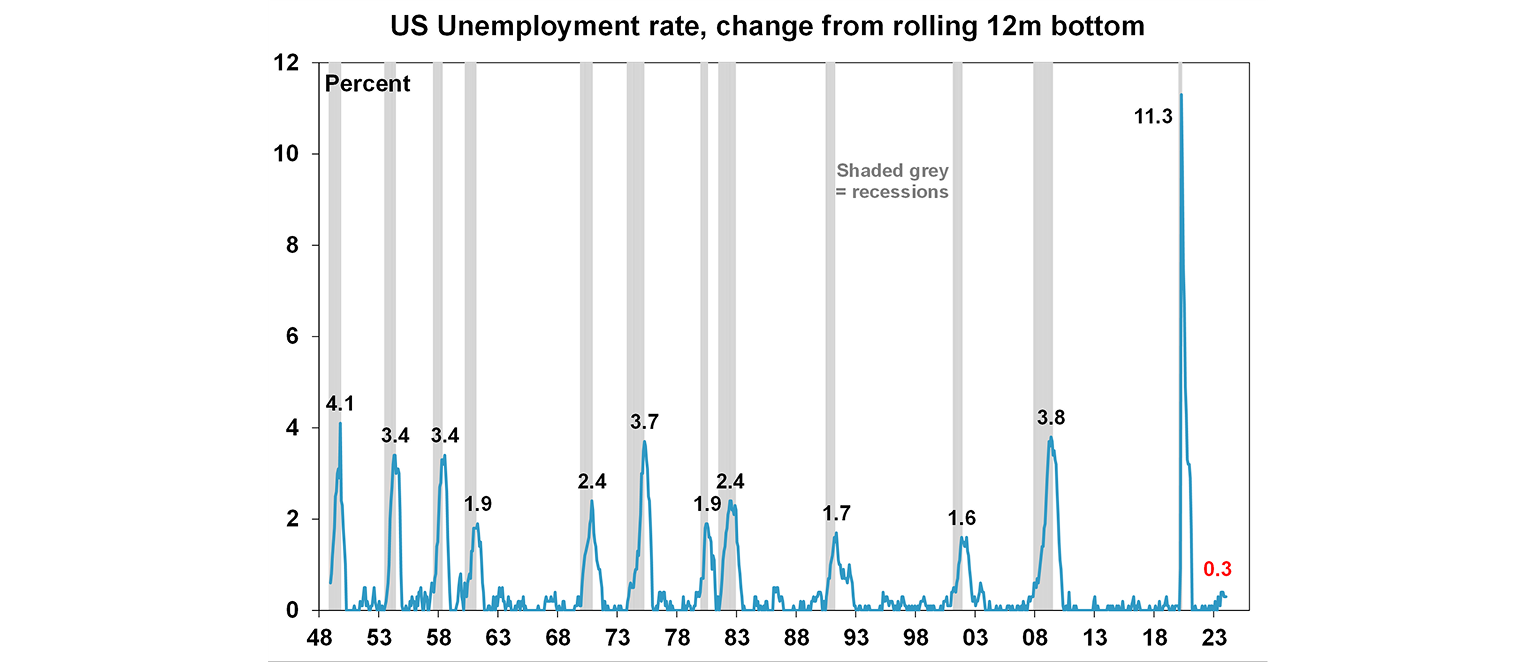
During recessions, the US unemployment rate tends to increase significantly. The chart below looks at the change in the unemployment rate from its bottom of the cycle. Since 1948, the average lift in the unemployment rate during a recession is 3.5 percentage points and the increase usually occurs over the space of a year. In the current cycle, the unemployment rate has risen by only 0.3 percentage point, from its low of 3.4% to its current level of 3.7%. There is a high chance (~40%) of a recession this year, but our base case is that a recession will be avoided. However, if the US does go into a recession, then the unemployment rate is likely to increase above 5%, based on trends in the unemployment rate throughout historical recessions. This would put significant downward pressure on consumer incomes and consumption and wages growth.
Implications for investors
The US labour market held up well over 2023 and the unemployment rate is still low at 3.7%, having increased just 0.3 percentage points from its low. However, the unemployment rate is a lagging indicator of the economy. The forward-looking indicators of employment conditions show that some deterioration in employment is likely over coming months which will lead to an increase in the unemployment rate. A deterioration in the labour market should result in a slowing in wages growth, helping to reduce services inflation and allowing the US Federal Reserve to start cutting interest rates around mid-year. But, there is a risk that the labour market stays tight as the growth backdrop hasn’t deteriorated significantly and as businesses hoard workers (fearing that if they lay them off they may not get them back when things pick up again) which would keep wages growth too high and delay the start of interest rate cuts. This would be negative for sharemarkets that are currently pricing in three rate cuts by the end of the year.
You may also like
-

Weekly market update - 24-07-2026 Renewed global worries weighed on the Australian share market which fell around 0.3%, but with its lower exposure to tech shares providing some protection. -

Oliver's insights Charts to watch 21 July 2026 Share markets had a strong first half despite the oil supply shock as expectations for de-escalation, okay economic data, strong profits and the AI boom provided an offset. -

Weekly market update - 17-07-2026 Following the renewed escalation in the US/Iran conflict, the Strait of Hormuz is effectively closed again with Iran attacking ships and the US attacking Iran and blockading its ports. Both are now back to attacking energy infrastructure which is a signficant & concerning escalation.
Important information
Any advice and information is provided by AWM Services Pty Ltd ABN 15 139 353 496, AFSL No. 366121 (AWM Services) and is general in nature. It hasn’t taken your financial or personal circumstances into account. Taxation issues are complex. You should seek professional advice before deciding to act on any information in this article.
It’s important to consider your particular circumstances and read the relevant Product Disclosure Statement, Target Market Determination or Terms and Conditions, available from AMP at amp.com.au, or by calling 131 267, before deciding what’s right for you. The super coaching session is a super health check and is provided by AWM Services and is general advice only. It does not consider your personal circumstances.
You can read our Financial Services Guide online for information about our services, including the fees and other benefits that AMP companies and their representatives may receive in relation to products and services provided to you. You can also ask us for a hardcopy. All information on this website is subject to change without notice. AWM Services is part of the AMP group.