Investment markets and key developments over the past week
Sharemarkets continued to rally this week across most countries with Australia up 1.6%, (all sectors rose except consumer staples, energy and materials), US +3.9% (with all sectors up except tech communications) thanks to solid earnings results, Japan +0.8%, Eurozone +3.9% but China was weaker with shares down 5.4% as investors took the National Party Congress as a negative sign for Chinese growth prospects both from an economic and political point of view. Global yields moved down on hope of a slowing in the pace global monetary tightening and as the new UK PM was confirmed as Rishi Sunak which calmed bond markets, with US 10-year yields around 4% after reaching 4.2% last week, UK 10-year yields were back to around 3.4% after being above 4% a week ago and Australian 10-year yields are at 3.7% from 4.2% late last week. The Australian dollar appreciated slightly this week, up to 0.64USD as the $US depreciated.
Equities have been rallying since their early to mid October lows because 1/ equities had already fallen so much since early 2022 with the US down 21% peak-to-trough, Eurozone 18% and Australia -15%, 2/ investor sentiment is extremely bearish which can be a sign of oversold conditions that are due for a bounce, 3/ we could be getting closer to a slowing in the pace of rate hikes (with the BoC surprising this week with a lower-than-expected hike), 4/ the appointment of ex Chancellor and fiscally conservative Rishi Sunak as the new Prime Minister which should allay fears of an inflation spiral driven by unfunded fiscal stimulus, 5/ US earnings growth holding up and 6/ we are coming into a good seasonal time for US shares (see the chart below) which could mean that a further short-term bounce in shares is possible.

However, the themes underpinning the macroenvironment are still negative so the risk for shares is still to the downside. Inflation is still too high in the developed world (and has been surprising again to the upside as seen this week in Australia) which means that interest rates will go higher in the short-term. High inflation and tightening monetary conditions mean that the risk of a growth downturn or recession is high in the next 12-18 months, with the regions at greatest risk of a growth contraction being in Eurozone/UK (as energy prices are crimping consumer and business spending) followed by the US (from an aggressive Federal Reserve). The risk of a serious growth downturn in Australia is around 40% in the next 12-18 months, but it is highly dependent on the terminal cash rate. The conclusion of Chinese National Party Congress also has worried investors due to increased downside risk to Chinese economic growth as there appear to be no plans to abandon the zero Covid policy and President Xi’s reshuffling of the Politburo Standing Committee (the top decision-making body of the Communist Party) away from economic prosperity and liberal reform towards more autocratic rule and self-reliance is negative for growth prospects. Lower Chinese GDP growth which will also weigh on other emerging market economies which rely on China.
Economic activity trackers
Our Economic Activity Indicator fell slightly in Australia (from lower hotel bookings, retail traffic and consumer confidence). The European economic activity indicator improved from higher restaurant bookings and household sentiment while the US indicator was unchanged. The European indicator looks to be overestimating economic activity, as we expect GDP growth to be negative for the Eurozone in the September and December quarters (which would mean a technical recession). The Australian and US indicator is in line with moderate, but positive growth.
Major global economic events and implications
Global PMI’s for October slid further into contraction (below an index level of 50) showing a deterioration in global growth conditions and a sign that interest rate hikes are working to slow spending. Across the components, input and output prices are declining (which is good news for inflation), delivery times are improving but backlogs of work have fallen and so have inventories. Manufacturing conditions are in contractionary territory (see the chart below) with the US PMI down to 49.9 in October from 52.0 last month, Eurozone down to 46.6 from 48.4 and the Australian PMI down to 52.8 from 53.5.

Services PMI’s are also in contraction with the US down to 46.6 in October from 49.3 last month, Eurozone down to 48.2 from 48.8 and Australia down to 49 from 50.6. The weakness in the PMI’s confirms that global growth will be weak in 2023 (we expect a below-trend outcome of 2.3% year on year)

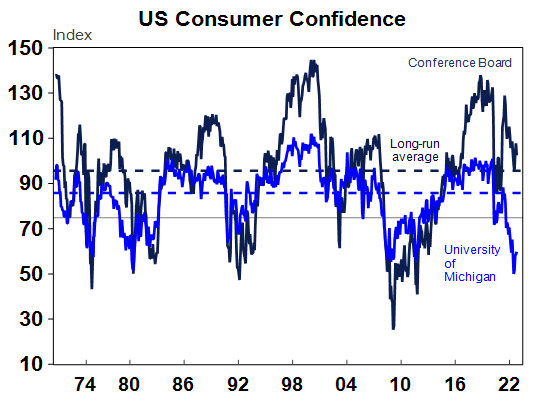
US data was very mixed. The personal consumption expenditure deflator was up by 6.2% on a year ago to September and the employment cost index rose by 1.2% in the September quarter, as expected. The Chicago Fed manufacturing index rose in October while the Richmond Fed and Kansas City Fed manufacturing index was negative, home prices fell again in August, pending home sales were much weaker than forecast in September but new home sales were stronger, durable goods orders rose marginally in September, initial jobless claims remain low which indicates a tight labour market, the trade balance widened in September, personal income and spending was holding up well in September, the final University of Michigan consumer sentiment index was revised up for October but the Conference Board consumer confidence fell (see chart below).
Preliminary September quarter US GDP rose by 0.6% over the quarter or 2.6% at an annualised rate after negative growth in the first half of 2022 (see the chart below).

Nearly 53% of US listed companies have reported September quarter earnings and so far the results have been positive. Around 71% of company results have surprised to the upside (slightly under the historical average of 76%). Annual earnings growth is running at 3.3% year on year, slightly up from the 2.4% expected at the beginning of the earnings season. Strong energy earnings are flattering the result with ex-energy earnings expected to be 3.8% year on year. The earnings estimates are (so far) not in line with a recessionary-like environment.

Chinese GDP in the September quarter rose by 3.9%, taking annual growth also to 3.9% which was above market forecasts. September activity data was mixed with industrial production lifting to 6.3% year on year (above consensus) but retail sales disappointed, up by 2.5% over the year (a sign that zero covid policy is still weighing on consumer spending), fixed asset investment rose by 5.9% over the year with property investment falling more than expected and trade data showed strong export growth and some improvement in import growth.

There were a few central banks meetings this week. The Bank of Canada followed the RBA and surprised markets with a smaller rate hike, opting to lift interest rates by 0.50%, rather than consensus estimates of 0.75%, taking the overnight lending rate to 3.75%. While the BoC indicated that rates “will need to rise further”, the slower pace of rate hikes was in response to “tighter monetary policies around the world” which are “weighing on economic activity”.
The European Central Bank hiked interest rates by 0.75%, as expected, taking the main refinancing rate to 2%. The ECB has hiked by 200 basis points in 4 months now and the pace of hikes is likely to slow from here. This was indicated in the post-meeting statement, with comments that “substantial progress” had already been made in the withdrawal of monetary policy accommodation. Other Eurozone data included the German IFO business survey for October was a little better than expected, although it is still very low compared to historical averages. Sentiment measures including economic confidence deteriorated further in October (but were in line with expectations).
In Japan, the Bank of Japan kept the policy rate unchanged at -0.1%, as expected. The unemployment rate remained very low in September at 2.6% (although a slight tick up from last months 2.5%). Tokyo consumer prices rose to 3.5% over the year, slightly above expectations of 3.3%.
Australian economic events and implications
The October 2022/23 Federal Budget was released this week and our full budget summary is available here. There were major new policy announcements for this year (with the government’s major policies of childcare and paid parental leave starting mid-2024) so there are little implications for near-term GDP growth and inflation. The government will need to address the longer-term pressures on the budget, with ballooning of spending for the National Disability Insurance Scheme (NDIS), increase in debt spending and higher aged care spending (the chart below shows the growth in the NDIS and interest cost over the out-years) which are expected to keep the budget deficit higher than previously forecast in the forward years. This means that budget repair is likely eventually, unless the economy surprises to the upside, allowing revenue growth to be higher than forecast.

The September quarter inflation data surprised to the upside. Headline inflation is running at 7.3%, the highest rate of inflation in 32 years. The concern was around the 1.8% rise in the trimmed mean consumer price index (a measure of underlying inflation), compared to expectations of a 1.5% lift which means that the initial surge in goods inflation is seeping into core and services inflation more than expected. This increases the risk that inflation will be higher for longer than longer, despite expectations that in the near-term, goods prices inflation will slow. The breadth of price rises above 3% per annum in Australia has risen again, with 76% of CPI baskets running above 3%, below the US at 91%, but a steep increase compared to history (see the chart below). High inflation will keep the RBA on a tightening path in the near-term.

Christopher Kent (Assistant Governor of Financial Markets) gave a speech on “Exchange Rate and Inflationary Pressures” which gave some history around the history of changes in the Australian dollar and that the depreciation in the $A has much larger against the $US (-11%) compared to the Trade Weighted Index or TWI (which has seen a 2.5% appreciation in the $A) since the beginning of the year. Imported inflation is more correlated to changes in the TWI so the impact on inflation from currency changes should be small.
Other Australian data was the weekly ANZ/Roy Morgan consumer confidence which fell again over the week to 23 October, Australian export prices fell by 3.6% in the September quarter while import prices rose by 3% which means that the terms-of-trade declined which will weigh on nominal GDP growth and producer prices for the September quarter rose by 1.9% and are 6.4% higher on a year ago.
What to watch over the next week?
In the US next week there are more updates from US companies, with earnings season in its busiest week. the Dallas Fed manufacturing index for October, September job openings (likely to show another decline), September construction data, October manufacturing and services ISM index (expected to decline from last month), September factory orders, October non-farm payrolls and the unemployment rate (payroll growth expected to soften to ~200K with the unemployment rate lifting to 3.6%) and most importantly, the FOMC meeting. Expectations are for another 0.75% lift from the US Fed, taking interest rates to 3.75-4%. This is most likely the last supersized Fed interest rate hike before a slowing in the pace of rate hikes from December. The Fed has already raised rates significantly since March with some FOMC members (like Fed Vice Chair Brainard) becoming more cautious on aggressive rate rises given the downside risks to the economy and signs that rate hikes are slowing demand. A slowing in the pace of rate hikes does not mean the end of the tightening cycle.
In China, the October PMI with the manufacturing index is likely to be just under 50 while services should be above 50. The October Caixin PMI (small business) is also released.
In Japan, data includes the September industrial production (expected to decline), retail sales (likely to be mostly unchanged on a year ago) and housing starts.
In the Eurozone, October consumer price data is show an increase of 10% year on year, September quarter GDP is also released (the risk is of a negative print) and the September unemployment rate.
In Australia, it’s a busy week. Melbourne Institute release their October monthly inflation indicator, September credit data are expected to rise 0.7% in September, retail sales are expected to rise by a modest 0.3% in September and retail volume data is expected to rise by 0.4% in the September quarter which will make a small positive contribution to September quarter GDP, CoreLogic home price data should show a 1.2% fall in October, with Sydney down 1.2% (getting less bad) and Melbourne -0.8%. Housing lending data is also released (likely to show another fall around 2%) and building approvals (expected to fall 10% in September) along with the trade balance (expected to lift to $9bn in September). The RBA meets on Tuesday on Melbourne Cup day and releases its Statement on Monetary Policy next Friday (some small changes to forecasts are expected including a minor downgrade to near-term GDP growth, revise up the unemployment rate and upgrade medium-term underlying inflation forecasts). We expect another 0.25% hike from the RBA next week, taking the cash rate to 2.85% which would be the 6th rate hike since May, with total hikes being 275 basis points. The acceleration in the September quarter trimmed mean inflation measure means that the RBA could opt to hike the cash rate by 50 basis points on concern that inflation is not coming down quickly enough. However, we think 0.25 is more likely because: 1/ RBA concern that a 0.25% rather than a 0.5% would lead to an “unhelpful reaction in inflation expectations and financial markets” has not occurred after the October meeting as markets are still pricing in a high cash rate peak of 4%, 2/drawing out rate hikes over several meetings rather than doing oversized rate hikes would help to keep public attention focussed for longer on the RBA’s resolve to get inflation back to target and 3/ the RBA doesn’t need to be as aggressive in its rate hikes because it meets more frequently than the other global central banks. But, clearly its going to be a close call. RBA governor Phil Lowe will also speak at a Board dinner with the business community in Hobart (no topic announced).
Outlook for markets
Shares remain at high risk of further falls in the short term as central banks continue to tighten, uncertainty about recession remains high and geopolitical risks continue. However, we see shares providing reasonable returns on a 12-month horizon as valuations have improved, global growth ultimately picks up again and inflationary pressures ease through next year allowing central banks to ease up on the monetary brakes.
With bond yields likely at or close to peaking for now, short-term bond returns should improve.
Unlisted commercial property may see some weakness in retail & office returns & the lagged impact of higher bond yields is likely to drag down unlisted property and infrastructure returns.
Australian home prices are expected to fall 15 to 20% top to bottom into the September quarter next year as poor affordability & rising mortgage rates impact. This assumes the cash rate tops out around 3% but if it rises to 4% or more as the money market is 3assuming then home prices will likely fall 30%.
Cash and bank deposit returns remain low but are improving as RBA cash rate increases flow through.
The $A remains at risk of further falls in the short term as global uncertainties persist and as the RBA remains a bit less hawkish than the Fed. However, a rising trend in the $A is likely over the medium term as commodity prices ultimately remain in a super cycle bull market.

Oliver's insights - ineffective investors
22 October 2024 | Blog In the confusing and often seemingly illogical world of investing, investors often make various mistakes that keep them from reaching their financial goals. This note takes a look at the nine most common mistakes. Read more
Econosights - global housing trends
22 October 2024 | Blog The common belief that Australian homes have become unaffordable is understandable, as all the metrics around affordability have deteriorated. But how does the housing situation in Australia compare to our global peers? We go through this issue in this edition of Econosights. Read more
Weekly market update 18-10-2024
18 October 2024 | Blog Down down for global inflation and rates; soft Chinese data but better than feared; strong Australian jobs and the RBA; US earnings results; time for another baby bonus?; and more. Read moreWhat you need to know
While every care has been taken in the preparation of this article, neither National Mutual Funds Management Ltd (ABN 32 006 787 720, AFSL 234652) (NMFM), AMP Limited ABN 49 079 354 519 nor any other member of the AMP Group (AMP) makes any representations or warranties as to the accuracy or completeness of any statement in it including, without limitation, any forecasts. Past performance is not a reliable indicator of future performance. This document has been prepared for the purpose of providing general information, without taking account of any particular investor’s objectives, financial situation or needs. An investor should, before making any investment decisions, consider the appropriateness of the information in this document, and seek professional advice, having regard to the investor’s objectives, financial situation and needs. This article is solely for the use of the party to whom it is provided and must not be provided to any other person or entity without the express written consent AMP. This article is not intended for distribution or use in any jurisdiction where it would be contrary to applicable laws, regulations or directives and does not constitute a recommendation, offer, solicitation or invitation to invest.
The information on this page was current on the date the page was published. For up-to-date information, we refer you to the relevant product disclosure statement, target market determination and product updates available at amp.com.au.