

Investment markets and key developments
US, European and Japanese shares rose to new record highs over the last week helped by solid economic data, further falls in inflation in various countries and further indications that major central banks are heading towards interest rate cuts this year. For the week US shares gained 2.3%, Eurozone shares rose 1.3% and Japanese shares rose 5.6%. Chinese shares fell 0.7% despite better-than-expected economic data. Australian shares rose 1.3% helped by the positive global lead and the RBA moving to a neutral bias on interest rates with gains led by resources (helped by higher iron ore prices), property, industrial and financials shares. Bond yields fell, oil prices were little changed, metal prices fell, and the iron ore price rose. The $A fell with the $US up.
After very strong gains leaving valuations stretched and investor sentiment high the risk of a share market correction remains high, but for now the drip feed of economic news consistent with a Goldilocks scenario of continuing growth, still low unemployment and falling inflation with central banks remaining on track for rate cuts this year is continuing to drive a rising trend in share markets.
The past week was a big one for central banks and, while the Taiwanese central bank provided a surprise interest rate hike (providing a reminder that nothing is guaranteed), the overall picture remains one of major central banks heading towards normalising interest rates, which for most means rate cuts:
- Of course, for the BoJ this means monetary tightening making it the odd one out, but it was a dovish hike. After eight years of negative interest rates with a deposit rate of -0.1% if finally raised it to a range of zero to 0.1%. This reflected confidence that it will finally sustain inflation around its 2% target. While such a move may create fears of a reversal of the “carry trade” with Japanese money being sucked back into Japan this seems unlikely: as the move was well anticipated; it was small; Japanese interest rates are still around zero and way below rates in other major countries; the Japanese economy is barely growing so a big tightening cycle is unlikely; and the BoJ indicated that monetary policy will remain easy for the time being – so it was a “dovish” tightening.
- The Fed left rates on hold as expected, and its message was upbeat, reaffirming its inclination to start cutting rates. It remains cautious and is still waiting for more confidence (a bit like the RBA), but despite two months of hotter inflation which it sees as bumps along the way to lower inflation it’s still flagging three rate cuts this year. While it revised down its flagged rate cuts for next year from four to three and revised up slightly its longer-term expectation for the Fed Funds rate (to 2.56%) this was matched by upwards revisions to its GDP growth forecasts which is now seen as being around 2% out to 2026 as inflation falls back to 2%. In other words, its expecting a very soft landing with a supply side surge and higher productivity allowing both lower inflation and stronger than previously expected growth. Against this Goldilocks backdrop the Fed looks on track to start cutting rates around June (going much later could be seen as political given the election). As can be seen in the next chart the Fed’s dot plot of officials’ interest rate expectations and market expectations for rates are in line for the next two years.
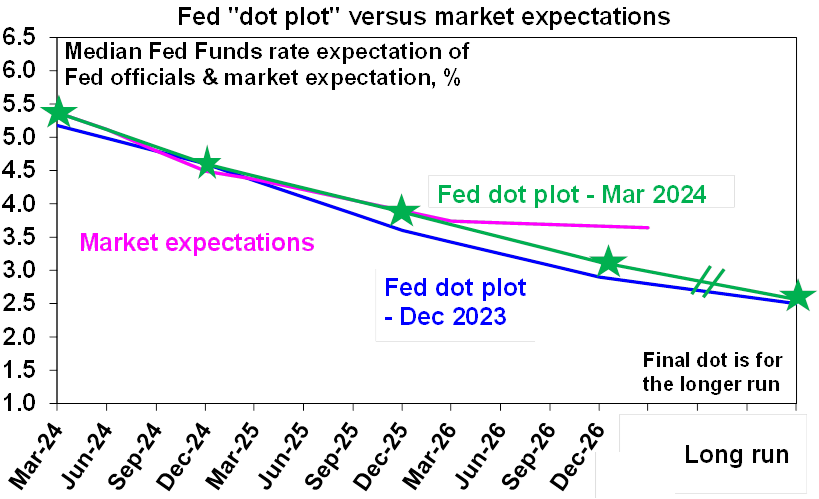
Source: US Federal Reserve, Bloomberg, AMP
- The Bank of England also left rates on hold at 5.25% as expected pointing to “inflation persistence” but it leaned more dovish with no more hawkish dissents on the Monetary Policy Committee and one member voting for a cut, more optimistic language around inflation, the labour market now being seen as relatively tight as opposed to tight and Governor Bailey saying “things are moving in the right direction” for a cut. The UK money market still sees the first cut coming in June.
- ECB President Lagarde indicated it remains on track to move into the “dial back phase”, ie, rate cuts but still needs more confidence before doing so. A June cut looks most likely.
- The Swiss National Bank surprised with a 0.25% rate cut taking its policy rate down to 1.5% citing lower inflation.
- The RBA left rates on hold but removed its tightening bias. While the Bank welcomed the moderation in inflation it remains cautious noting that inflation remains too high and waiting for more confidence that inflation is heading sustainably to target. The key though is that while it may not be confident enough yet Governor Bullock indicated that some data has made it “more confident” and in response it replaced a reference to the possibility of another hike with more neutral language that it “is not ruling anything in or out.” The progressive easing in its tightening bias to now a neutral bias adds to confidence that we are likely getting closer to rate cuts. That said we are not quite there yet and with the economy still growing (albeit only just) the RBA is not in a rush to cut. And don’t expect the RBA to necessarily tell us what it’s about to do ahead of doing so with Governor Bullock saying “I won’t be giving forward guidance.” Our assessment remains that the combination of weaker growth and a faster fall in inflation than the RBA currently expects will ultimately force its hand and we continue to see it cutting rates from mid-year with three 0.25% rate cuts by year end, taking the cash rate down to 3.6%. But the road to rate cuts will likely remain bumpy. Our base case is that the first cut will come in June. But with the economy still growing, very strong population growth still adding to demand, the RBA painting a relatively benign assessment of the financial position of households and businesses in its latest Financial Stability Review and the labour market still tight with some risk to wages growth flowing from another large pay rise for aged care workers there is a high risk that rate cuts will get delayed till August or September.
Meanwhile February inflation data for the UK and Canada came in lower than expected continuing the downtrend evident in major countries – including Australia – even though at times it’s been bumpy. It rose in Japan, but this was due to base effects as energy subsidies dropped out a year ago, but the rise was less than expected and core (ex food and energy) inflation fell to 2.5%yoy.
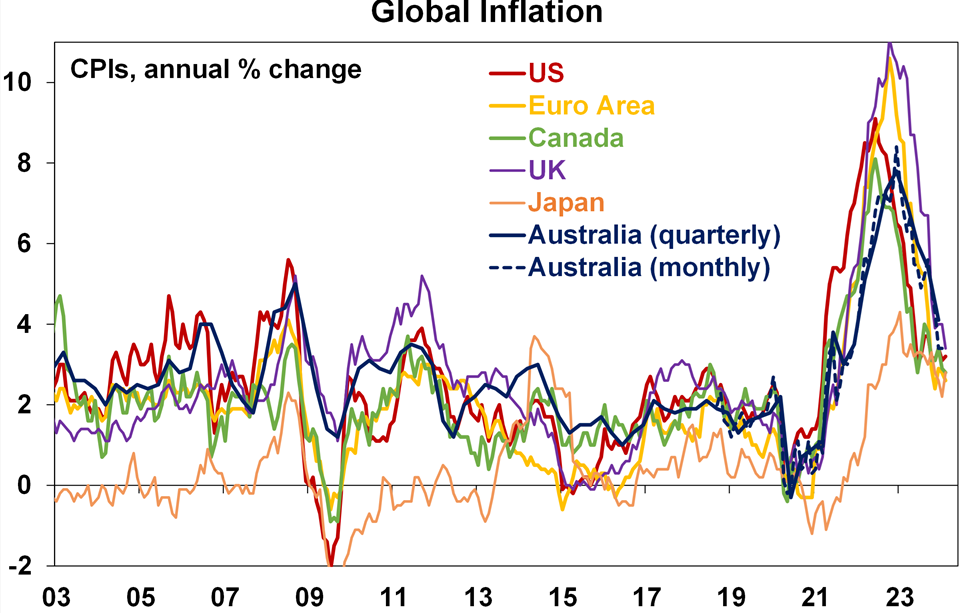
Source: Bloomberg, AMP
The RBA’s latest bi-annual Financial Stability Review paints a pretty benign picture, albeit with ongoing risks beneath the surface. It points to an improved global outlook and notes that: while many Australian households and businesses face challenging conditions most are able to service their debt and meet essential expenses; loan arrears are up but remain low; and the financial system remains resilient. The key risks its monitoring are the property slowdown in China, tough conditions in commercial property (although it points out Australian banks are less exposed than in the past) and tougher macro-economic conditions. In terms of how households are handling higher mortgage rates the RBA continues to estimate that around 5% of households with a variable rate mortgage have mortgage and essential living expenses greater than income (see the next chart which is from the FSR). Based on its forecasts contained in last month’s Statement on Monetary Policy (which allowed for rising real wages, a falling cash rate and higher unemployment) the RBA estimates that this would remain the case for a while yet before starting to fall later this year (blue dots). Even in a higher inflation for longer scenario with the cash rate 0.5% higher than assumed in February the RBA estimates that the proportion of cash flow negative household will only rise just above 6% before falling next year (red dots).
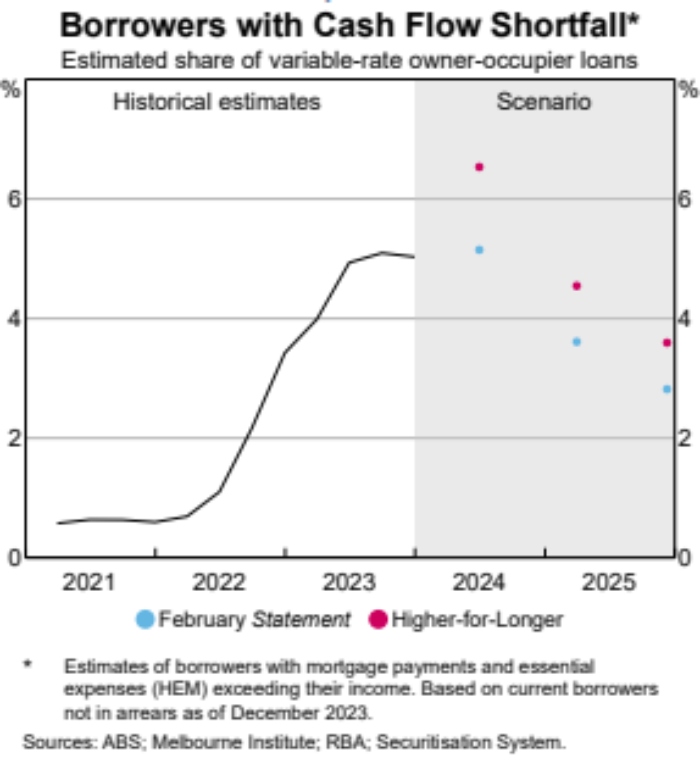
Its worth noting though that the essential expenses that the RBA refers to are narrowly defined, excluding for example private health insurance and school fees. Allowing for these as they did in the October FSR last year (but not in their latest report) indicated that the proportion of cash flow negative households on variable rates would rise to 13% and to 18% for those on fixed rates. This is a much larger proportion of households and would imply something like 450,000 households. What’s more its worth stressing that this group of households is getting by in the meantime by cutting discretionary spending, buying lower quality goods and services, running down their assets and working more hours. There is obviously a limit to how much discretionary spending can be cut or other assets can be run down and the longer this continues the greater the drag will be on the economy resulting in a worsening labour market which in turn will make it harder to work more hours. So maybe things aren’t quite as benign as the RBA portrays under each of its scenarios.
Environmental songs. Protest songs about environmental degradation were common in the 1960s. One that stood out for me was Tar and Cement by Verdelle Smith (which was actually a cover of an Italian song) – but when I first heard it I thought it was a bit exaggerated (maybe because I lived in Australia where there was lots of green natural space...but then as some of that that space gets filled in and it seems human progress seems synonymous with tar and cement I increasingly relate to it. Twenty five years later Julian Lennon (John Lennon’s son and the inspiration for Hey Jude) came up with Saltwater which is one of my favourites.
Major global economic events and implications
March business conditions PMIs (which are global surveys of businesses) were mixed across major countries – up in Europe (but still soft), Japan and Australia but down in the US and UK (but to still okay levels for both). Across the G3 as a whole they rose slightly and are at levels consistent with soft growth. G3 input and output prices rose slightly (mainly driven by the US) but both remain well down from their highs with order backlogs continuing to fall and delivery times improving (despite Red Sed & Panama shipping issues).
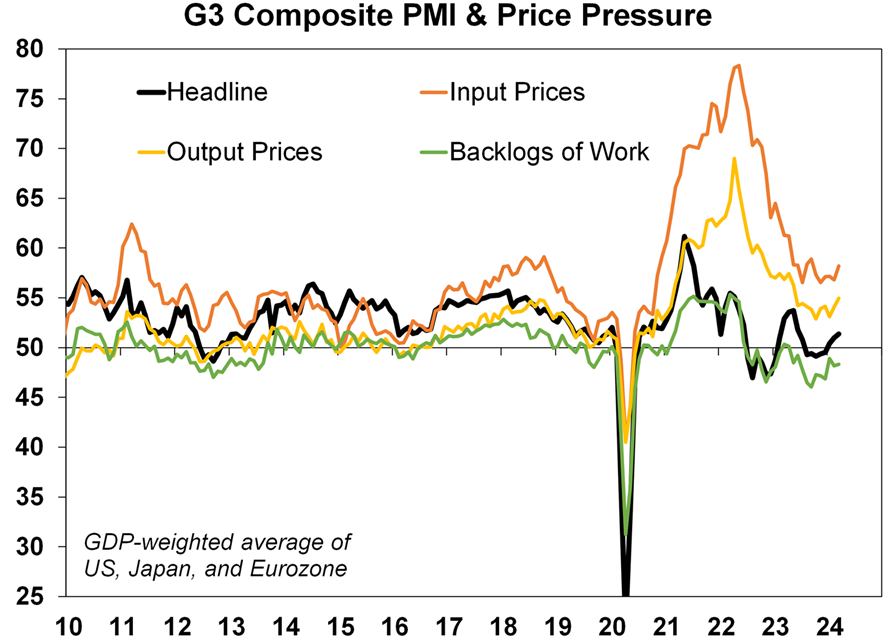
Source: Bloomberg, AMP
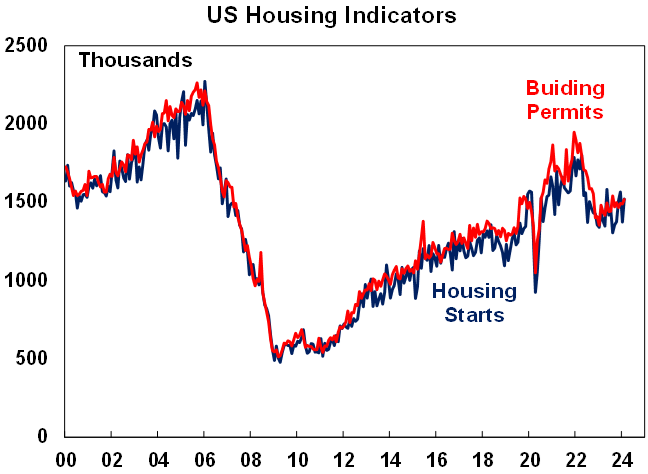
Apart from the continuing strength in the US PMI, other US economic data was mostly solid. Manufacturing conditions in the Philadelphia region softened but by less than expected, the Conference Board’s February leading index fell rose for the first time in two years, jobless claims remain low, home builder conditions improved in March, housing starts rose strongly in February and existing home sales rose 9.5%.
Source: Bloomberg, AMP
The NZ economy slipped back into recession in the December quarter, with another consecutive quarter of decline. While the recession is mild it supports the likelihood of rate cuts by August.
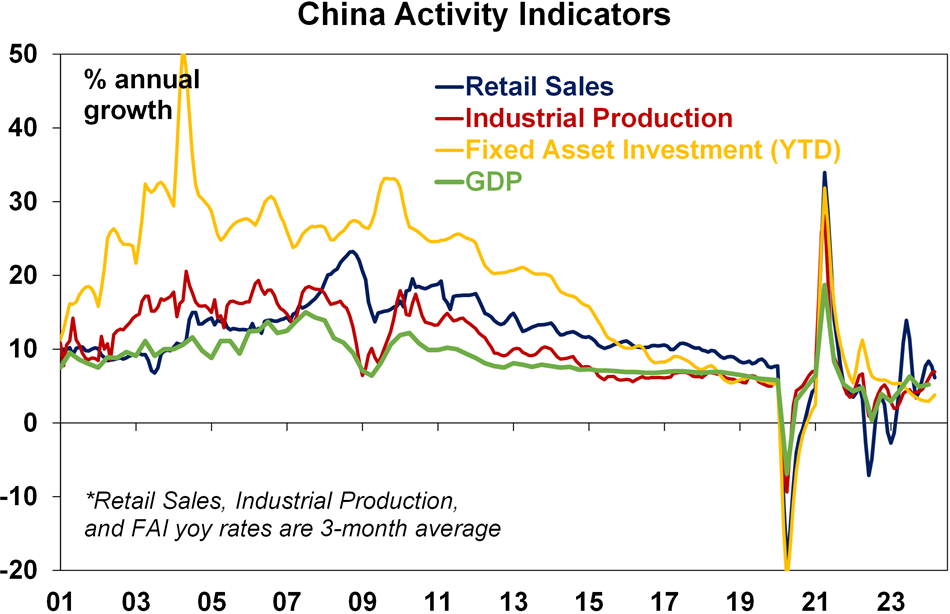
Chinese growth not as bad as feared. While January/February data showed continued property sector weakness, a slight rise in unemployment and a slowing in retail sales growth the latter was roughly in line with expectations and industrial production and investment actually came in stronger than expected and accelerated compared to late last year. This should help alleviate some of the excessive pessimism about the Chinese economy.
Source: Bloomberg, AMP
Australian economic events and implications
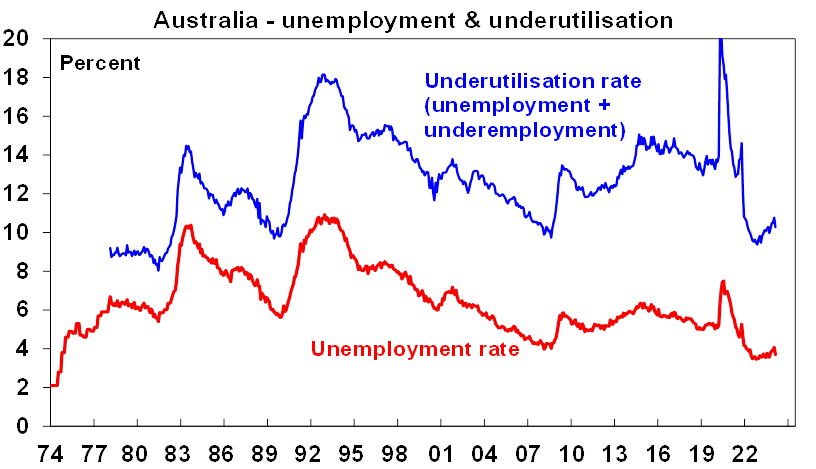
Another confusing Australian jobs report with jobs surging and unemployment back down – but is it believable? The ABS puts the volatility down to changed seasonal patterns around December/January with more than normal people in between jobs who then went back into employment in February. This boosted both employment and hours worked and cut unemployment to 3.7% (only just above its near 50 year low of 3.5% seen in 2022-23). However, the significant volatility questions the reliability of the jobs data and cautions reading too much into it. Unemployment is probably not as high as January’s 4.1% but probably not as low as February’s 3.7%. The trend is still up and this is particularly evident in labour underutilisation which has moved up from a low of 9.4% to now 10.3% and is a better guide to the labour market.
Source: ABS, AMP
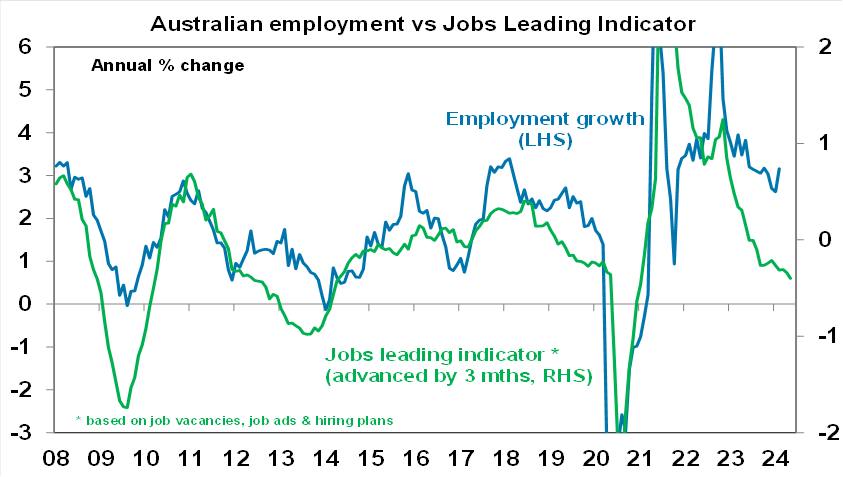
Furthermore, our Jobs Leading Indicator continues to point to slower jobs growth ahead on the back of falling vacancies and hiring plans. Given the volatility in the jobs data the RBA will likely be cautious in reading too much into it, so we don’t see it as prompting them to reinstate their tightening bias. Hopefully the March jobs data which will be available by the next RBA meeting in May will provide a clearer picture.
Source: ABS, AMP
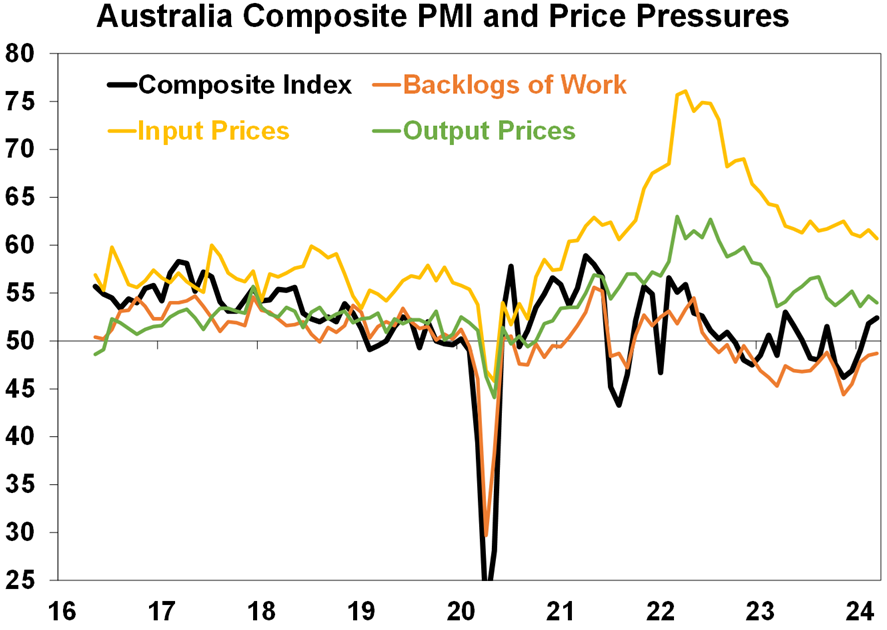
Australian business conditions PMIs for March rose with strength in services offsetting weakness in manufacturing. Interestingly both new orders and employment fell slightly. The good news on inflation though is that input and output prices edged down, but both are still a bit elevated mainly due to services.
Source: Bloomberg, AMP
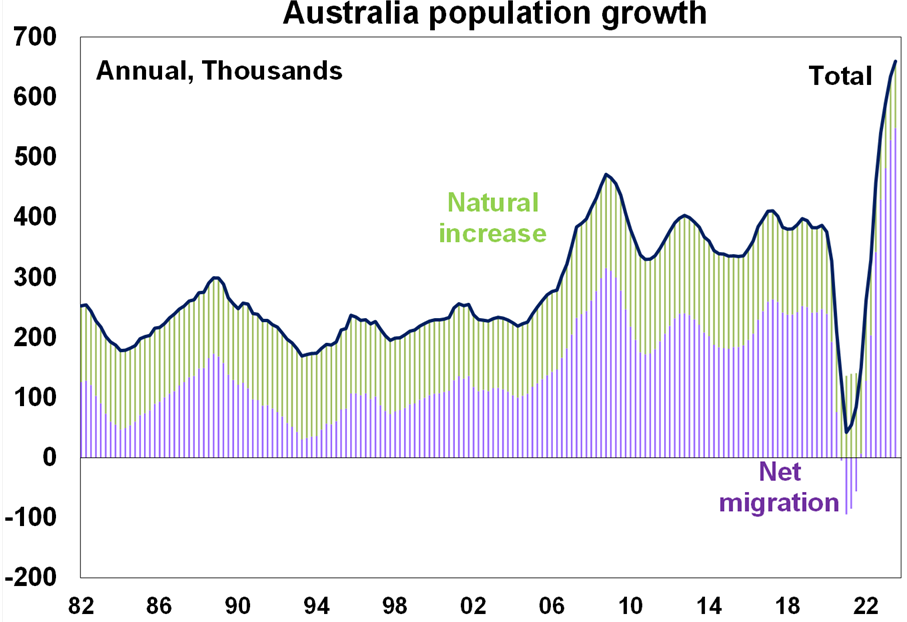
Strongest population growth since the 1950s continues. Australia’s population rose by a record 659,800 people over the year to the September quarter, or by 2.5%yoy its fastest pace since the 1950s. Again, the surge was driven by immigration (at 548,800 people) with natural growth remaining subdued (at 111,000 people). The surge in immigration has likely been a big factor in keeping the economy growing in the face of rate hikes and cost of living pressures and its helped ease labour shortages but it’s done nothing to boost per capita GDP (which is in recession) and has added to demand and hence inflation and so likely led to higher than otherwise interest rates. The strains are most evident in the housing shortfall and hence surging rents and record home prices.
Source: ABS, AMP
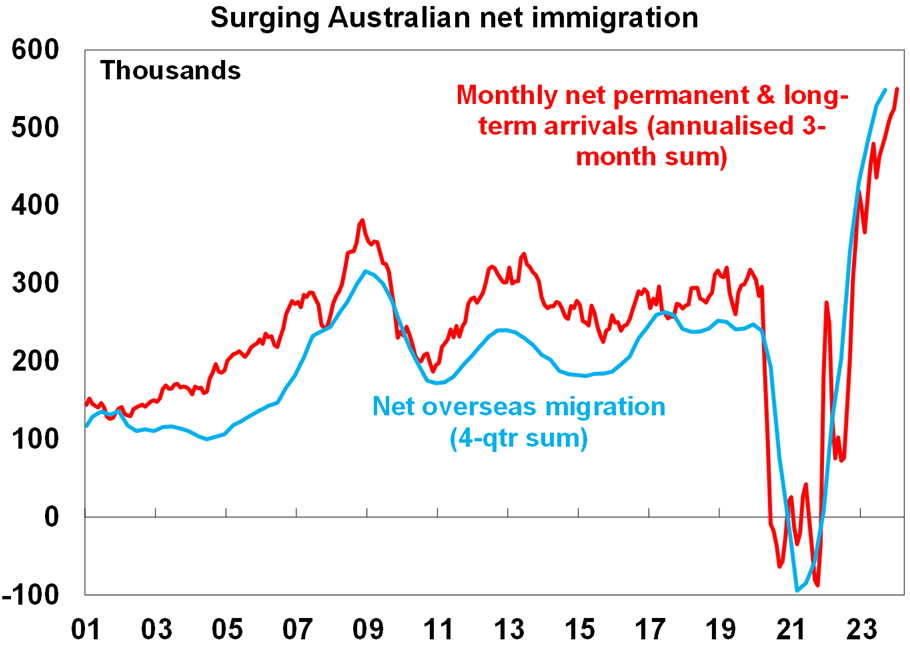
We may be near peak immigration, but the housing shortfall will still worsen. Monthly arrivals data up to January suggest that net migration remains around record levels. While it should slow going forward as the reopening spike in student arrivals peaks amidst tougher visa requirements, the Government’s forecast for net migration of 375,000 this financial year looks likely to be significantly exceeded, as we have already likely seen around 285,000 immigrants in the first six months alone. Meanwhile, current immigration levels imply underlying housing demand running around 220,000 dwellings or more a year and so with completions running around 170,000 a year we are continuing to add to the housing shortfall.
Source: ABS, AMP
What to watch over the next week?
In the US, the focus will be on February core PCE inflation data due Friday which is expected to show a 0.3%mom rise leaving annual core inflation at 2.8%yoy. In other data expect February data to show a modest gain in underlying durable goods orders (Tuesday) and a 0.4%mom rise in personal spending (Friday). Home price data is likely to show modest growth with consumer confidence likely to have increased slightly (both Tuesday).
Japanese data for industrial production, retail sales and jobs will be released Friday.
In Australia it will be back to focussing on inflation again with monthly inflation for February (Wednesday) likely to show a spike to 3.7%yoy from 3.4% in January due to higher fuel, education and housing prices driving a 0.5%mom increase and base effects as a 0.2%mom rise will drop out a year ago. This should be seen as normal volatility though, with the downtrend likely to remain in place, a bit like we saw in August and September last year. In terms of other data expect a 0.5% rise in retail sales for February (helped by a temporary Tay Tay boost) after a 1.1% rise in January, a seventh quarterly fall in a row in job vacancies for February and continued moderate credit growth (all due Thursday).
Outlook for investment markets
Easing inflation pressures, central banks moving to cut rates and prospects for stronger growth in 2025 should make for good investment returns this year. However, with a high risk of recession and investors and share market valuations no longer positioned for recession and geopolitical risks, it’s likely to be a rougher and more constrained ride than in 2023.
We expect the ASX 200 to return 9% this year and rise to around 7900. A recession is probably the main threat.
Bonds are likely to provide returns around running yield or a bit more, as inflation slows, and central banks cut rates.
Unlisted commercial property returns are likely to be negative again due to the lagged impact of high bond yields & working from home.
Australian home prices are likely to see more constrained gains compared to 2023 as still high interest rates constrain demand and unemployment rises. The supply shortfall should provide support though and rate cuts from mid-year should help boost price growth later in the year.
Cash and bank deposits are expected to provide returns of over 4%, reflecting the back up in interest rates.
A rising trend in the $A is likely taking it to $US0.72, due to a fall in the overvalued $US & the Fed cutting rates by more than the RBA.

Oliver's insights - ineffective investors
22 October 2024 | Blog In the confusing and often seemingly illogical world of investing, investors often make various mistakes that keep them from reaching their financial goals. This note takes a look at the nine most common mistakes. Read more
Econosights - global housing trends
22 October 2024 | Blog The common belief that Australian homes have become unaffordable is understandable, as all the metrics around affordability have deteriorated. But how does the housing situation in Australia compare to our global peers? We go through this issue in this edition of Econosights. Read more
Weekly market update 18-10-2024
18 October 2024 | Blog Down down for global inflation and rates; soft Chinese data but better than feared; strong Australian jobs and the RBA; US earnings results; time for another baby bonus?; and more. Read moreWhat you need to know
While every care has been taken in the preparation of this article, neither National Mutual Funds Management Ltd (ABN 32 006 787 720, AFSL 234652) (NMFM), AMP Limited ABN 49 079 354 519 nor any other member of the AMP Group (AMP) makes any representations or warranties as to the accuracy or completeness of any statement in it including, without limitation, any forecasts. Past performance is not a reliable indicator of future performance. This document has been prepared for the purpose of providing general information, without taking account of any particular investor’s objectives, financial situation or needs. An investor should, before making any investment decisions, consider the appropriateness of the information in this document, and seek professional advice, having regard to the investor’s objectives, financial situation and needs. This article is solely for the use of the party to whom it is provided and must not be provided to any other person or entity without the express written consent AMP. This article is not intended for distribution or use in any jurisdiction where it would be contrary to applicable laws, regulations or directives and does not constitute a recommendation, offer, solicitation or invitation to invest.
The information on this page was current on the date the page was published. For up-to-date information, we refer you to the relevant product disclosure statement, target market determination and product updates available at amp.com.au.