

Investment markets and key developments
Share market were mixed over the last week. US and Eurozone shares rose to new record highs, with US inflation not as high as feared even though money market expectations for rate cuts were trimmed. However, while Eurozone shares rose 0.5% for the week, US shares ended the weak down 0.1% not helped by messy economic data and volatility associated with the expiry of options and futures contracts. Chinese shares rose 0.7% for the week, but Japanese shares fell 2.5% as expectations for a Bank of Japan monetary tightening in the week ahead firmed. Australian shares fell 2.3% from their record high a week ago with financials led down by the banks - as a major broker doubled down on a sell recommendation - and resources shares falling on the back of lower iron ore prices. While iron ore prices continued their slide, copper prices broke higher (which is usually a positive sign) and the oil price rose to its highest since November, albeit its well below 2022 highs. The $A fell as the $US rose on the back of trimmed market expectations for US rate cuts.
After a run of strong gains – with global shares rising 23% from their lows in October last year to recent highs and Australian shares rising 16% - shares remain vulnerable to a correction or period of consolidation. Equity risk premiums as measured by the gap between forward earnings yields and 10-year bond yields remain well below post GFC norms (particularly in the US).
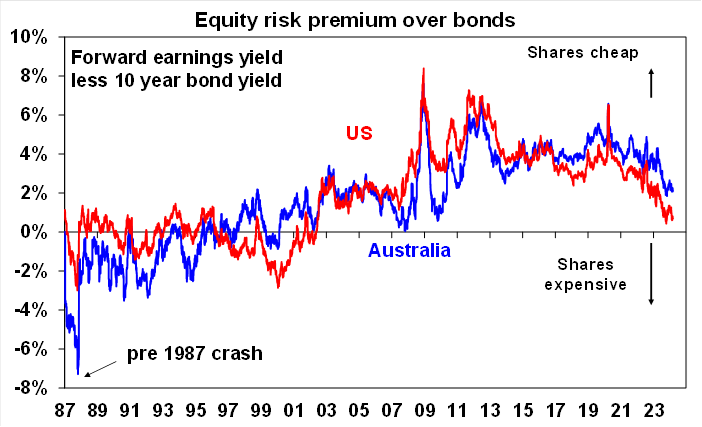
Source: Reuters, AMP
And investor sentiment is positive which leaves the markets vulnerable to any bad news – such as weaker growth and geopolitical issues. However, its noteworthy that our measure of investor sentiment is nowhere near as extreme as often seen prior to past major corrections (including that seen last July to October.
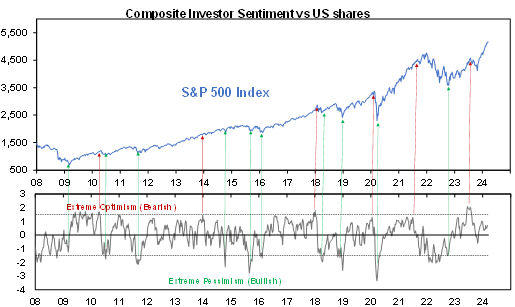
Source: Reuters; AMP
Notwithstanding high short term risks the broad environment of mostly ok economic and earnings news, ongoing expectations for rate cuts and enthusiasm for AI points to a continuing rising trend this year in shares, albeit its likely to be more constrained and volatile than last year was. And this includes the Australian share market even though it may be a laggard given a lack of AI exposure and risks around the Chinese economy.
Although iron ore prices are going through another periodic set back on the back of reduced demand and rising inventories in China and could push back to around $US90/tonne we don’t see a major plunge as the Chinese Government is likely to undertake enough stimulus to support its “around 5%” GDP growth target this year which in turn will support the iron ore price.
Another hot US CPI, but it was not as bad as feared and disinflation likely remains on track. Both the headline and core CPI rose 0.4%mom in February. Energy prices rose and core goods prices rose for the first time in months and measures of inflation breadth ticked up. Producer price inflation also rose a bit more than expected. But against this the rise in goods prices in the CPI was driven by used car prices where private surveys are still pointing down, owners’ equivalent rent slowed, and services inflation slowed slightly and is likely to slow further with the cooling US jobs market. The Fed is likely to remain cautious for now but looks to remain on track for a start to rate cuts in June, although there is a high risk that it could be July.
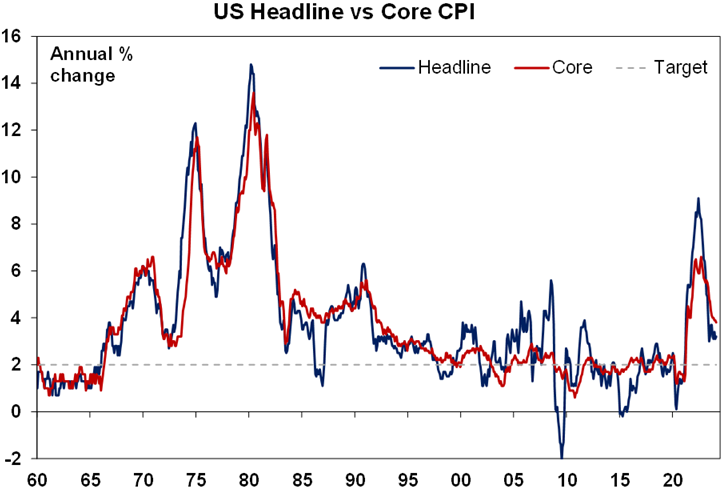
Source: Bloomberg, AMP
Our US Pipeline Inflation Indicator has edged up a bit this year partly reflecting higher shipping costs but remains around levels consistent with 2% inflation.
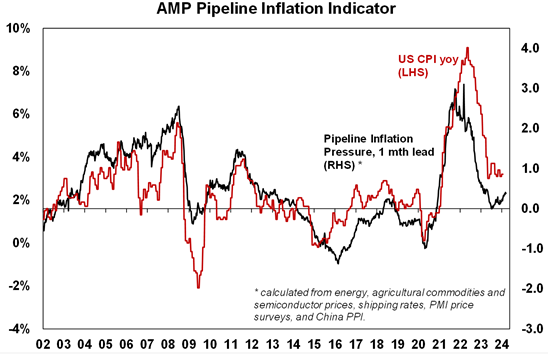
Source: Bloomberg, AMP
The RBA is likely to use the sticky inflation experience in the US as another reason for it to remain cautious for now at its upcoming meeting on Tuesday and reiterate that a further rate hike can’t be ruled out. (See the “What to watch over the next week?” section below for a preview of Tuesday’s RBA meeting.)
Australia’s population boom looks to be continuing. Net permanent and long-term arrivals into Australia in January suggest immigration is continuing to strengthen or at least remain around record levels. It’s likely to slow going forward as the reopening spike in student arrivals subsides and tougher visa rules kick in but so far there is not much sign of that. Ideally, to bring underlying housing demand (which is currently running around 220,000 pa) below the ability to supply homes (completions are currently around 170,000 pa) and cut into the housing shortfall, immigration should be cut back at least to 200,000 a year (from over 500,000 currently).
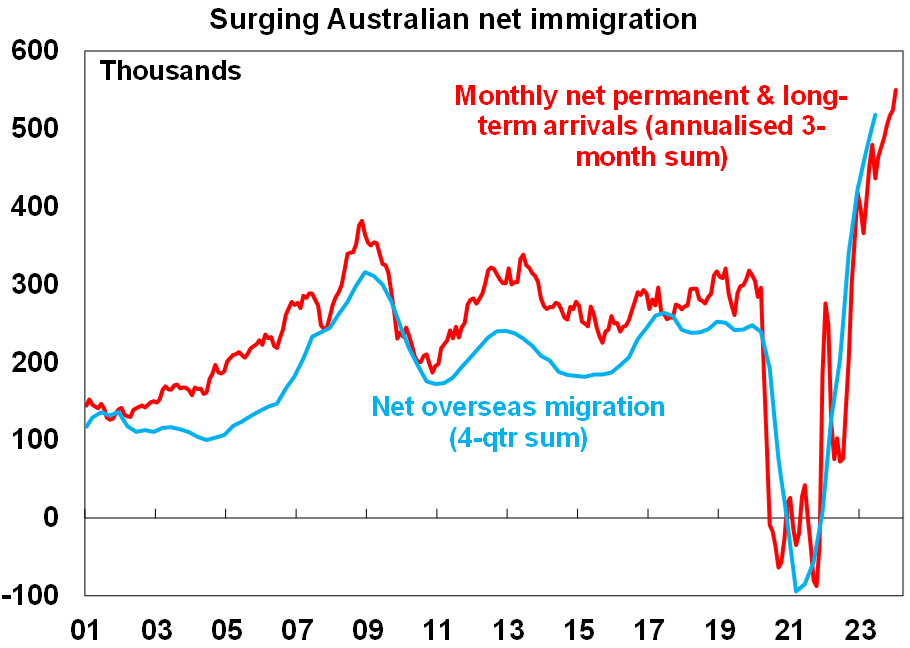
Source: ABS, AMP
Low Australian housing vacancy rates and rapidly rising rents. Reflecting the housing shortage, capital city rental property vacancy rates remain ultra-low which in turn is driving ultra strong rental growth. Fortunately, rent growth is starting to slow a bit as affordability constraints kick in.
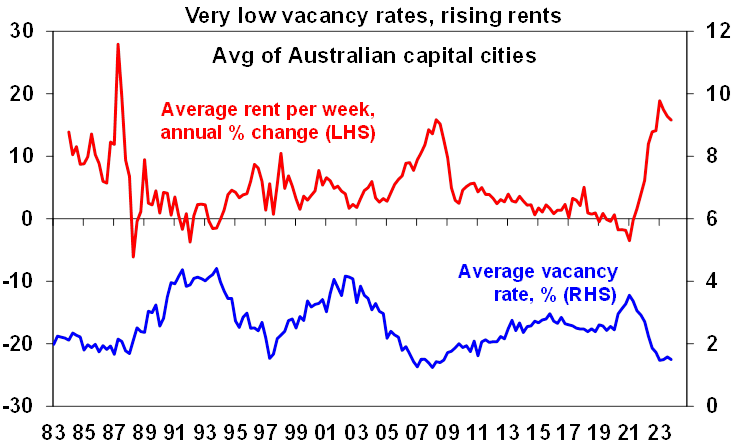
Source: REIA, AMP
Economic activity trackers
Our Economic Activity Trackers are still not showing anything decisive.
Levels are not really comparable across countries. Based on weekly data for eg job ads, restaurant bookings, confidence and credit & debit card transactions. Source: AMP
Major global economic events and implications
While US inflation data was on the hot side in February, economic activity data was soft. Retail sales rose in February after weather affected weakness in January but the rise was less than expected and January was revised even weaker indicating a weak start to the year for consumer spending. Similarly, industrial production rose only slightly in February but January was revised to show a bigger fall. Small business optimism remained weak and manufacturing conditions in the New York region fell sharply (albeit the NY Empire survey can be very volatile). The proportion of small businesses raising selling prices is continuing to fall. Jobless claims remained low.
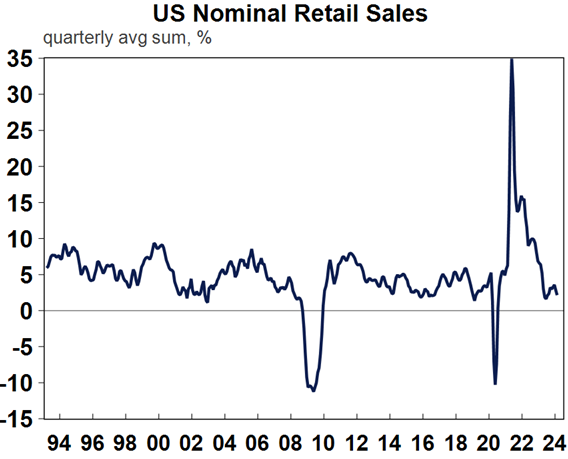
Source: Macrobond, AMP
UK jobs data softened further in January with employment down, unemployment up and wages growth slowing to 5.6%yoy from a high of 8.5% mid last year.
Japan no longer in technical recession. September quarter GDP still saw a fall, but December quarter GDP growth was revised up from -0.1%qoq to +0.1% with stronger business investment. Meanwhile annual Shunto wage negotiations suggest a significant pick up in wages growth, supporting expectations that the BoJ will start to raise interest rates.
Chinese CPI inflation rebounded to 0.7%yoy in February reflecting higher food inflation with adverse weather and a base effect associated with the later timing this year of the Lunar New Year which boosted services price inflation relative to a year ago. A fall back is likely this month with producer price deflation deepening to -2.7%yoy. Home prices continued to fall in February and bank lending and total credit growth were weaker than expected with annual growth in both continuing to slow.
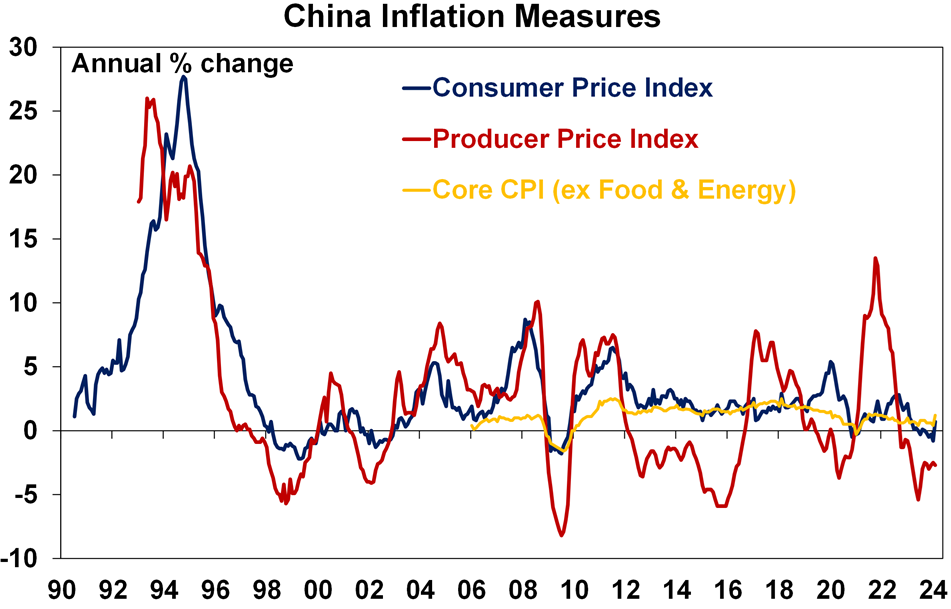
Source: Bloomberg, AMP
Australian economic events and implications
Business conditions improved slightly in February according to the NAB survey. That said confidence remained subdued, orders fell and hiring plans point to slowing jobs growth. The NAB survey also showed an ongoing decline in hiring plans pointing to slower jobs growth. Taken together this is all consistent with soft economic growth.
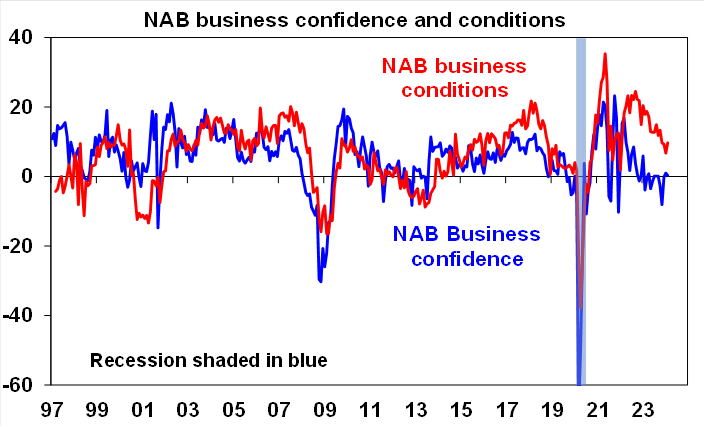
Source: NAB, Westpac/MI, AMP
The NAB business survey showed that purchase costs and labour costs were unchanged but final product prices rose slightly – all are well down from their highs but remain elevated relative to pre pandemic levels.
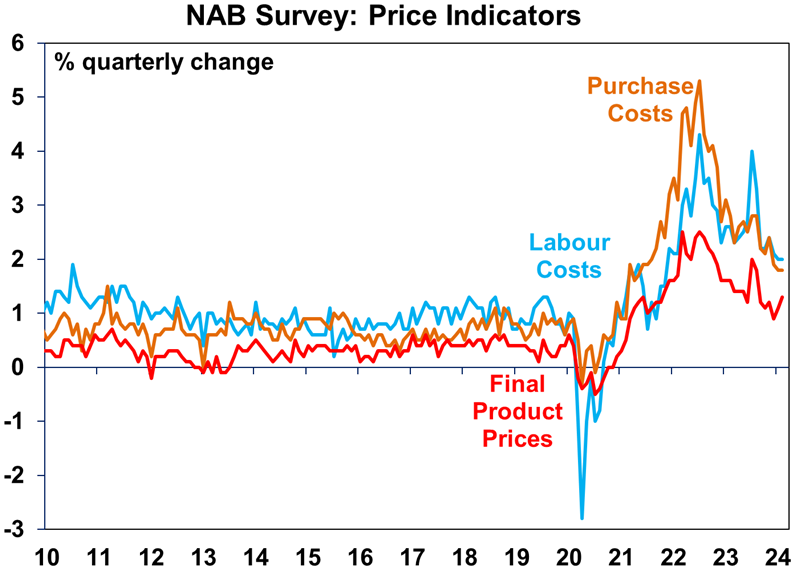
Source: Bloomberg, AMP
Company insolvencies on the rise but remain low as a percentage of registered companies. It’s a similar story with mortgage delinquencies.
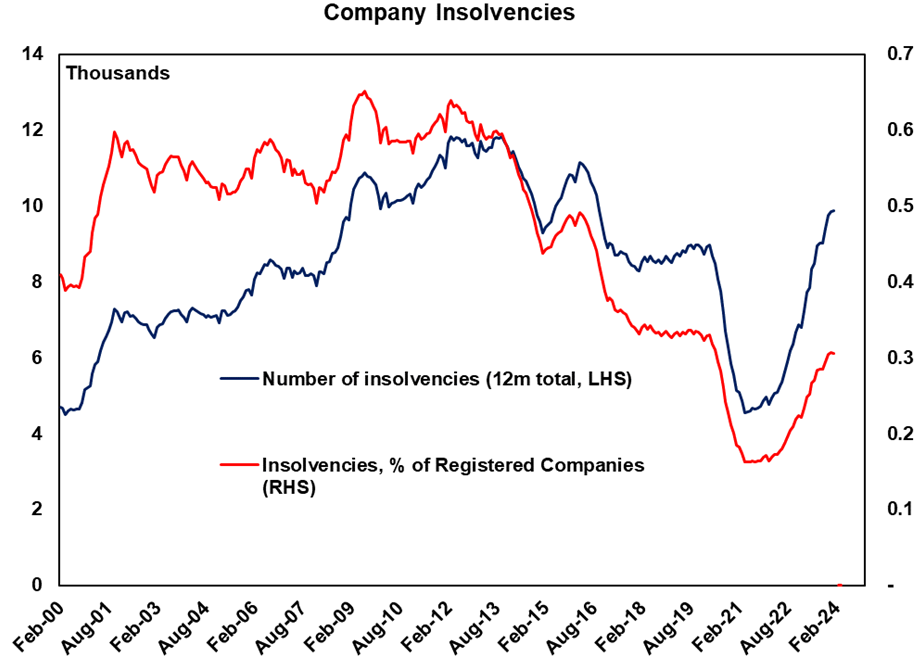
Source: Bloomberg, AMP
Government to axe 500 “nuisance” tariffs – but don’t expect a noticeable fall in prices. This is because although the axed tariffs were levied at 5% they raised very little revenue as businesses had applied for exemptions and so abolishing them means little impact on prices. It’s a good economic reform though as it lowers business compliance costs. But given its small impact, hopefully it’s a stepping stone to wider tax reform. The big gains in cutting tariffs were in the 1980s and 90s.
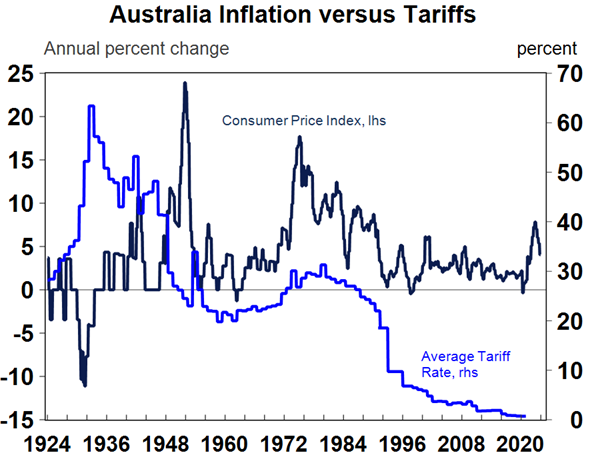
Source: Macrobond, AMP
Expect a diminishing Federal budget revenue windfall. For the last few years, the Federal Budget has been boosted into surplus by windfall corporate tax revenue (on the back of high commodity prices) and personal tax revenue (with stronger than expected employment and wages). While a budget surplus still looks on track for this year, Treasurer Chalmers has signalled the windfall may be slowing reflecting falling iron ore prices (although they are still above budget forecasts) and slowing jobs growth. This is partly political to keep a lid on his ministerial colleagues spending demands and to manage expectations ahead of the May Budget. But it highlights that a return to deficit is likely next financial year, and we need to redouble efforts to slow structural spending growth.
What to watch over the next week?
In the US, the Fed (Wednesday) is expected to leave interest rates on hold and continue to signal three rate cuts this year, but not just yet. While the Fed is likely to signal ongoing caution after another high inflation reading for February and so not wanting to rush into rate cuts until it gets more confidence, it’s also likely to indicate that it sees disinflation continuing with the labour market continuing to cool and so still sees three 0.25% rate cuts this year. We continue to see the first cut in June, albeit with a risk of July. Starting rate cuts later and so closer to the Presidential election runs the risk that they are seen as political. On the data front expect to see unchanged and modest home builder conditions (Monday), a rebound in housing starts (Tuesday) and a soft reading in the Philadelphia region manufacturing index (Thursday).
It’s also PMI week again with February business conditions indices (or PMIs) due Thursday for the US, Japan, Europe, UK and Australia likely to show that the global economy is continuing to grow at a subdued pace.
The Bank of England (Thursday) is expected to leave its key policy rate on hold at 5.25% and signal that it remains cautious.
It’s now likely that the Bank of Japan will finally exit negative interest rates at Tuesday’s meeting (with the money market pricing in a hike to +0.05% from -0.1% currently), scrap or further weaken its Yield Curve Control and possibly end ETF purchases on the back of inflation remaining around target and after very strong annual Shunto negotiations’ wage increases this year. If not on Tuesday, then a move in April is likely. Since it’s been so well anticipated an exit from the -0.1% deposit rate that’s been in place since late 2015 is unlikely to have major global or Australian financial market ramifications although it could cause a bit of volatility. The BoJ is also likely to indicate caution on future rate hikes. Japanese inflation for February (Friday) is expected to bounce back to 2.9yoy% (from 2.2%) with core unchanged at 2.6%yoy.
Chinese January/February activity data (Monday) will likely show unchanged momentum in investment at around 3%yoy, but slowing growth in retail sales and industrial production and unchanged unemployment.
In Australia, the RBA (Tuesday) is likely to leave interest rates on hold at 4.35% and retain a mild tightening bias by repeating that “a further increase in interest rates cannot be ruled out”. Since the last meeting monthly inflation came in weaker than expected but is yet to see updates from key services prices, wages growth came in slightly stronger than expected, GDP growth has slowed in line with RBA forecasts although consumer spending is weaker, and unemployment rose more than expected although this may be partly due to changing seasonal patterns. Given the generally slowing but somewhat mixed readings the RBA is likely to sit on its hands still waiting for more confidence “that inflation is moving sustainably towards the target range”. We continue to see the RBA gaining that confidence by June and being able implement the first cut then but concede there is a high risk it could be delayed till August. Significant fiscal stimulus in the May Budget could risk delaying the start of easing but the RBA will probably want to see whether this eventuates or not before starting to cut – which likely rules out a May cut. The RBA will also release its bi-annual Financial Stability Review on Friday which will be watched for its latest assessment as to how household finances are weathering the rise in interest rates since May 2022. On the data front, jobs data (Thursday) is likely to show a 40,000 bounce in employment after two weak months with the unemployment rate falling back to 4%. Cutting through the monthly gyrations in jobs data, the trend in unemployment is up though.
Outlook for investment markets
Easing inflation pressures, central banks moving to cut rates and prospects for stronger growth in 2025 should make for good investment returns this year. However, with a very high risk of recession and investors and share market valuations no longer positioned for recession and geopolitical risks, it’s likely to be a rougher and more constrained ride than in 2023.
We expect the ASX 200 to return 9% this year and rise to around 7900. A recession is probably the main threat.
Bonds are likely to provide returns around running yield or a bit more, as inflation slows, and central banks cut rates.
Unlisted commercial property returns are likely to be negative again due to the lagged impact of high bond yields & working from home.
Australian home prices are likely to see more constrained gains compared to 2023 as still high interest rates constrain demand and unemployment rises. The supply shortfall should provide support though and rate cuts from mid-year should help boost price growth later in the year.
Cash and bank deposits are expected to provide returns of over 4%, reflecting the back up in interest rates.
A rising trend in the $A is likely taking it to $US0.72, due to a fall in the overvalued $US and the Fed moving to cut rates by more than the RBA.

Weekly market update 26-07-2024
26 July 2024 | Blog Dr Shane Oliver discusses the risk off as tech hit continues; correction risks into August/September; global rate cutting cycle underway; Australian June quarter CPI to rise but the hurdle to another RBA rate hike should be high; and more. Read more
Oliver's insights - rise of populism and bigger government
24 July 2024 | Blog This article takes a look at the rise of populism and what it means for economic policies and investors. Read more
Weekly market update 19-07-2024
19 July 2024 | Blog This week shares are down; US election/Trump prospects starting to impact; global rates easing cycle on track; China Plenum; Australian jobs still tight but easing so RBA needs to be careful; and more. Read moreWhat you need to know
While every care has been taken in the preparation of this article, neither National Mutual Funds Management Ltd (ABN 32 006 787 720, AFSL 234652) (NMFM), AMP Limited ABN 49 079 354 519 nor any other member of the AMP Group (AMP) makes any representations or warranties as to the accuracy or completeness of any statement in it including, without limitation, any forecasts. Past performance is not a reliable indicator of future performance. This document has been prepared for the purpose of providing general information, without taking account of any particular investor’s objectives, financial situation or needs. An investor should, before making any investment decisions, consider the appropriateness of the information in this document, and seek professional advice, having regard to the investor’s objectives, financial situation and needs. This article is solely for the use of the party to whom it is provided and must not be provided to any other person or entity without the express written consent AMP. This article is not intended for distribution or use in any jurisdiction where it would be contrary to applicable laws, regulations or directives and does not constitute a recommendation, offer, solicitation or invitation to invest.
The information on this page was current on the date the page was published. For up-to-date information, we refer you to the relevant product disclosure statement, target market determination and product updates available at amp.com.au.