
Investment markets and key developments over the past week
Shares saw another week of big swings, particularly with the Fed signalling that the peak in interest rates may be higher than previously expected.
This saw US shares fall 3.3% for the week, but Eurozone shares rose 1.6% and Japanese shares rose 0.3%. Chinese shares rose 6.4% helped by talk of a relaxation in China’s zero Covid policy. Despite the poor global lead Australian shares managed to rise by 1.6% for the week helped by a somewhat less hawkish RBA, with gains led by energy, utility, material and industrial stocks. Bond yields rose as did oil and copper prices, but iron ore prices fell. While grain prices had spiked on news Russia was pulling out of the Ukrainian grain exporting deal, they then fell back as Russia reversed its decision. The $A rose and the $US was little changed.
Central banks are slowing, or moving towards slowing, their rate hikes, but they are still hawkish and signalling we are not at the top yet.
This started with the RBA dropping back to 0.25% hikes a month ago, the BoC dropping back to a 0.5% hike, the ECB sounding a bit less hawkish a week ago and in the past week the Fed opening the door to slowing down in December and the Bank of England pushing back against market expectations for how high it will raise rates. The common denominator appears to be that after a rapid rise in interest rates they are now around neutral or into restrictive territory and there is a need to allow for the lags with which monetary policy impacts the economy and arguably the risks are no longer all skewed to higher inflation with increased risk of recession which would depress inflation. Of course, as highlighted by the major central banks that raised rates again in the last week, each central bank is slightly different.
- The RBA is at the least aggressive end of the major central banks likely reflecting the higher sensitivity of Australian households to higher interest rates (due to high debt levels and short dated mortgages) along with slower wages growth compared to other countries. It hiked again in the past week citing high and still rising inflation (with it revising up its inflation forecasts to peak this year at 8% for headline and 6.5% for underlying) and its commitment to returning it to target. But it stuck to a 0.25% increment because after a rapid rise in rates they are now around more normal levels, rate hikes impact with a lag, it needs time to assess their impact and a slower pace keeps public attention on its anti-inflation resolve for longer. It also revised down its growth forecasts to just 1.5% for this year & next and revised up its unemployment forecasts. While the RBA opened the door to “hold steady for a period” if warranted, its base case remains that “interest rates will need to increase further”. We expect another 0.25% hike next month taking the cash rate to 3.1% which we think will be the peak. Evidence is building that RBA rate hikes are working: housing indicators are all very weak; falling home prices will depress demand (and raise financial stability risks); consumer confidence has fallen back anew; and retail sales appear to be stalling in real terms. By the time the RBA meets in February there is likely to be enough evidence demand is slowing which will slow inflation for it to remain on hold, or if not just raise rates once more with 3.35% becoming the peak.

Source: RBA, AMP
- The Fed is at the more aggressive end partly reflecting a tighter jobs market, faster wages growth and less rate sensitive US households. In hiking rates by another 0.75% to 3.75-4%, the Fed hinted that it may slow the pace in December given the cumulative tightening so far and lags depending on economic and financial conditions. But it also indicated that it expects more hikes and that the peak could be higher than previously expected. We expect the Fed to hike by 0.5% in December but add 0.25% to its “dot plot” for the end of next year taking it to 4.75-5%. A faster than expected slowing in growth and hence inflation next year will likely mean that the Fed won’t have to go that far on rates.

Source: Bloomberg, AMP
- The Bank of England raised rates by another 0.75% to 3% and said more hikes may be required but to a lower peak than priced into markets. Its new projections suggest that the UK economy may already be in recession.
The bottom line is that while central banks may slow the pace of tightening, which should reduce the risk of over-tightening, we are still a long way from a “pivot” toward easing. And in the meantime, the risk of a US recession remains high with the US yield curve moving into a deeper inversion for the 10 year less 2 year yield gap and getting closer to inverting for the 10 year yield less Fed Funds rate gap. This is likely to keep shares on edge & at risk of further falls in the short term. Ongoing geopolitical problems – around Ukraine, China/Tawain and potentially Iran and North Korea – add to the risk.

Source: Bloomberg, AMP
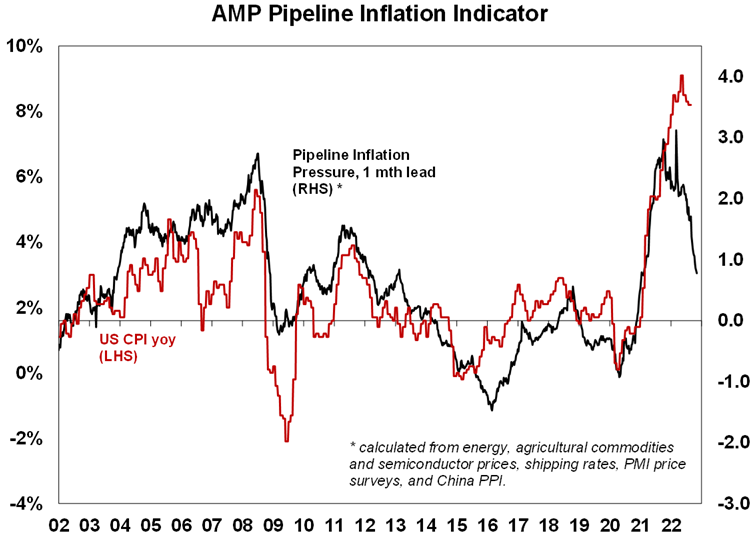
However, there are two positives. First, our Pipeline Inflation Indicator continues to slow suggesting that inflation pressures particularly for goods (which tends to lead services inflation) are continuing to recede. It suggests that at some point in the next few months the US inflation rate will start to surprise on the downside which should take pressure off the Fed through next year, hopefully in time to avoid at least a severe recession. Inflation in Australia is lagging the US by around 6 months so it should start to decline here early next year.
Source: Bloomberg, AMP
Secondly, seasonality is also starting to become positive with shares normally rising into the Christmas/New Year period. And it’s worth reiterating that US shares have consistently rallied after US mid-term elections (which are on Tuesday) with year 3 in the 4 year presidential cycle normally being a strong year on average after year 2 (ie this year) which is normally a poor year.

Source: Bloomberg, AMP
The US mid-terms are likely to see the return of divided government (ie a different party in the Presidency than in the House/Senate), but this is not necessarily bad for shares. Betting markets put the probability of the Republicans taking the House at 90% and the Senate at 70%. There are four points to note:
- First, as evident in the previous chart the year after mid-term elections is usually positive for US shares as uncertainty is removed and the President seeks to boost the economy in the third year of the presidency to get re-elected in the next year.
- Second, divided government tends to be positive for shares because it results in more centrist policies (heading off big spending and tax hikes under Democrats and big tax cuts or spending cuts under Republicans).
- Third, divided government will likely see a return to battles over passing continuing resolutions to fund the Government (to avoid a shutdown) which will next need to be extended from 16th December and to raise the debt ceiling (to avoid default) which will likely be necessary by the September quarter. Democrats could do both before the new Congress starts but if not, there will be another battle over these issues. A somewhat smoother path with less risk would occur if the Republicans control both the House and Senate as they would take most the blame politically if there is a shutdown or default and so would be forced to be more cooperative (after a bit of argy bargy). Republican control of just the House would likely see more the GOP being more obstructionist with greater risk of a shutdown or default as they would seek to blame the President and Senate.
- Finally, as divided government will make it a lot harder for President Biden to pass legislation he is likely to adopt a more hawkish foreign policy stance keeping geopolitical risk high. An even more hawkish US stance toward China could impact Australia via increased sanctions on China along with an increased risk of conflict over Taiwan. Problems in the Middle East could also escalate given the failure of the US and Iran to return to the 2015 nuclear agreement, social unrest in Iran, Iran’s progress towards being able to produce nuclear weapons and the return of Benjamin Netanyahu as Israeli PM increasing the likelihood Israel will take action against Iran.
It seems whenever I hear a party boat its playing Cold Heart by Elton John and Dua Lipa.Then I can’t get it out of my head. It sounds familiar because it’s a combination of Elton John’s songs “Rocket Man”, “Sacrifice”, “Kiss the Bride” and “Where’s the Shoorah?” Last year it became Elton’s first number 1 hit in Australia since 1997. He did it again this year with Britney Spears with Hold Me Closer which combines his songs “Tiny Dancer”, “The One” and “Don’t Go Breaking My Heart.” As Stars on 45 proved decades ago there is nothing like adding a disco beat to a bunch of older songs and making something new.
Coronavirus update
New global covid cases & deaths are continuing to trend down & remain low. China has seen a rise, but there’s talk of a relaxation in its zero Covid policy. Australian cases have also started to edge up from a low level. While new Omicron variants have evolved (BQ.1 and XBB), they do not appear to be more harmful and fully vaccinated people remain less likely to fall seriously ill.

Source: covidlive.com.au, AMP
Economic activity trackers
Our Australian Economic Activity Tracker fell over the last week with most components down and our US Tracker was little changed. But our European Tracker rose again and remains surprisingly strong defying predictions for recession there.
Based on weekly data for eg job ads, restaurant bookings, confidence, credit & debit card transactions, retail foot traffic hotel bookings. Source: AMP
Major global economic events and implications
US economic data was mixed. Both the ISM manufacturing and services conditions indexes fell in October with the former now around 50. Importantly, the prices paid component of the manufacturing index fell below 50 for the first time since 2020 indicating a sharp slowing in price pressures.

Source: Bloomberg, AMP
US jobs data was mixed with payrolls and monthly earnings up more than expected but with the household survey showing a sharp fall in employment, unemployment rising to 3.7% and wages growth slowing to 4.7%yoy (from 5%). The strength in payrolls along with job openings remaining very high and jobless claims remaining very low, indicating that the jobs market remains tight, will likely keep the Fed hawkish but it’s unlikely to stop it shifting down to a 0.5% hike in December.

Source: Bloomberg, AMP
86% of US S&P 500 companies have now reported September quarter earnings but with so far only 70% ahead of expectations which is well below the norm of around 76%. Against this, earnings growth expectations for the quarter have now risen to 4.9%yoy, up from 2.6%yoy at the start of the reporting season, and looks likely to end up coming in around 5.5%yoy. Unfortunately, earnings strength is concentrated in energy stocks – if they are excluded earnings are down 2.9%yoy. Earnings growth outside the US is running stronger than in the US.

Source: Bloomberg, AMP
Better than expected Eurozone growth and higher than expected inflation will keep the ECB hawkish for now. Eurozone GDP defied expectations for a slide into recession in the September quarter with growth of 0.2%qoq/2.1%yoy, with both Germany and Italy surprising on the upside. Unemployment also fell slightly to 6.6%. On the downside though, inflation in October rose to 10.7%yoy with core at 5%yoy which will keep the ECB hiking for now which along with the energy crisis still runs a high risk of tipping Europe into recession next year.
Japanese economic data was mostly soft with retail sales up more than expected, but industrial production down and consumer confidence falling to its lowest since January 1991.
Chinese business conditions PMIs remained soft in October averaging around 49 suggesting that after a reopening rebound through June, July and August growth may be faltering again.
Australian economic events and implications
Australian economic data was on the soft side. The good news is that the trade surplus rebounded to $12.4bn in September driven by flat imports and a 7% surge in exports driven iron ore and gas. However, its mainly due to higher export prices with net export volumes expected to detract around 0.7 percentage points from September quarter GDP growth.
Retail sales rose a stronger than expected 0.6% in September but after allowing for inflation have slowed dramatically with real retail sales growth of just 0.2%qoq in the last quarter down from 1%qoq in the June quarter and it looks to have stalled in the last two months. This is consistent with renewed weakness in consumer sentiment reflecting the impact of falling real wages and surging mortgage interest payments.

Source: ABS, AMP
Housing related data was all weak. The downtrend in housing finance remained rapid in September. Housing finance is now down 24% from its January high. Further falls are likely as higher interest rates and depressed home buyer confidence impact. Reflecting the fall in housing finance, housing credit growth is also now slowing sharply with further weakness to come.

Source: ABS, AMP
Building approvals also fell in September. While they have been stable over the last few months further falls are likely as higher interest rates impact. The flow through to home building will likely be gradual though as there is still a large pipeline of approvals yet to be completed, but home building is still likely to slow particularly for houses as opposed to units. A slowdown in home building may take some pressure off home building inflation.
Home prices fell again in October & national average home prices are now down 6% from their high with further falls likely as still rising interest rates, a reset of fixed rate mortgages to much higher rates and slowing economic growth and rising unemployment next year impact. We remain of the view that prices will fall 15-20% from their high with lots of gyrations along the way.

Source: CoreLogic, AMP
Finally, the Melbourne Institute’s Inflation Gauge suggests inflation may be stabilising. It has been undershooting the CPI but has been relatively stable around 5%yoy over the last 4 months.

What to watch over the next week?
In the US, apart from the mid-term elections (Tuesday), the focus will be on October inflation data (Thursday). Higher gasoline prices are expected to push up the monthly CPI by 0.7%mom but annual inflation is likely to drop to 8%yoy (from 8.2%) as higher increases a year ago drop out. Core inflation is likely to slow slightly to 0.5%mom leaving annual core inflation at 6.6%yoy. Small business optimism for October (Tuesday) is likely to be soft.
Chinese trade data for October (Monday) is likely to show a further slowing in exports and imports and inflation data (Wednesday) is likely to show CPI inflation falling back to 2.5%yoy and producer prices falling by -1.6%yoy.
In Australia, the Westpac/MI consumer confidence index for November is likely to fall reflecting news of energy price hikes and rising interest rates. The NAB business survey is expected to show some pullback in hitherto strong business conditions but the focus may be on cost and price pressures. Both are due Tuesday.
Outlook for investment markets
Shares remain at risk of further falls in the short term as central banks continue to tighten, uncertainty about recession remains high and geopolitical risks continue. However, we see shares providing reasonable returns on a 12-month horizon as valuations have improved, global growth ultimately picks up again and inflationary pressures ease through next year allowing central banks to ease up on the monetary brakes.
With bond yields likely at or close to peaking for now, short-term bond returns should improve.
Unlisted commercial property may see some weakness in retail & office returns & the lagged impact of higher bond yields is likely to drag down unlisted property and infrastructure returns.
Australian home prices are expected to fall 15 to 20% top to bottom into the September quarter next year as poor affordability & rising mortgage rates impact. This assumes the cash rate tops out around 3% but if it rises to 4% or more as the money market is assuming then home prices will likely fall 30%.
Cash and bank deposit returns remain low but are improving as RBA cash rate increases flow through.
The $A remains at risk of further falls in the short term as global uncertainties persist and as the RBA remains a bit less hawkish than the Fed. A rising trend is likely over the medium term as commodity prices ultimately remain in a super cycle bull market.
Eurozone shares rose 2.3% on Friday and the US S&P 500 gained 1.4% with mixed US jobs data. The positive global lead saw ASX 200 futures rise 91 points, or 1.3%, pointing to a positive start to trade for the Australian share market on Monday.

Weekly market update 26-07-2024
26 July 2024 | Blog Dr Shane Oliver discusses the risk off as tech hit continues; correction risks into August/September; global rate cutting cycle underway; Australian June quarter CPI to rise but the hurdle to another RBA rate hike should be high; and more. Read more
Oliver's insights - rise of populism and bigger government
24 July 2024 | Blog This article takes a look at the rise of populism and what it means for economic policies and investors. Read more
Weekly market update 19-07-2024
19 July 2024 | Blog This week shares are down; US election/Trump prospects starting to impact; global rates easing cycle on track; China Plenum; Australian jobs still tight but easing so RBA needs to be careful; and more. Read moreWhat you need to know
While every care has been taken in the preparation of this article, neither National Mutual Funds Management Ltd (ABN 32 006 787 720, AFSL 234652) (NMFM), AMP Limited ABN 49 079 354 519 nor any other member of the AMP Group (AMP) makes any representations or warranties as to the accuracy or completeness of any statement in it including, without limitation, any forecasts. Past performance is not a reliable indicator of future performance. This document has been prepared for the purpose of providing general information, without taking account of any particular investor’s objectives, financial situation or needs. An investor should, before making any investment decisions, consider the appropriateness of the information in this document, and seek professional advice, having regard to the investor’s objectives, financial situation and needs. This article is solely for the use of the party to whom it is provided and must not be provided to any other person or entity without the express written consent AMP. This article is not intended for distribution or use in any jurisdiction where it would be contrary to applicable laws, regulations or directives and does not constitute a recommendation, offer, solicitation or invitation to invest.
The information on this page was current on the date the page was published. For up-to-date information, we refer you to the relevant product disclosure statement, target market determination and product updates available at amp.com.au.