
Investment markets and key developments
Global share markets rose again over the last week continuing their rally seen so far this year, helped by confirmation that central banks led by the Fed are becoming less hawkish, albeit with mixed earnings news from US tech companies. For the week US shares rose 1.6% despite a fall back on Friday in response to stronger than expected US jobs data which reignited concerns about rate hikes, Eurozone shares rose 2.1%, Japanese shares rose 0.5% but Chinese shares lost 1%. Reflecting the positive global lead Australian shares rose another 0.9% for the week led by health, IT, property and retail stocks with the ASX 200 now just 0.9% below its all-time high. Bond yields rose in the US after the strong jobs data but fell in Europe and Australia. Oil and metal prices fell but the iron ore price rose. The $A fell back below $US0.70 after the strong US jobs data pushed up the $US.
After a nice six week break - where markets were sort of left on their own to interpret data and assess the outlook and in the process pushed shares up and bond yields down - central banks are back in action. It’s a bit like the parents returning after the kids were home alone for six weeks – but so far so good with the Fed, Bank of England and the ECB all leaning less hawkish than they were late last year, albeit less so for the ECB.
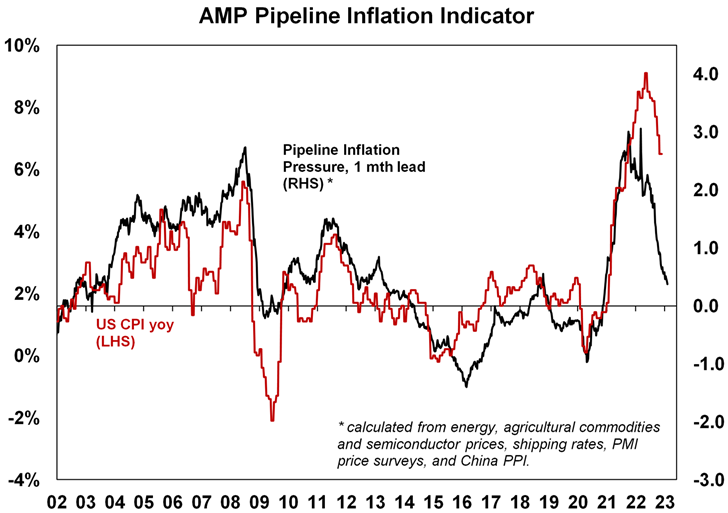
- The Fed of course is key given its influence globally. It hiked again but is sounding a lot less hawkish and open to a cut this year. As widely expected, the Fed downshifted to a 0.25% hike which took its Fed Funds rate to 4.5%-4.75%. The Fed is still hawkish in that it still anticipates “ongoing increases” in interest rates, still sees the labour market as tight and with Chair Powell wary of easing too soon. But against this Powell noted that the “disinflation process has started”, he didn’t push back against the easing in financial conditions, and he indicated a willingness to ease rates if inflation falls faster than the Fed anticipates (which is what we and the markets are expecting). So it was less hawkish than feared. We expect another 0.25% hike in March but since we expect inflation to fall faster than the Fed does – as suggested by our Pipeline Inflation Indicator – we expect this to be the peak for the Fed ahead of rate cuts later this year. The stronger than expected January payroll report in the US adds a bit of upside risk to this, but we expect US jobs data to slow going forward.
- The Bank of England hiked by 0.5% to 4% but indicated it could be finished hiking. Its still concerned by the risk of more persistent inflation but removed a reference to the possible need for more “forceful” action with Governor Bailey indicating it could be finished if data gives no further cause for concern.
- The ECB hiked by another 0.5% too taking its main refinancing rate to 3%, but even it signalled it may be getting near the top. The ECB is the most hawkish of the three – because it started rate hikes latter. It indicated it intends to hike another 0.5% in March and has “more work” to do beyondthat. But it also indicated that the risks are now more balanced, and it will evaluate the path for rates after its March hike.
Coming after the Bank of Canada last week which signalled a pause in hiking, major central banks are getting less hawkish. This is all consistent with the easing in inflation pressures as indicated in our Pipeline Inflation Indicator for the US which is continuing to trend down pointing to further falls in US inflation ahead and, with a lag, in other countries too.
Source: Bloomberg, AMP
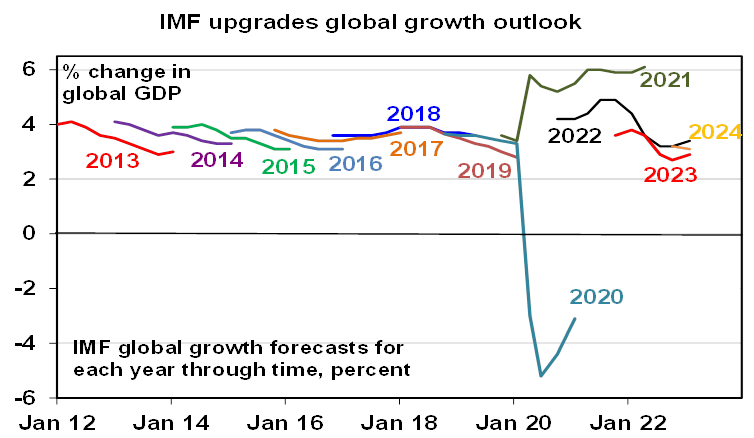
IMF forecasting a better growth/inflation trade-off. Consistent with recent moves we have seen in global business conditions PMIs that we highlighted last week showing somewhat better than feared growth and easing inflation pressures, the IMF revised up its global growth forecasts for this year and sees falling inflation.
Source: IMF, AMP
The combination of progressively less threatening central banks and a somewhat better growth/inflation trade-off globally is positive for investment markets. However, it won’t be smooth sailing: the surprise surge in January US payrolls may prompt the Fed to start sounding a bit more hawkish again in the short term; geopolitical risks remain high around Ukraine, China (as highlighted by the balloon over the US incident) and Iran (as it approaches nuclear breakout capacity); and shares are technically overbought leaving them vulnerable to a pull back.
In Australia, it’s a slightly different story but only because the inflation cycle here is lagging the US by about six months – partly due to a delayed rise in electricity prices, floods and a later reopening. After the strong December quarter CPI we expect that the RBA will raise the cash rate again on Tuesday – see the “What to watch over the week ahead section below” for details. But will the cash rate rise four more times as basedon the Taylor Rule? The past week saw much attention on a forecast from an economist that the cash rate will rise four more times to 4.1% based partly on something called the Taylor Rule. Of course, given the experience of the last year one needs to be humble in forecasting interest rates – so I won’t rule it out! But I doubt rates will need to go that high. The Taylor Rule approach was developed by US economist John B Taylor 30 years ago and posits that the level of the policy interest rate (ie the cash rate in Australia) should equal the inflation rate plus the neutral real interest rate plus 0.5 times the gap between the current and target inflation rate and 0.5 times the output gap (ie, the gap between actual and potential GDP) or alternatively the gap between unemployment rate and the non-accelerating inflation rate of unemployment (NAIRU). In fact, given the high starting point for the inflation rate (7.8%), a neutral rate of 1% and the big gap between inflation and the target inflation rate (2.5%) and unemployment being below NAIRU a standard specification of the Taylor Rule suggests the cash rate should be up around 12% - a level not seen since the early 1990s. However, there are several problems with all this:
- First, the Taylor Rule is a useful framework but it has all sorts of problems in determining the inputs: what neutral real rate to use?; what inflation rate to use (eg the CPI, core rate or trimmed mean)?; whether to use the output gap or the unemployment rate gap?, what potential GDP is?; what NAIRU is?; whether to use underemployment?; etc. So depending on how you define each of these the Taylor Rule can give very different outcomes in terms of what the cash rate should be. For example, the RBA has estimated the neutral real interest rate is anywhere between -0.5% and +2% depending on the approach used. So depending on what neutral real rate assumption is employed could result in a 2.5 percentage point variation in the cash rate prescribed by the Taylor Rule.
- It makes no allowance for whether inflation psychology is entrenched in high long term inflation expectations or not. Back in the 1980s and even early 1990s in Australia it arguably still was requiring much higher interest rates than now to control.
- The Taylor Rule significantly overstated appropriate interest rates in the US & Australia over the last 10 to 20 years.
- It makes no allowance for Australia’s high household debt to income ratio compared to the past. Its now three times what it was in the late 1980s making Australian households far more vulnerable to higher interest rates than in the past.
- It makes no allowance for the potency of interest rates moves in one country compared to another – eg in Australia where households are highly vulnerable to short term interest rate moves compared to the US - given the household debt to income ratio is nearly double that in the US and the high use of variable and short term fixed mortgages in Australia.
- It assumes excessive inflation is all a demand problem which requires higher rates whereas a big part of the recent surge in Australia and elsewhere has been due to supply constraints.
- Related to this, US inflation is already starting to recede despite the Fed Funds rate being well below what the Taylor Rule would prescribe of around 10% and the same is likely in Australia.
- Finally, Australia is not acting alone as global monetary tightening is already doing part of the RBA’s work for it.
With RBA rate hikes already getting traction - indicated by recessionary levels for consumer confidence, the collapse in housing indicators, signs that retail sales and the jobs market are starting to slow - and signs that global and local inflationary pressures are peaking our view remains that we are near the top in rates and taking the cash rate to 4.1% or more would be a policy mistake risking a major recession. Its interesting to see that the money market now sees the cash ratepeaking at around 3.6%, after expecting 4% or more over the past six months, and now sees the possibility of falling rates by year end. Its clearly sniffing out a likely turn in the inflation cycle in Australia
“As goes January for shares so goes the year” worked last year but will it work this year? The so-called January barometer posits that the performance of shares in January is a good guide to how they go for the year. On this basis its pointing to a good year as US and Australian shares rose 6.2% in January. Historically while the “January barometer” has been less reliable when it comes to falls in Januarys (although it worked last year) its more reliable when it comes to gains in January. Since 1980 a positive January in US shares has gone on to a positive year 84% of the time, although a negative January has only seen a negative year 39% of the time. It’s similar for Australia where a positive January has gone on to a positive year 75% of the time but a negative January has only seen a negative year 37% of the time.
Coronavirus update
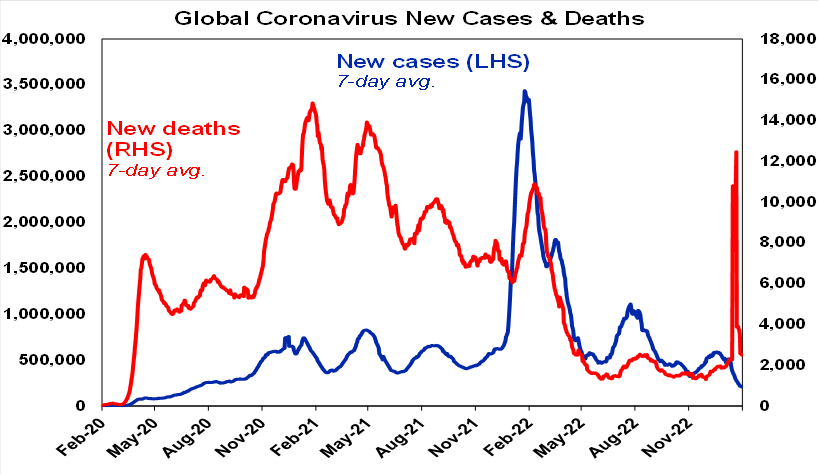
New global Covid cases continued to trend down over the last week – but note that this excludes China. New global deaths showed a spike over Christmas/NY reflecting inclusion of Chinese deaths – but the initial reopening wave in China has slowed.
Source: ourworldindata.org, AMP
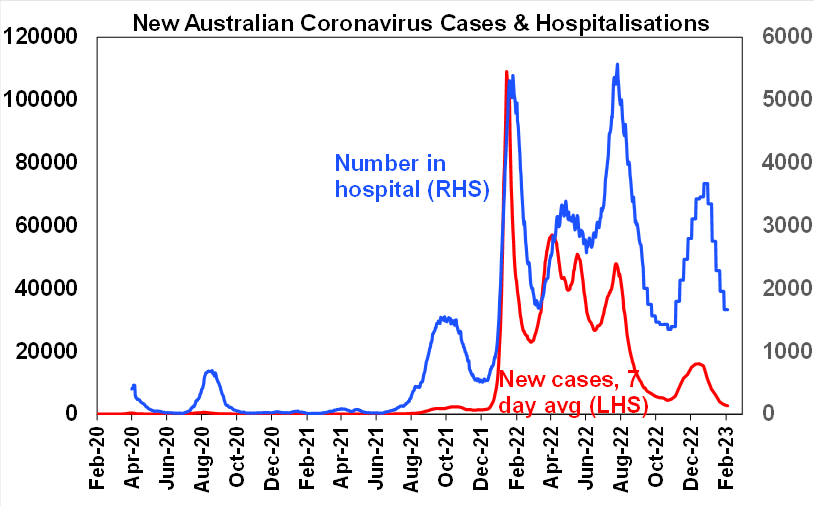
Reported new cases and hospitalisations in Australia have continued to slow. Deaths are falling again too.
Source: covidlive.com.au, AMP
Economic activity trackers
Our Economic Activity Trackers rose last week. Looking through the noise, momentum has slowed since early last year, but they are not indicating economic collapse.
Levels are not really comparable across countries. Based on weekly data for eg job ads, restaurant bookings, confidence, credit & debit card transactions and hotel bookings. Source: AMP
Major global economic events and implications
US economic data was mixed. The ISM manufacturing index fell further to a weak reading of 47.4 and consumer confidence, construction spending and home prices all fell. Against this the ISM services index rebounded to a solid reading of 55.2 and jobs data was strong with a surprise 517,000 rise in payrolls in January, a new low in the unemployment rate of 3.4%, a rise in job openings and another fall in jobless claims all of which will concern the Fed. Against this, the January payroll surge looks a bit aberrant, the labour market is a lagging indicator and a Challenger survey is showing a sharp rise in layoff announcements so we continue to expect a weaker jobs market ahead. On the inflation front, prices components in the ISM surveys are well down from their highs, the December quarter Employment Cost Index slowed further to a 4% quarterly annualised gain, down from 5.8% annualised in the March quarter and average hourly earnings growth in January slowed further to 4.4%yoy (from 4.8%).
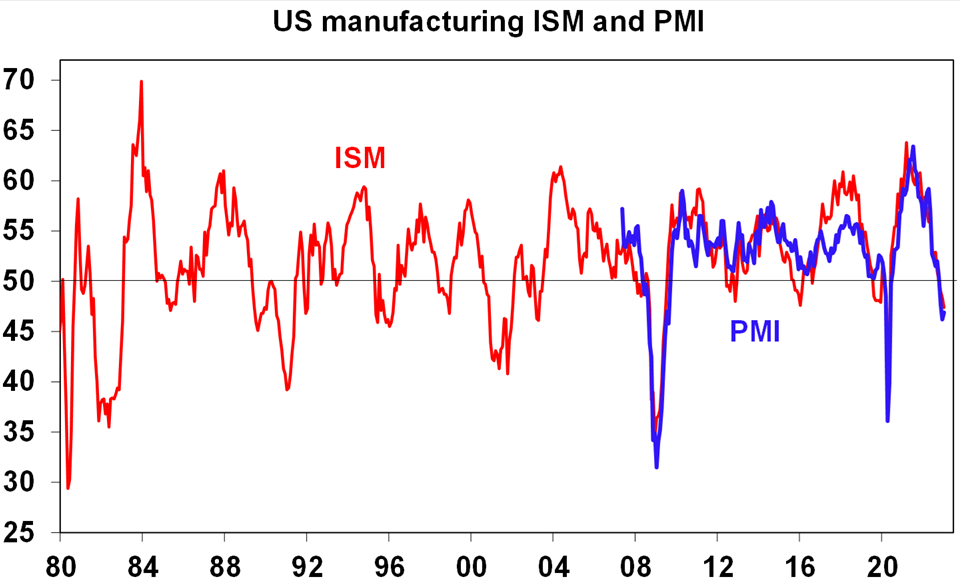
Source: Macrobond, AMP
Around 50% of S&P 500 companies have reported December quarter earnings. 70% of results have come in better than expected which is below the norm of 76%. Consensus earnings expectations are for growth of -2.1%yoy. Energy and industrials are coming in strongest but with materials, financials, telcos and tech seeing falls in earnings. Non-US earnings growth is faster at +6.4%.
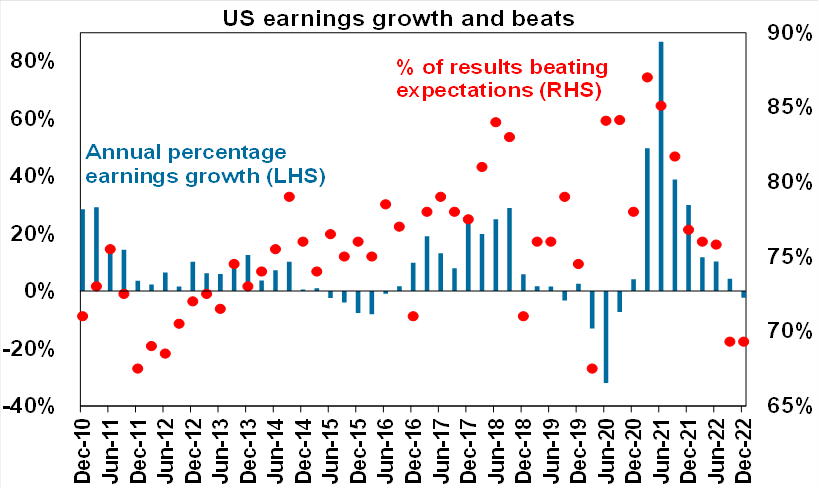
Source: Bloomberg, AMP
Growth a bit stronger and inflation a bit lower in the Eurozone. Eurozone March quarter GDP came in slightly stronger than expected at 0.1%qoq and 1.9%yoy, narrowly avoiding the potential start of a recession, although the German economy contracted slightly. Economic confidence also rose again in January. And CPI inflation fell further to 8.5%, well down from its peak over 10%. That said, German inflation was delayed and so may push it up a bit when its released and core inflation was unchanged at 5.2%yoy.
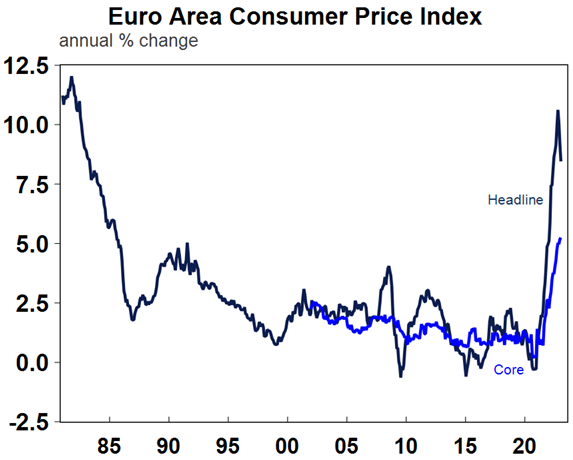
Source: Macrobond, AMP
Better than expected data in Japan. Apart from housing starts Japanese data was generally better than expected with industrial production falling by less than expected, gains in retail sales and consumer confidence and unchanged unemployment at 2.5%.
China’s economy bouncing back. Chinese business conditions PMIs – notably for services - rebounded in January reflecting the boost from reopening. Chinese high frequency weekly data for, eg, traffic and subway usage, flights and property transactions, suggests economic conditions are running around normal going into February after running well below normal late last year with Covid disruptions. The reopening bounce back is consistent with our view that Chinese growth this year will rise to 6% after 3% last year.
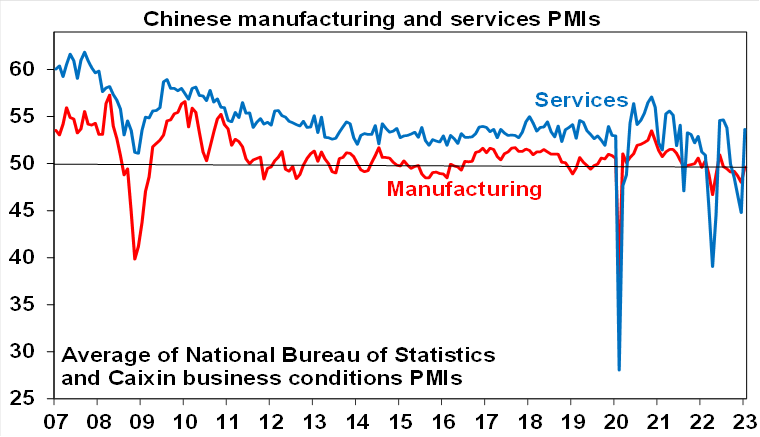
Source: Bloomberg, AMP
Australian economic events and implications
Australian economic data was mostly soft with a plunge in retail sales, a further softening in credit growth and further falls in home prices & housing finance. Home building approvals surged in December but followed several months of sharp falls and was all due to a 59% rise in volatile unit approvals. Approvals to build stand along houses continued to fall as is the broader trend in approvals.
Retail sales plunge is likely noise and signal. The 3.9% plunge in December retail sales was likely exaggerated by seasonal adjustment problems associated with the increasing bring forward of Christmas spending into November due to the rise of Black Friday and Cyber Monday sales. As this is relatively new it takes a while for the ABS’s seasonal adjustment to catch up and in the meantime it has the effect of exaggerating November retail sales and understating December sales. So best to focus on the trend over several months and here there are clear signs of a slowing: over the 3 months to December retail sales rose just 0.9% in nominal terms; and annual retail sales growth of 7.5% is basicallyzero after inflation. The slowdown in real retail sales likely partly reflects a rotation back to consumer services after spending on goods surged in the pandemic. But it likely also reflects rate hikes & cost of living pressures impacting consumer spending consistent with the slump in consumer confidence.
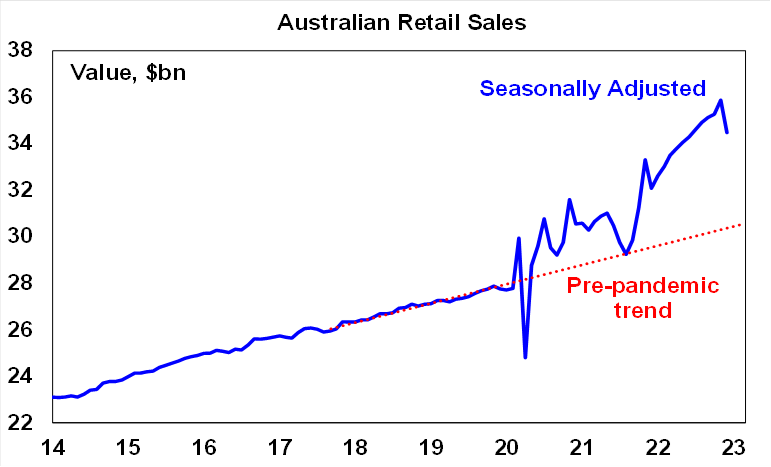
Source: ABS, AMP
Credit growth is slowing and the continuing slide in housing finance (down another 4.3% in December) along with falling home prices points to a further slowing in housing credit ahead.
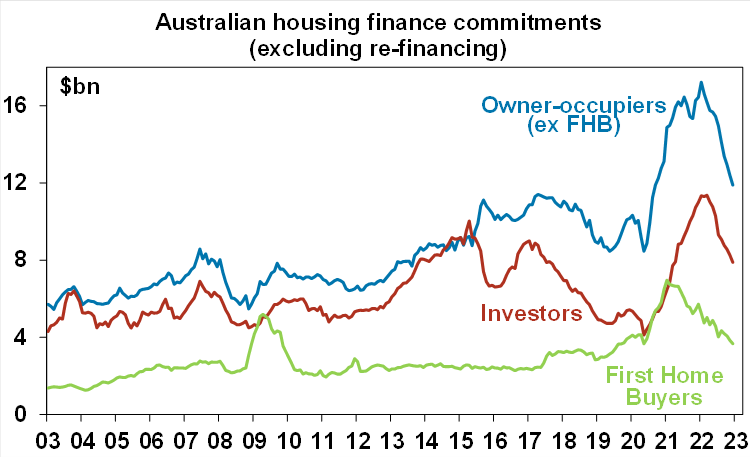
Source: ABS, AMP
Home prices fell another 1% in January based on CoreLogic data, with more falls still likely. While some cities have seen a slowing in price falls it’s doubtful this signals an imminent upswing in property prices. Its common for price falls to wax and wane in downturns, the impact of rate hikes is still feeding though with more to go and the “fixed mortgage rate cliff” along with a sharp slowdown in the economy and rising unemployment risks a rise in distressed selling with demand remaining weak. Property prices are yet to fully catch down to the 25% or so plunge in new buyer’s capacity to pay for a property due to the surge in mortgage rates. As a result, we continue to expect a 15 to 20% top to bottom fall in national average home prices out to the September quarter, of which we have so far seen 9-10%.
What to watch over the next week?
In the US, it’s a quiet week on the data front but another 95 S&P 500 companies are to report December quarter earnings.
Chinese inflation data for January (Friday) is expected to rise to 2.4%yoy for the CPI with producer price inflation still negative at -0.5%yoy. Core CPI inflation is likely to remain below 1%yoy.
In Australia, the RBA is expected to raise the cash rate by another 0.25% taking it to 3.35% its highest since September 2012, making it the ninth rate hike in a row over ten months totalling 325 basis points. This will exceed the 2002-2008 tightening cycle (which amounted to 300 basis points spread over 71 months) making it the biggest tightening cycle in the last 30 years. There remains a strong case for the RBA to pause given the rapid rate hikes to date, to allow for the lagged impact of rate hikes to work and given the risk of unnecessarily knocking the economy into recession. And we think they should pause in February, particularly given the weakness in housing indicators and consumer confidence and early signs of weakness in retail sales and inflation pressures. However, given the stronger than expected rise in underlying inflation in the December quarter, the RBA is likely to want to reinforce its inflation fighting credentials again to keep inflation expectations down particularly given the risk of wages breakout. So, we expect the RBA to raise its cash rate again by another 0.25% on Tuesday. Given the rise in underlying inflation a 0.4% or 0.5% hike is possible, but its unlikely as the RBA is likely to balance the inflation data against the signs that its rate hikes are getting traction and would regard a bigger move as overkill. The RBA will probably maintain its tightening bias but note again that it’s not on a pre-set course leaving open a possible pause. In fact, with signs inflation has now peaked & growth slowing we expect that 3.35% will likely be the peak in the cash rate.
The RBA’s quarterly Statement on Monetary Policy (Friday) will be watched closely for further clues on the monetary policy outlook. We expect it to revise up its June 2023 trimmed mean inflation forecast to 5.8%yoy to reflect the higher December quarter outcome and to revise up its year end unemployment rate to 4% but to leave its year end growth and inflation forecasts - which see growth slowing to 1.4% this year and inflation slowing to 4.7% - pretty much unchanged. Its wage growth forecasts – which see a rise to 3.9% by year end - are probably the key to watch in terms of the interest rate outlook.
A 0.25% rise in the cash rate on Tuesday, if passed on to mortgage holders as we expect, will add another $80 to the monthly payment on a typical $500,000 mortgage which will take the total increase in monthly payments since April to $980 a month or nearly $12,000 a year. This will likely hit spending in the months ahead.
On the data front in Australia, expect December quarter retail sales (Monday) to fall 0.9%qoq and the trade surplus (Tuesday) to fall back to $11.5bn.
The Australian December half earnings reporting season will start to ramp up with around 10 major companies reporting including Nick Scali, Transurban, Macquarie, Amcor, Suncorp, AGL and Mirvac. Following recent upgrades, consensus earnings expectations for 2022-23 are for growth of 7.3%, but this is concentrated in energy, industrials, IT and utility stocks. Expect companies to generally confirm that cost and supply chain pressures have eased somewhat from last year.
Outlook for investment markets
2023 is likely to see easing inflation pressures, central banks moving to get off the brakes and economic growth weakening but proving stronger than feared. So far, so good. This along with improved valuations should make for better returns in 2023. But there are likely to be bumps on the way – particularly regarding recession risks, geopolitical risks and raising the US debt ceiling around mid-year.
Global shares are expected to return around 7%. The post mid-term election year normally results in above average gains in US shares, but US shares are likely to remain a relative underperformer compared to non-US shares reflecting still higher price to earnings multiples (17.5 times forward earnings in the US versus 12 times forward earnings for non-US shares). The $US is also likely to weaken which should benefit emerging and Asian shares.
Australian shares are likely to outperform again, helped by stronger economic growth than in other developed countries and ultimately stronger growth in China supporting commodity prices and as investors continue to like the grossed-up dividend yield of around 5.5%. Expect the ASX 200 to end 2023 at around 7,600. So far its looking like it might be too conservative.
Bonds are likely to provide returns a bit above running yields, as inflation slows and central banks become less hawkish.
Unlisted commercial property and infrastructure are expected to see slower returns, reflecting the lagged impact of weaker share markets and last year’s rise in bond yields (on valuations).
Australian home prices are likely to fall another 8% or so as rate hikes continue to impact, resulting in a top to bottom fall of 15-20%, but with prices expected to bottom around the September quarter, ahead of gains late in the year as the RBA moves toward rate cuts.
Cash and bank deposits are expected to provide returns of around 3.25%, reflecting the back up in interest rates through 2022.
A rising trend in the $A is likely over the next 12 months, reflecting a downtrend in the overvalued $US, the Fed moving to cut rates and solid commodity prices helped by stronger Chinese growth.

Econosights - positive supply shocks
02 May 2024 | Blog Post pandemic, the supply of labour has increased in many major economies, including the US and Australia, through elevated immigration and a lift in the participation rate to a record high. Read more
Retail spending declines in March
30 April 2024 | Blog Retail spending declines in February, reversing Swift Lift in Feb and indicating that consumers still under pressure. Not consistent with an economy that needs higher interest rates. Read more
Oliver's insights - the art of happiness
29 April 2024 | Blog This article looks at happiness and whether economics is failing us with its focus on GDP and consumption. Read moreWhat you need to know
While every care has been taken in the preparation of this article, neither National Mutual Funds Management Ltd (ABN 32 006 787 720, AFSL 234652) (NMFM), AMP Limited ABN 49 079 354 519 nor any other member of the AMP Group (AMP) makes any representations or warranties as to the accuracy or completeness of any statement in it including, without limitation, any forecasts. Past performance is not a reliable indicator of future performance. This document has been prepared for the purpose of providing general information, without taking account of any particular investor’s objectives, financial situation or needs. An investor should, before making any investment decisions, consider the appropriateness of the information in this document, and seek professional advice, having regard to the investor’s objectives, financial situation and needs. This article is solely for the use of the party to whom it is provided and must not be provided to any other person or entity without the express written consent AMP. This article is not intended for distribution or use in any jurisdiction where it would be contrary to applicable laws, regulations or directives and does not constitute a recommendation, offer, solicitation or invitation to invest.
The information on this page was current on the date the page was published. For up-to-date information, we refer you to the relevant product disclosure statement, target market determination and product updates available at amp.com.au.