Key points
- The RBA hiked again by 0.25% taking the cash rate to 3.35%. It continues to expect to increase interest rates further.
-We remain of the view the cash rate is near the top as: rate hikes impact with a lag; inflationary pressures are easing globally & showing signs of easing here too; the sharp rise in household interest payments will weigh on spending; and there is increasing evidence rate hikes are getting traction.
- But given the RBA’s more hawkish tone we are allowing for one more 0.25% hike in March followed by a pause ahead of the start of rate cuts late this year or early next year.
Introduction
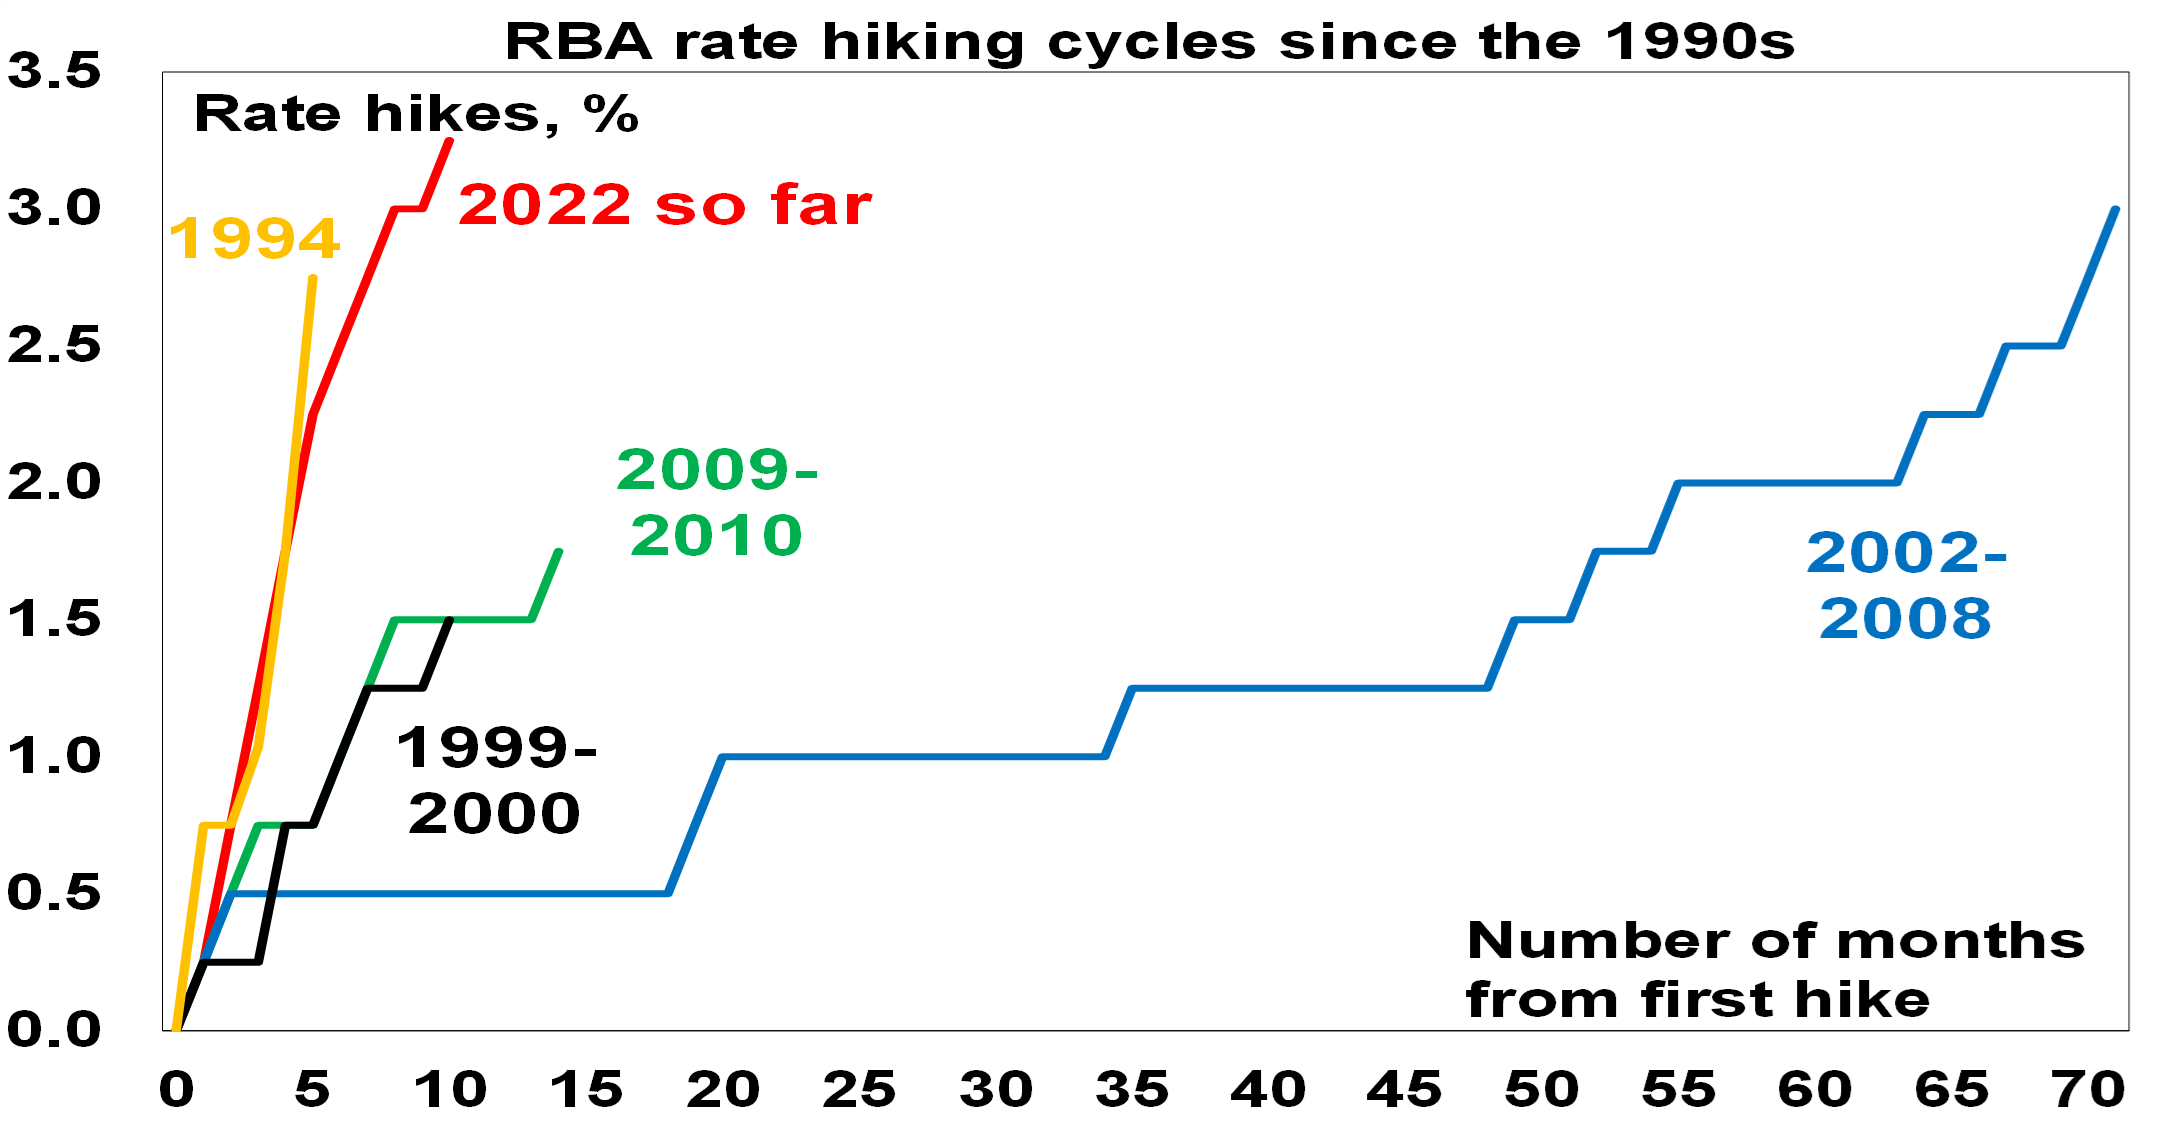
The RBA raised its cash rate by another 0.25% taking it to 3.35%. This is the ninth consecutive rate hike in a row over ten months totalling 325 basis points and exceeds the 2002-2008 tightening cycle (of 300 basis points over 71 months) making it the biggest tightening cycle since the 1980s. Prior to 1990 the RBA cash rate was not officially announced, and short-term rates were very volatile. In the period January 1988 to November 1989 the overnight cash rate rose from 10.6% to 18.2% but mortgage rates were more regulated then and “only” rose from 13.5% to 17%.
Source: RBA, AMP
In justifying another hike, the RBA noted that: inflation is at its highest since 1990 with underlying inflation higher than expected; the labour market remains tight; wages growth is expected to pick up; and its “priority is to return inflation to [the 2-3%] target”. The RBA also reiterated that: monetary policy operates with a lag; and it wants to keep the economy on an even keel. It made no significant changes to its forecasts and still sees growth slowing to 1.5% this year, unemployment rising to 3.75% and inflation slowing to 4.75%. But compared to its last post meeting Statement in December the RBA has become more hawkish most likely as a result of the stronger than expected rise in underlying inflation. In particular, the RBA noted that “the Board expects to increase interest rates further over the months ahead,” but removed the qualifier that “it is not on a pre-set course” (which had been interpreted as opening the door to a pause).
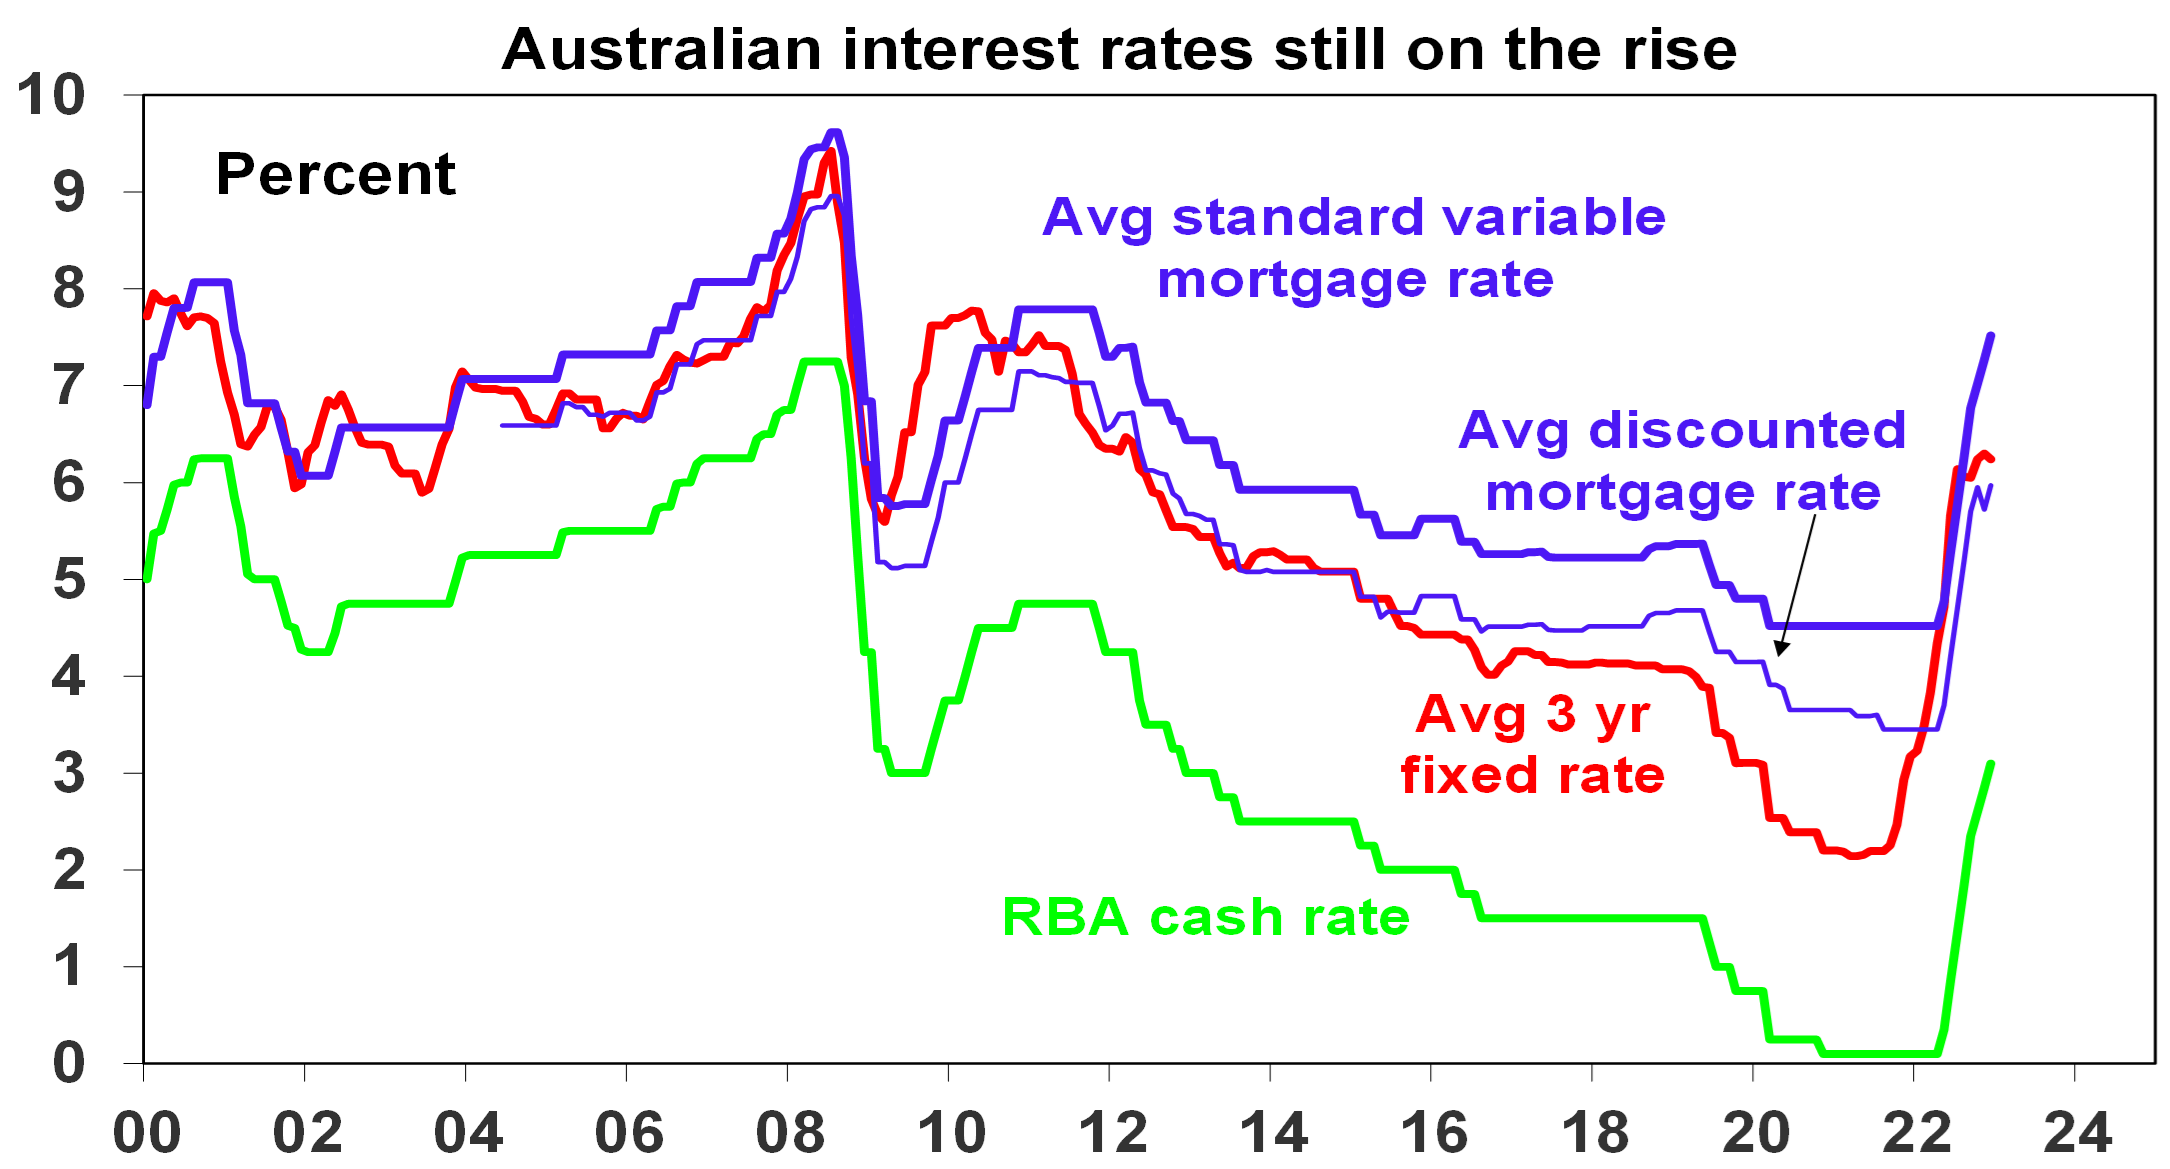
Banks are likely to pass the hike on in full taking variable mortgage rates to their highest in 11 years.
Source: RBA, Bloomberg, AMP
Are we there yet?
While the RBA stepped up its hawkishness and another rate hike now looks likely next month, its commentary is not necessarily a great guide to what happens with rates – just a bit more than a year ago it didn’t expect rates to start rising until 2024 at the earliest! What happens to inflation and growth will be key. Given the experience of the last year one has to be humble in trying to predict the cash rate peak. Prior to the December quarter CPI release we thought the RBA would leave rates on hold at this month’s meeting! And some argue there are still many hikes ahead of us. So, it’s worth considering both sides of the argument.
The case for much higher interest rates
The case for still much higher interest rates rests on the following:
- Inflation in Australia is still rising.
- The labour market remains very tight – with the sum of unemployment and underemployment near their lowest since the early 1980s potentially driving much higher wages and a wage-price spiral.
- Against this backdrop and given the 1970s experience the RBA needs to keep demonstrating its resolve to get inflation back down to keep inflation expectations down – otherwise it will get harder to tame.
- Simple monetary policy rules suggest the cash rate should be much higher. For example, the most common rule called The Taylor Rule – formulated by US economist John B Taylor 30 years ago – posits that the official interest rate should equal the inflation rate plus the neutral real interest rate plus 0.5 times the gap between the current and target inflation rate and 0.5 times the output gap (ie, the gap between actual & potential GDP) or alternatively the gap between the unemployment rate and the non-accelerating inflation rate of unemployment (NAIRU). In fact, given the high starting point for the inflation rate (7.8%), a neutral rate of 1% and the big gap between inflation and the target inflation rate (2.5%) and unemployment being below NAIRU a standard specification of the Taylor Rule suggests the cash rate should maybe be around 11% - a level not seen since the early 1990s!
- Other central banks all have higher rates, viz US Fed 4.5-4.75%; the BoE 4%; BoC 4.5%, RBNZ 4.25%. The ECB is lower at 3% but it started later.
- The economy so far has been resilient with households supported by $250bn or so in extra saving built up in the pandemic lock down years.
Based on this it can be argued that interest rates need to rise a lot further – with several economists expecting the cash rate to rise above 4%.
The case for rates being near the top
The counterargument suggesting that we may be at or close to the top on rates is based on the following:
- First, monetary policy operates with a lag. It takes 2-3 months for RBA rate hikes to impact actual variable rate mortgage payments and then several months before this impacts spending. There are then flow on effects to jobs and businesses with feedback impacts on households which can take a year. And this lag may have been lengthened by the rise in fixed rate mortgages around 2020-21 and the reopening boost to spending. The lag was clearly evident in the late 1980s but ignorance of it contributed to the severity of the early 1990s recession.
- Second, inflationary pressure is easing globally. This is evident in global business surveys showing reduced delivery times and falling work backlogs, lower freight costs, lower metal and grain prices, and falling input and output prices. US money supply which surged ahead of the US inflation spike is falling. US inflation peaked mid-year at 9.1% and has fallen to 6.5% and inflation in Europe, the UK and Canada appears to have peaked. Australian inflation appears to be following the US by six months (due partly to a later reopening in the economy and later surge in energy prices), suggesting it peaked here last quarter.
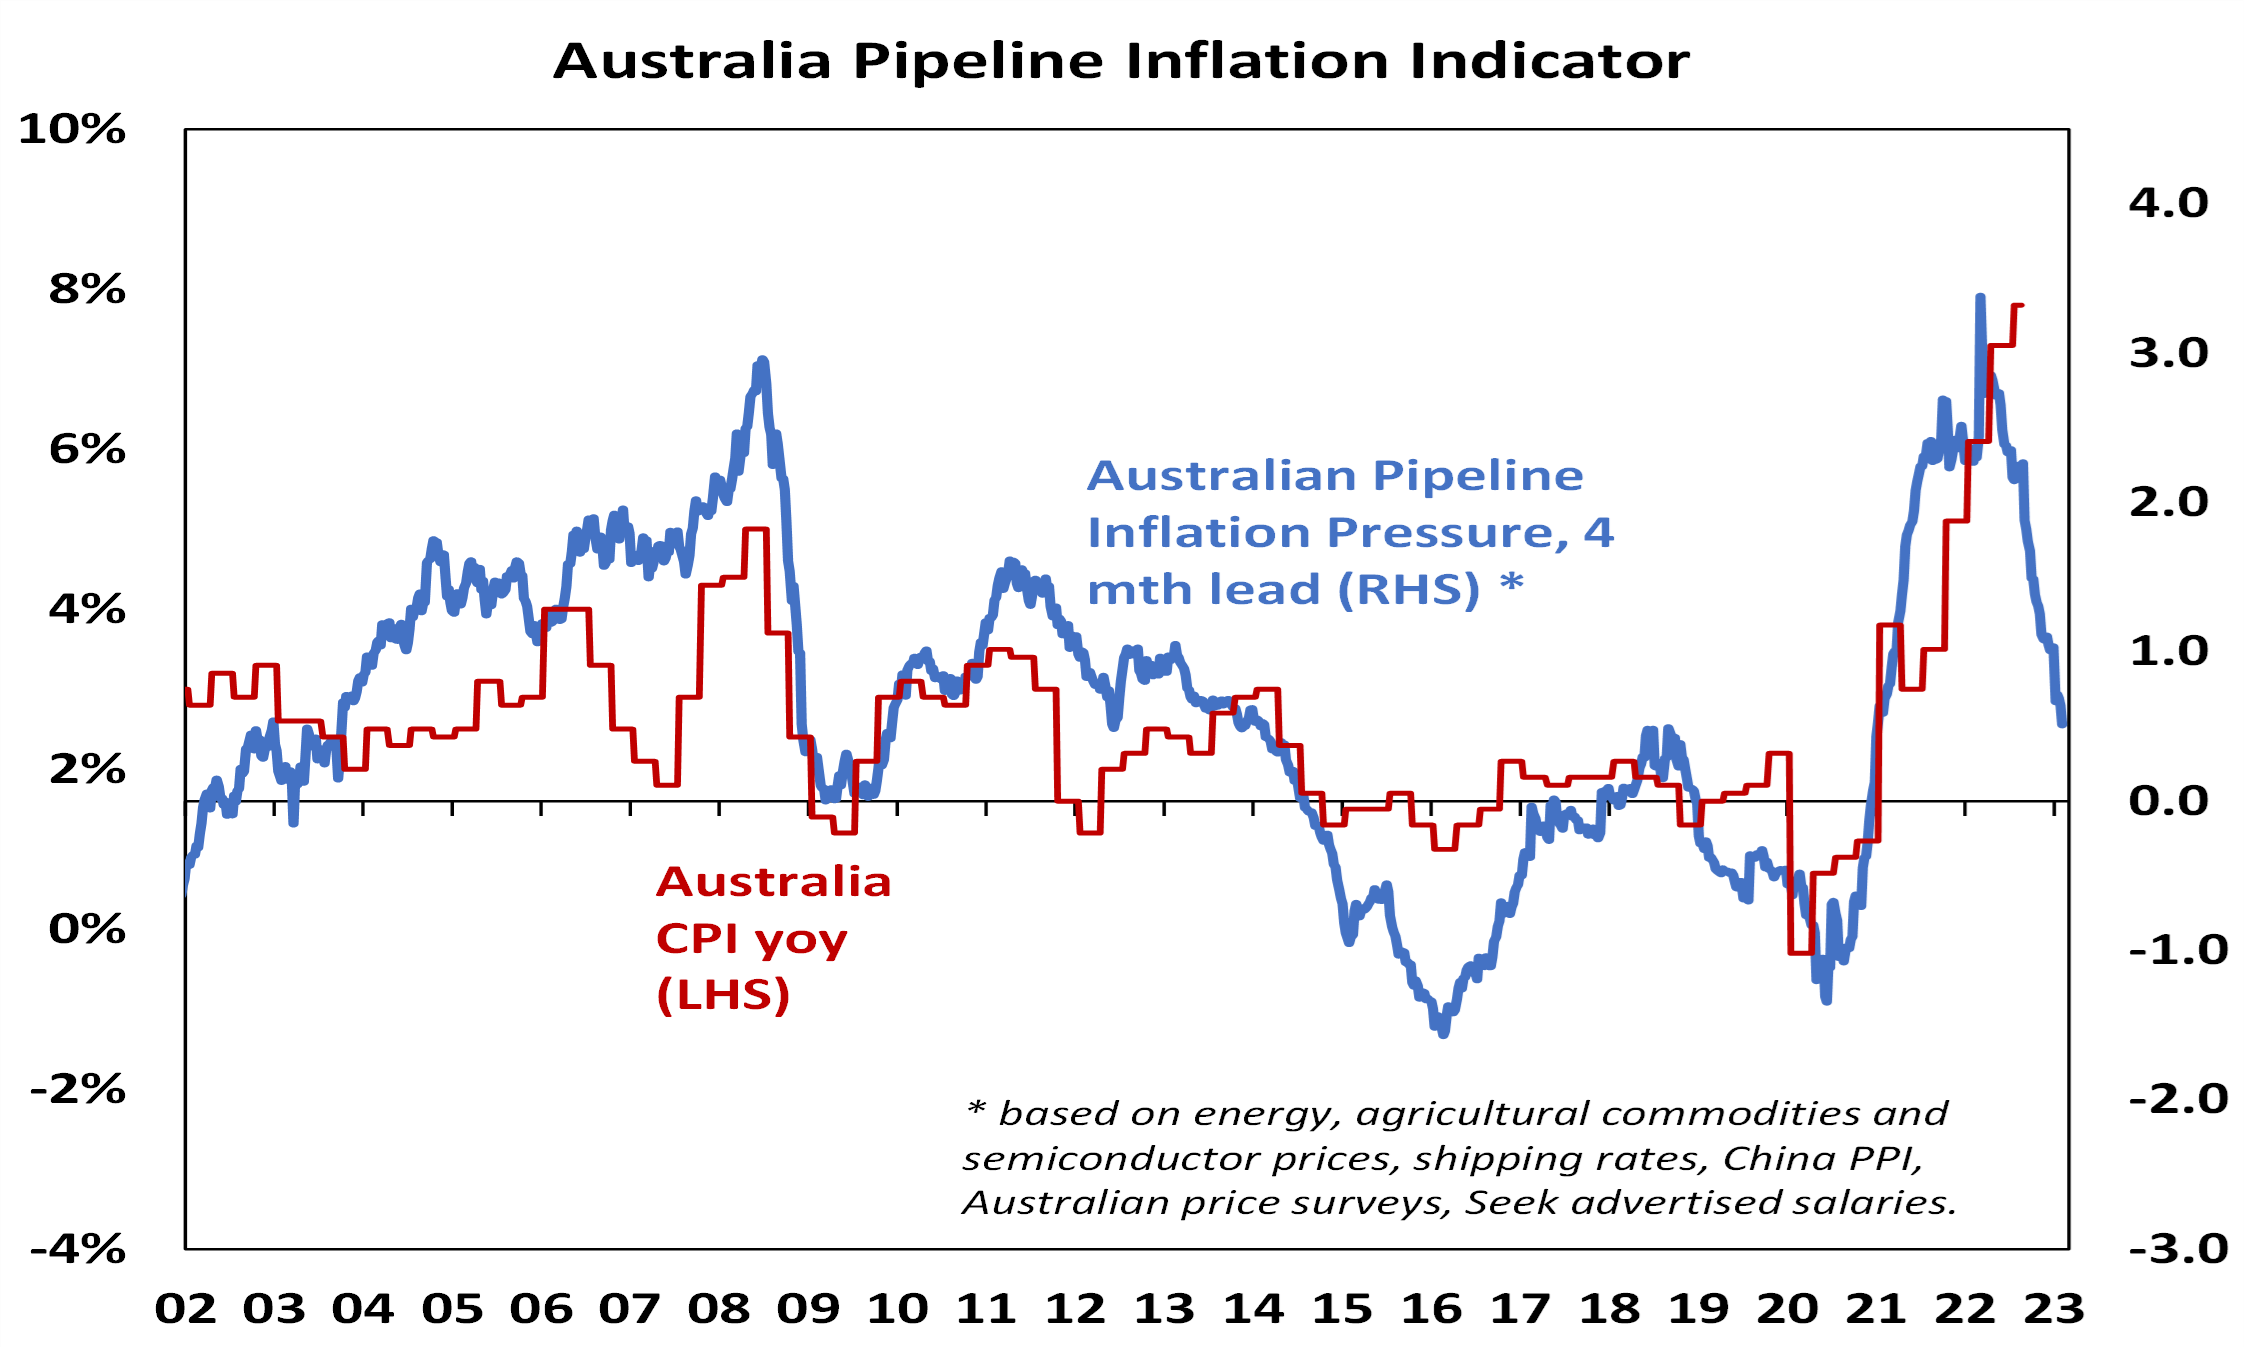
- Third, there are signs Australian inflation is peaking with business surveys showing a downtrend in input and output price readings, low work backlogs & a falling capacity utilisation. Reflecting this and global indicators, our Australian Pipeline Inflation Indicator is falling sharply.
Similar to our US Inflation Indicator but has more Aust components, Source: Bloomberg, AMP
- Fourth, some of the components which drove inflation so high are unlikely to be repeated: the 10.9% December quarter rise in travel costs will start to fade as travel and travel industry capacity return to normal; dwelling purchase costs (up 18%yoy) are now slowing; petrol prices appear to be stabilising; and electricity prices this year may be lower than previously expected with falling gas and coal prices.
- Fifth, while the Taylor Rule is a useful framework its prescription varies dramatically depending on the assumptions used, it makes no allowance for whether inflation psychology is entrenched or not (if it is like in the 1970s and 1980s then much higher rates are needed – but that looks unlikely) and it makes no allowance for the high level of household debt compared to the past and the degree of reliance of households on short dated mortgages compared to other countries (eg in the US 95% of mortgages are at fixed 30 year mortgage rates).
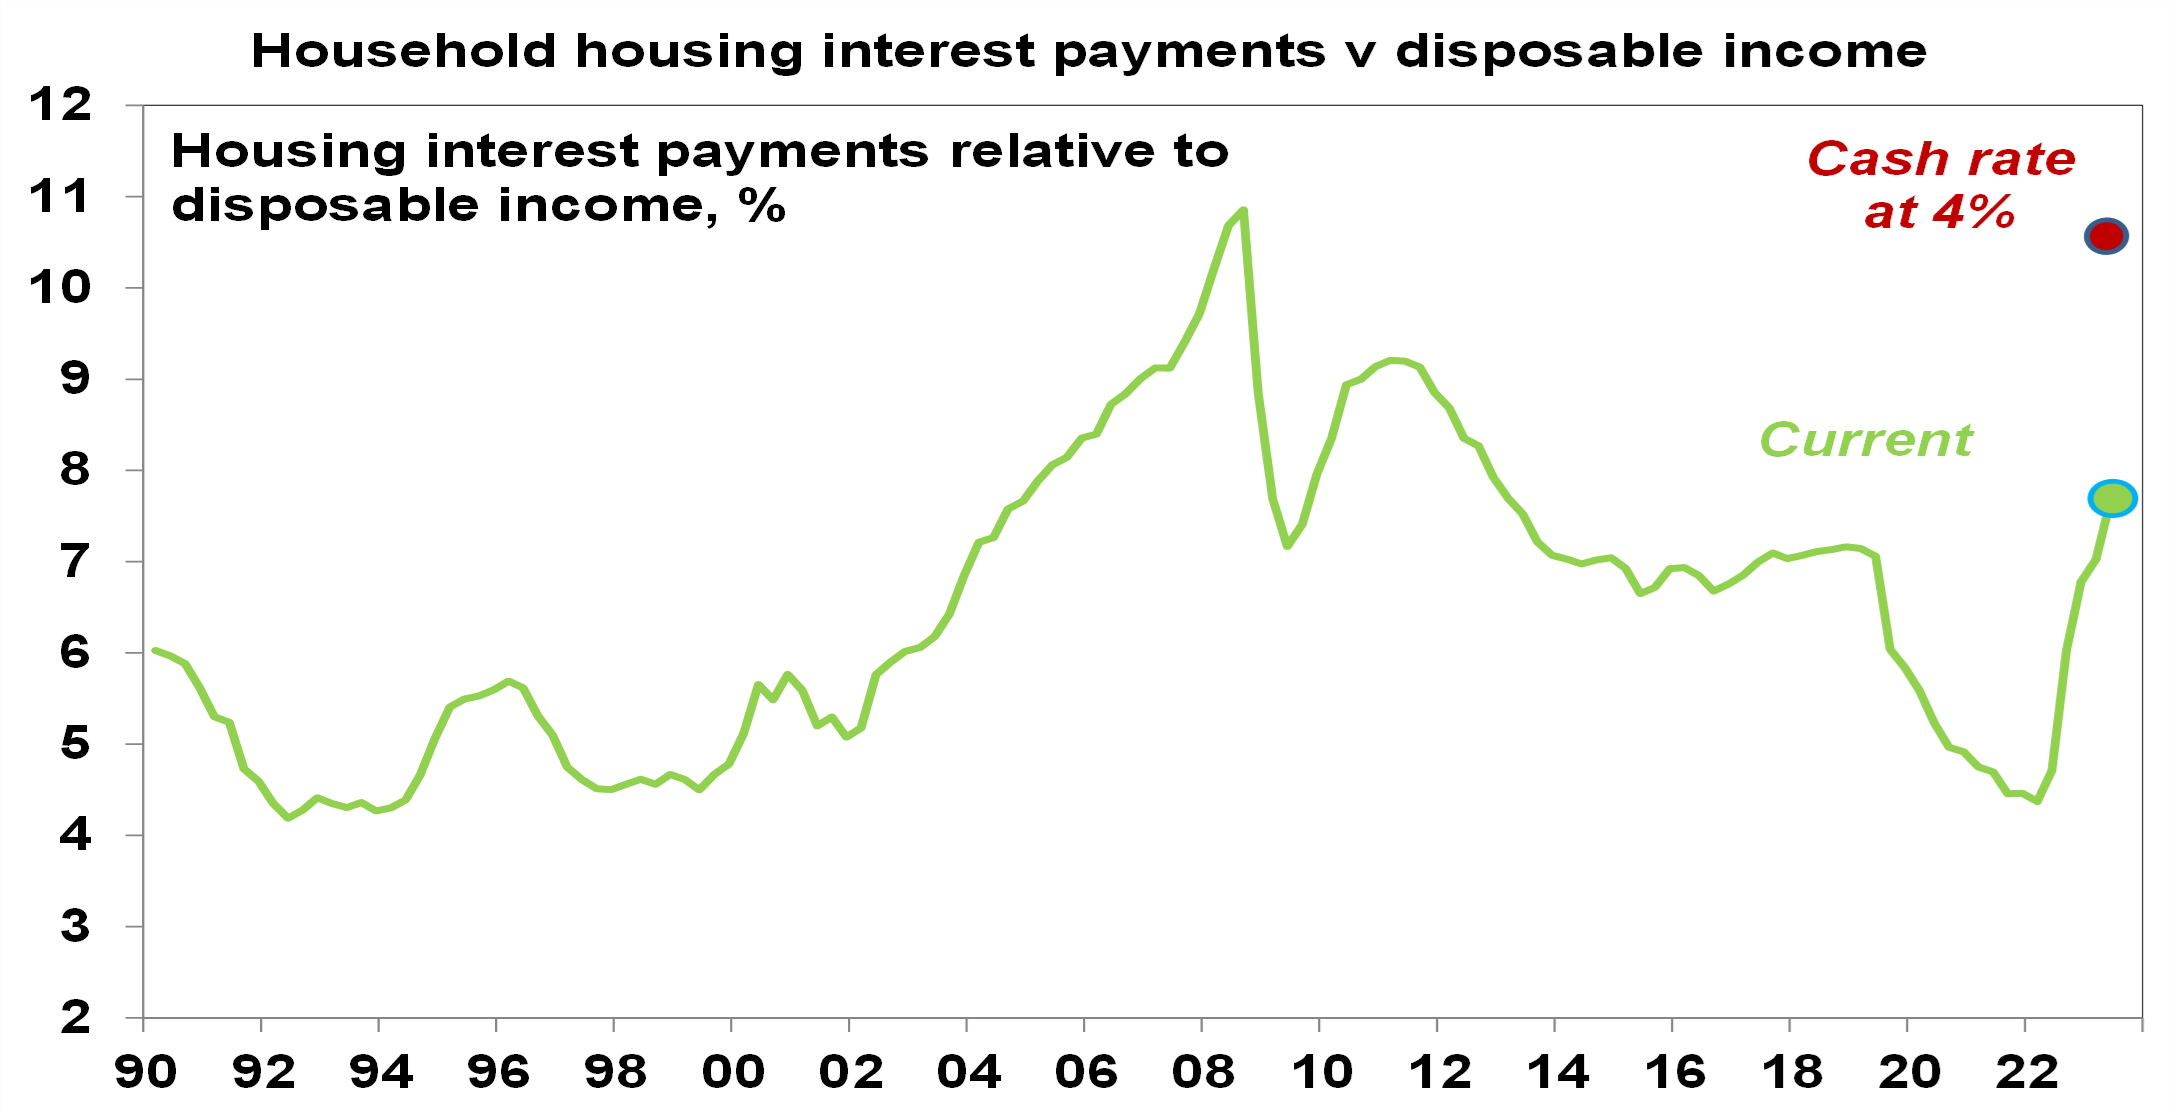
- Specifically in relation to household debt, given the almost three-fold increase in the household debt to income ratios over the last 30 years, a 17% mortgage rate in 1989 – which preceded the early 1990s recession - is roughly equivalent to a 6% variable mortgage rate today and we are already pushing through that. A variable rate borrower on an existing $500,000 mortgage (which is the average) will see roughly another $80 added to their monthly payment from today’s RBA hike which will take the total increase in their monthly payments since April to nearly $1000 a month. That’s an extra $12,000 a year which is a massive hit to household spending power. And roughly two thirds of the 40% of mortgaged households with fixed rates (roughly about 1 million households) will see a 2 or 3 fold increase in their payments when their fixed term expires by the end of the year. And the RBA’s interest rate hikes have now exceeded the 2.5% mortgage rate serviceability buffer that applied up to October 2021 and the 3% since. The surge in interest rates has already pushed mortgage interest payments as a share of household income back to levels not seen since early last decade. A rise in the cash rate to 4% would push the interest payment share to near a record high and total mortgage repayments (ie, interest and principal) as a share of income to record highs. The hit to spending power for households with a mortgage (who tend to vary their spending more than older Australian’s with big bank deposits) is likely to drive a big slowing in consumer spending.
Source: ABS, RBA, AMP
- Sixth, there is increasing evidence rate hikes are getting traction: housing related indicators are all very weak; the 9% fall in home prices will depress consumer spending via a negative wealth effect; consumer confidence remains depressed; retail sales are falling in real terms; and there are some signs of slowing jobs growth. Slower demand in the economy will further reduce inflationary pressures. This may become more evident as the reopening bounce (“revenge” spending) wears off.
- Finally, Australia is not acting alone as global rate hikes are slowing growth in advanced countries which in turn will slow global inflation pressures - so other central banks are doing part of the RBA’s job.
Concluding comment
On balance, while the RBA now looks likely to hike rates again by another 0.25% next month – continuing much further down the path of rate hikes in response to inflation which is a lagging indicator while ignoring the lagged flow through of rate hikes to the economy, signs of slowing demand and improving supply risks plunging the economy into a recession we don’t have to have. So, despite being premature so far, we still see the RBA as being close to the peak with rates. Our base case is now for one more 0.25% hike next month, followed by a lengthy peak as it becomes clearer that inflationary pressures are easing and growth is slowing, ahead of the start of rate cuts late this year or early next year.

Oliver's insights - ineffective investors
22 October 2024 | Blog In the confusing and often seemingly illogical world of investing, investors often make various mistakes that keep them from reaching their financial goals. This note takes a look at the nine most common mistakes. Read more
Econosights - global housing trends
22 October 2024 | Blog The common belief that Australian homes have become unaffordable is understandable, as all the metrics around affordability have deteriorated. But how does the housing situation in Australia compare to our global peers? We go through this issue in this edition of Econosights. Read more
Weekly market update 18-10-2024
18 October 2024 | Blog Down down for global inflation and rates; soft Chinese data but better than feared; strong Australian jobs and the RBA; US earnings results; time for another baby bonus?; and more. Read moreWhat you need to know
While every care has been taken in the preparation of this article, neither National Mutual Funds Management Ltd (ABN 32 006 787 720, AFSL 234652) (NMFM), AMP Limited ABN 49 079 354 519 nor any other member of the AMP Group (AMP) makes any representations or warranties as to the accuracy or completeness of any statement in it including, without limitation, any forecasts. Past performance is not a reliable indicator of future performance. This document has been prepared for the purpose of providing general information, without taking account of any particular investor’s objectives, financial situation or needs. An investor should, before making any investment decisions, consider the appropriateness of the information in this document, and seek professional advice, having regard to the investor’s objectives, financial situation and needs. This article is solely for the use of the party to whom it is provided and must not be provided to any other person or entity without the express written consent AMP. This article is not intended for distribution or use in any jurisdiction where it would be contrary to applicable laws, regulations or directives and does not constitute a recommendation, offer, solicitation or invitation to invest.
The information on this page was current on the date the page was published. For up-to-date information, we refer you to the relevant product disclosure statement, target market determination and product updates available at amp.com.au.
