

Key points
- The rise in bond yields has left shares offering a low risk premium over bonds leaving them at risk of more softness.
- The conflict in Israel has added to the risk, although the threat should be minimal if Iran is not drawn in avoiding a severe impact on oil supplies.
- There are parallels with the run up in bond yields prior to the 1987 crash but relative valuations are less threatening.
- Still falling inflation should take pressure off central banks next year, which should in turn be positive for shares.
Introduction
In the fourth year of my career the share market crashed. In one day, US shares fell 20% and the day after Australian shares fell 25%. From the months just before to the months just after US shares had a total 35% fall and Australian shares had a 50% fall. So, over the space of a few months $1000 invested in the Australian share market had fallen in value to $500. Some lost their fortune including an older friend of mine (because he wasn’t diversified) who had to come out of retirement. The 1987 share market crash – with the one day falls on 19 October in the US and 20 October in Australia and the peak being in August/September 1987 - has become a part of share market history along with events like the 1929 crash, the 1973-74 plunge and the GFC. But each October (or starting in August) many including me have a certain apprehension about markets. This year has been no exception with US, global and Australian shares having falls of around 8% to their recent lows from their highs in July and some citing parallels to 1987. So why the concern now? What’s the risk of a re-run? Does the surge in oil prices and conflict in Israel add to the risk?
Rising bond yields
We thought this year would be okay for shares as inflation would likely fall and recession would likely be avoided. So far so good, although Australian shares have been poor. But the big surprise has been a resumption of the rise in bond yields from April which has taken Australian bond yields to their highest since 2011 and US bond yields to their highest since 2007.
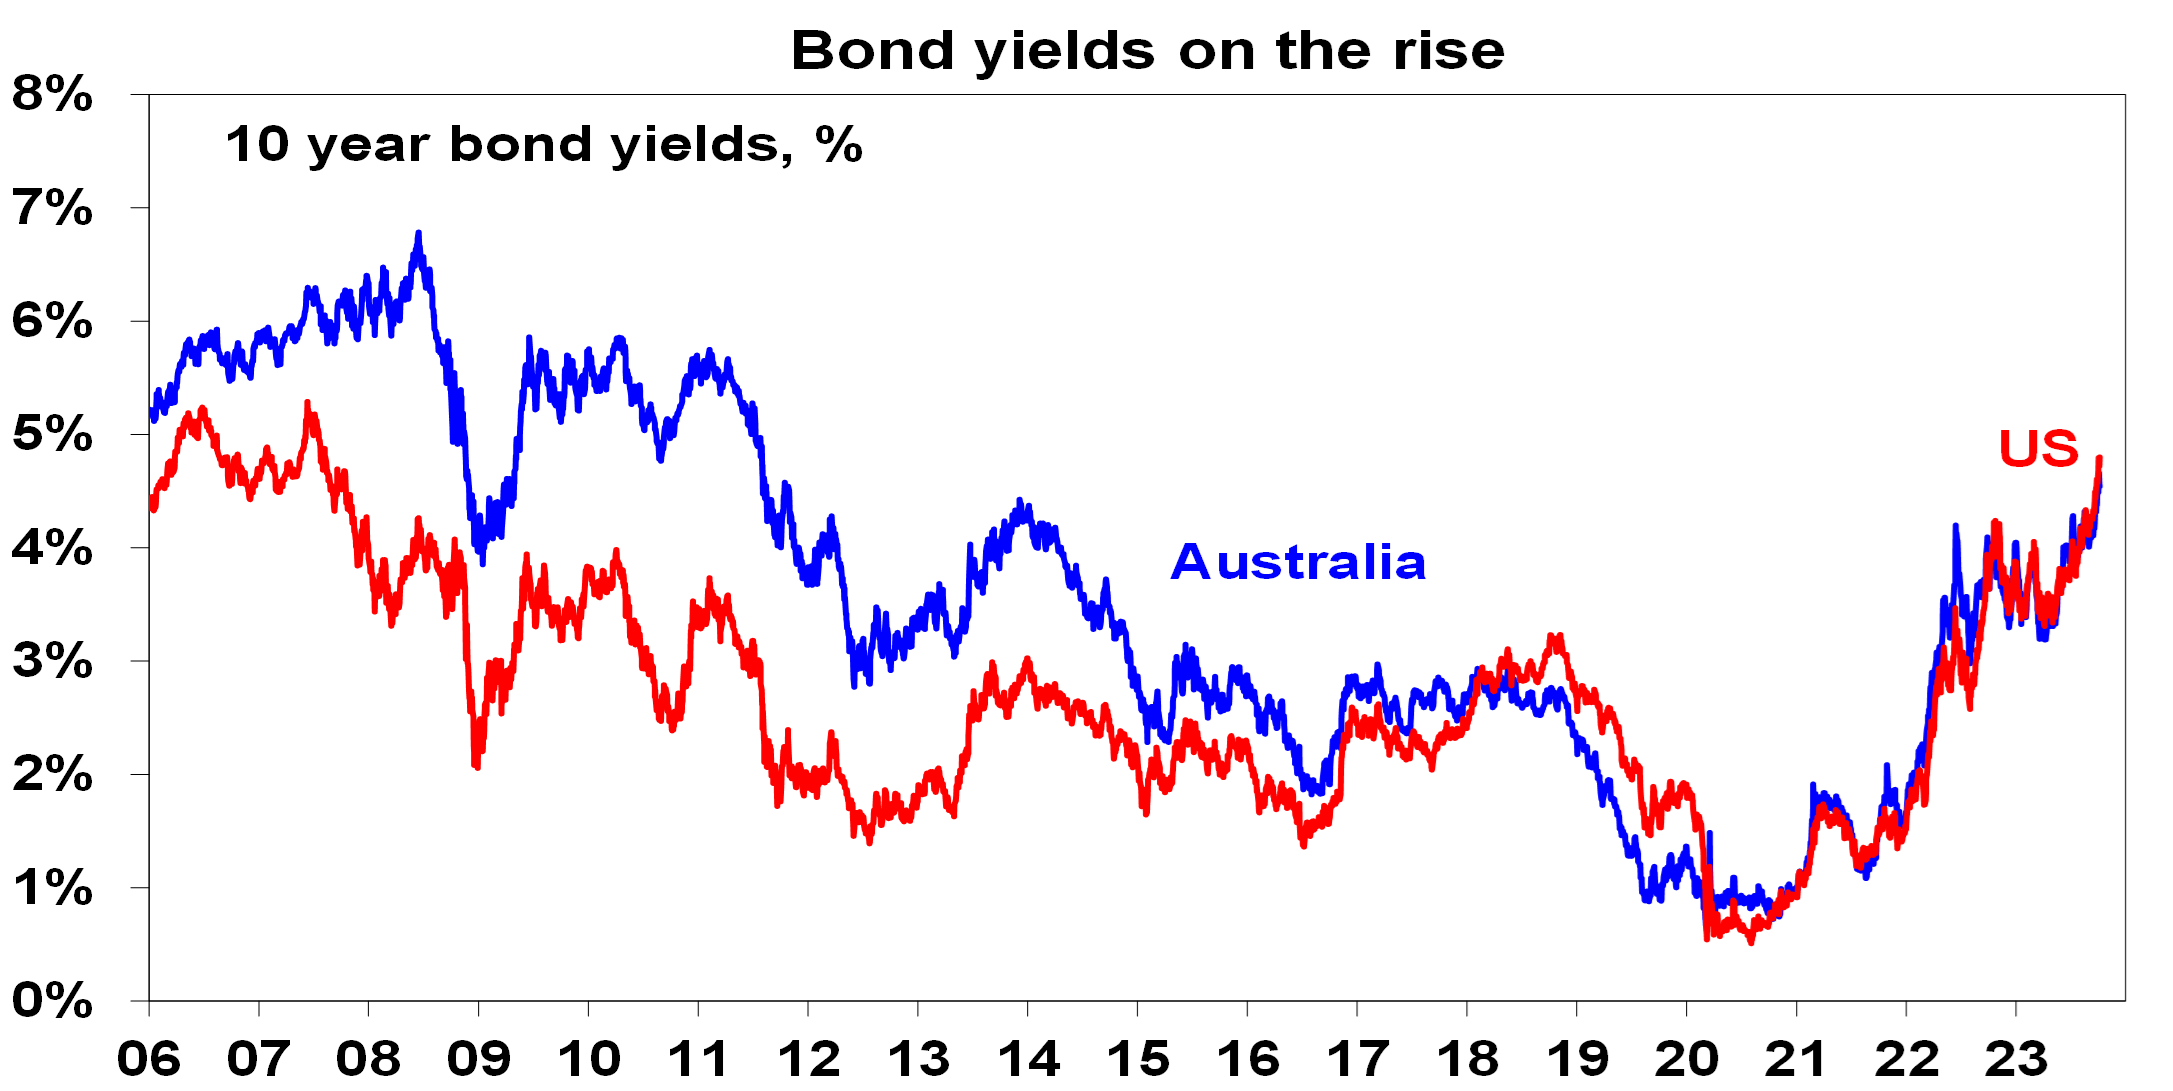
Source: Bloomberg, AMP
This has been mainly due to stronger than expected economic activity keeping interest rate expectations elevated (with the Fed and other central banks flagging that they will keep interest rates “high for longer”), along with the deteriorating US fiscal situation and increased bond issuance and Japan relaxing its limits on its bond yields.
Now, the back up in bond yields this year – being based more on stronger than expected growth and hopes of a soft landing – is less threatening for shares than was the rise in bond yields into last year, which was more driven by rising inflation. But it’s still putting big pressure on share market valuations as highlighted by the deteriorating risk premium that shares offer over bonds. This is proxied in the next chart by the earnings yield on shares (12 month ahead consensus earnings expectations divided by share prices) less the 10-year bond yield. It has fallen to its lowest in over 20 years in the US, and in Australia to its lowest since 2010.
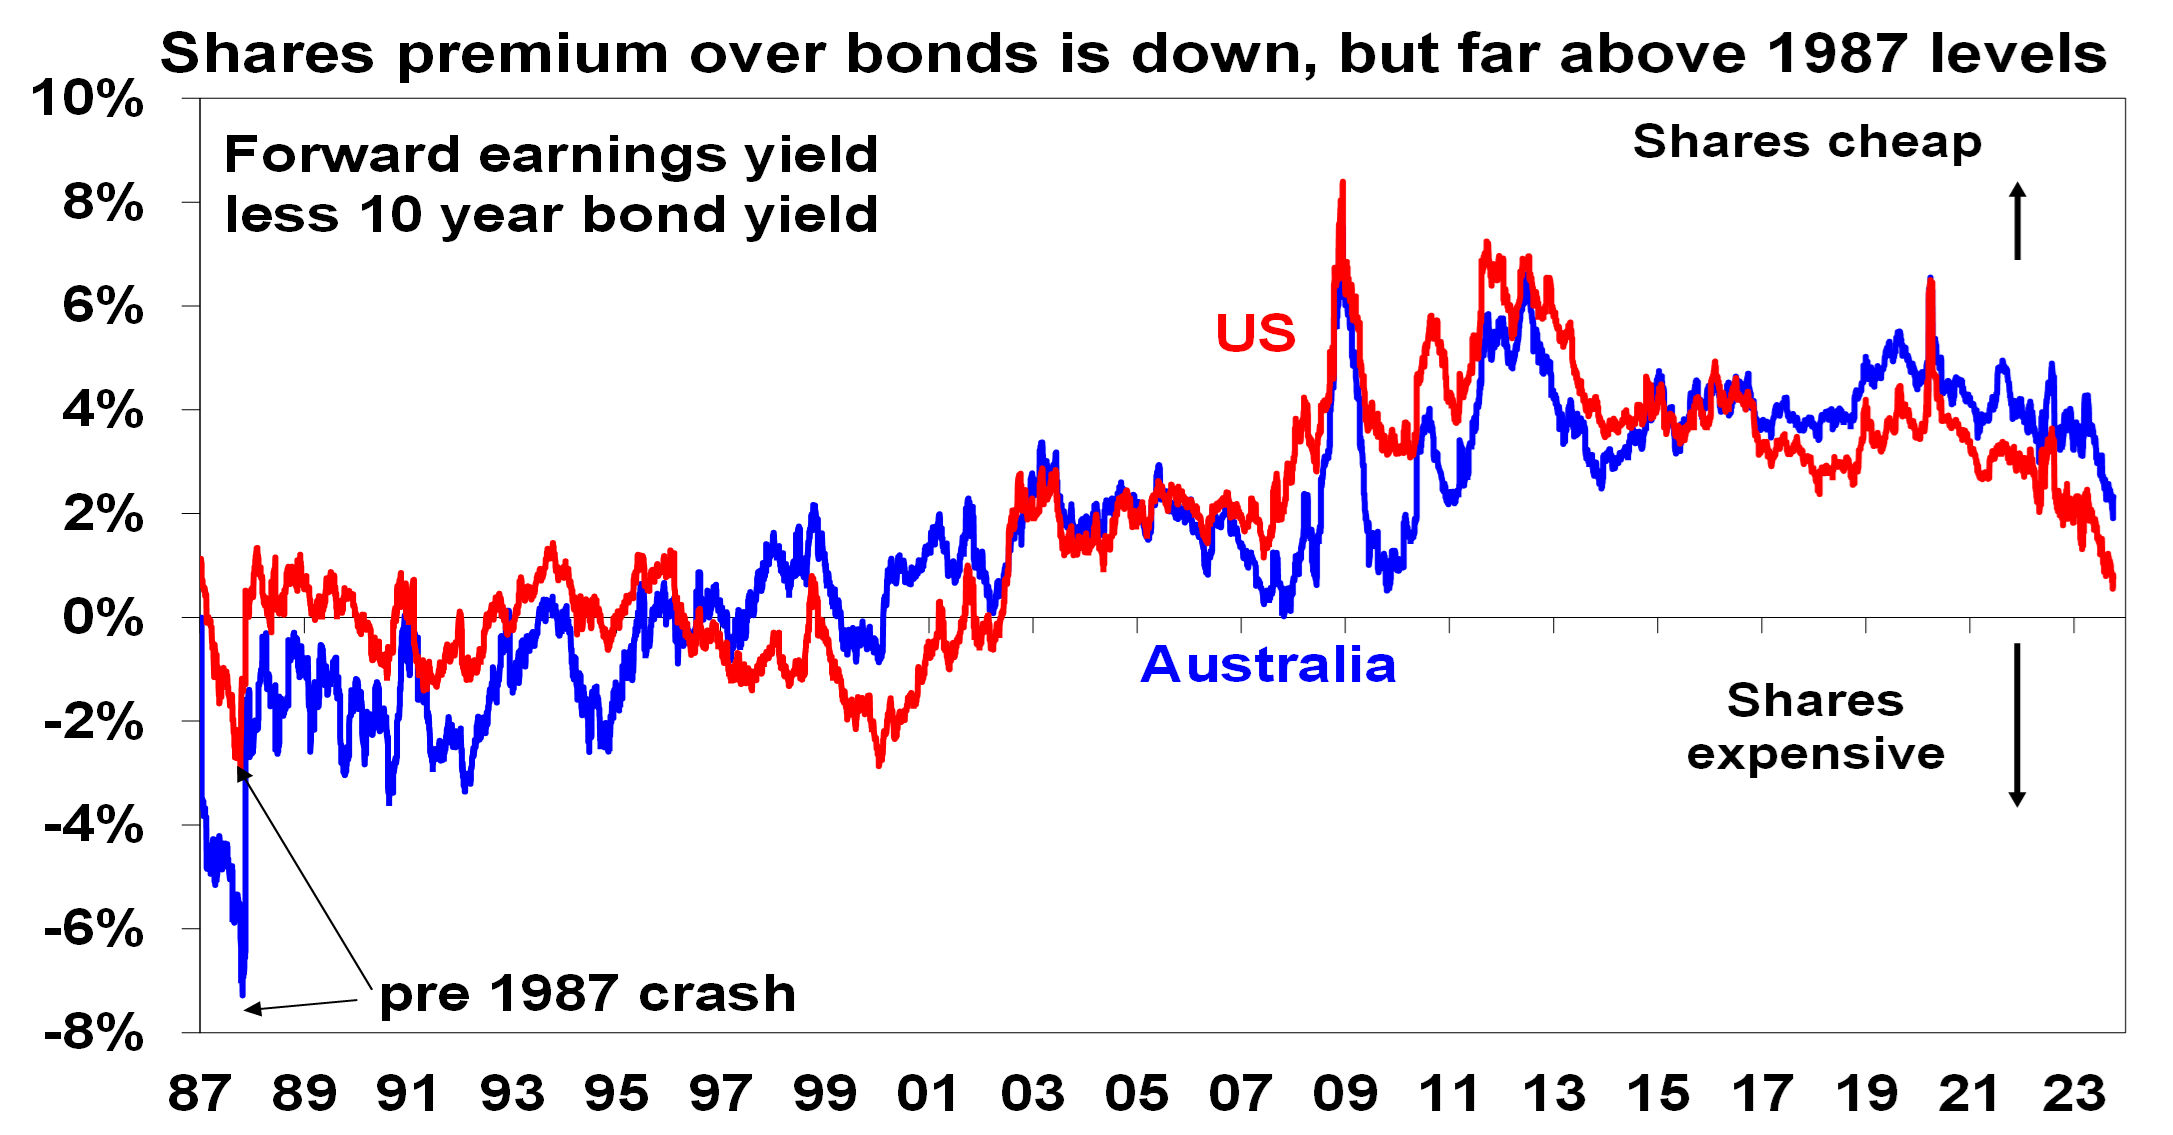
Source: Reuters, AMP
Feeding into the mix are another bunch of concerns including:
- the still high risk of recession in the US;
- sluggish growth in China and worries about its property sector;
- messy US politics with Republicans beholden to a small group of fiscal conservatives seeing the removal of the House Speaker, a high risk of a government shutdown next month & uncertainty over fiscal policy;
- a surge in oil prices on the back of production cuts by Saudi Arabia and Russia, with fears this will be made worse by war in Israel.
So far shares have been relatively resilient. However, the risk of further weakness remains. Naturally in times of uncertainty it’s tempting to look at past periods of major market falls. The GFC (which saw 50% or so falls) is still fresh but there has been no similar build up in risk in debt markets as there was with the US housing/subprime boom into 2007. Similarly, unlike the dot-com/tech boom of the late 1990s that led to the tech wreck (again with 50% or so falls in global shares) US tech stocks are now making good profits. But some do see parallels with the 1987 share crash.
1987 – what happened?
From mid-1982 to August/September 1987 global and Australian shares experienced a powerful bull market. This came on the back of recovery from the early 1980s recession and optimism about the economic de-regulation and reform of the 1980s and a re-rating of shares on the back of the move to lower inflation. By 1987 this had become very speculative and debt fuelled with Australian shares nearly doubling over the year to their September 1987 high on the back of strong gains in so-called entrepreneurial stocks (eg, Bond Corp and Qintex). Shares peaked in August/September 1987 and after a gradual drift lower plunged on 19 and 20 October, resulting in an ultimate top to bottom fall of 35% in US shares and 50% in Australian shares. It took the US share market just over two years to rise above its pre-crash highs but Australian shares did not get there until February 1994.
The precise causes of the 1987 crash have been subject to much debate. But the key driver appears to have been a combination of a 3% rise in US inflation, a 2 percentage point rise in US bond yields and Fed tightening hitting investor confidence at a time when shares were very overvalued after huge gains and investor confidence was unsustainably high.
The following tables provide a comparison of key indicators for US and Australian shares today with those of 1987.
US & Australian shares – 1987 v now
| US at Aug 87 peak | US now | Aust at Sept 87 peak | Aust now | |
| Prior 12 mth share gain, % | 36.4 | 19.6 | 88.4 | 8.5 |
| Prior 4 yr price gain, % pa | 20.3 | 7.4 | 34.0 | 1.6 |
| Forward PE, times * | 14.8 | 18.0 | 14.3 | 14.6 |
| 10 yr avg fwd PE, times | 11.4 | 18.0 | NA | 15.5 |
| Inflation, % | 4.1 | 3.6 | 8.5 | 5.2 |
| 10 year bond yld, % | 8.8 | 4.8 | 12.4 | 4.5 |
| Forward earnings yield less bond yield, % | -2.0 | 0.7 | -5.3 | 2.3 |
| Dividend yield, % | 2.6 | 1.5 | 2.5 | 4.3 |
| Dividend yield less infl, % | -1.5 | -2.1 | -6.0 | -0.9 |
* The forward PE is based on 12 mth ahead consensus earnings expectations. The forward earnings yield is the forward PE inverted. Source: Reuters, AMP
As in the months before the 1987 crash the Fed has been raising interest rates and bond yields have been moving higher. But over the last few months share markets have drifted down but remain relatively calm as occurred initially after the highs back in 1987. Fortunately, there are some big differences compared to 1987:
- shares have seen far smaller increases compared to the run-up to the 1987 crash - there has been no 1987 style euphoria;
- forward price to earnings ratios are higher than in 1987, particularly in the US, but inflation and bond yields are both lower such that the gap between forward earnings yields and bond yields is far more attractive than it was in 1987. See also the second chart in this note; and
- after the 1987 share market crash circuit breakers were built into the US stock market that close it down for a short period after a certain fall to help calm investors down.
However, while the lack of prior euphoria and more attractive valuations relative to bonds than in 1987 are positive signs, share markets are at risk of a further correction in the near term. The combination of the high risk of recession, uncertainty around the Chinese economy, US politics going from bad to worse with the removal of the House Speaker McCarthy and the threat posed by higher oil prices and renewed conflict in the Middle East all suggest the risk premium offered by shares over bonds should be higher than it is now, which in turn implies a high risk of more downside for share markets unless bond yields pull back sharply.
Investor sentiment has fallen sharply from the optimism seen mid-year when goldilocks was all the rage but it’s still not yet at the levels often associated with major market bottoms. See the next chart for the US. All of this suggests that the path of least resistance for shares may still be down in the short term. While valuations for the Australian share market are more attractive it would likely follow any further correction in US shares.
Based on surveys of individual investors, investment newsletter writers, option positioning and VIX. Source: Bloomberg, Sentimentrader, Investors Intelligence, AMP
How serious is the threat from the war in Israel?
The situation in Israel is terrible but the first thing to note is that this is not another re-run of the 1973 Arab Israeli war that saw many Arab countries against Israel and OPEC boycott oil supplies to the US which then saw oil prices rise fourfold at a time when oil demand was strong, which contributed to a severe recession. Today other Arab countries are on the sidelines with many having better relations with Israel and oil demand is weakening. However, the main risk would come if Iran, which backs Hamas, is drawn into the conflict which could threaten its production, the flow of oil through the Strait of Hormuz (through which 20% of world oil consumption flows) or even Saudi production (as Iran did in 2019).
So far, the market reaction to the conflict has been modest with shares little affected and oil prices up 4% but still below recent highs. If the conflict stays contained to Israel, the impact will be minimal. If not, then expect a bigger flow on to oil and hence petrol prices. 18 months ago, when oil prices surged into the Ukraine war consumers wore higher petrol prices because they had pent up demand and savings buffers after the lockdowns and monetary policy was easy and so higher oil prices just added to inflationary pressures. This time around it’s very different – the reopening boost is behind us, monetary policy is tight and household budgets are under severe strain so the rise in petrol prices is more likely to act as a tax on spending. Our estimate is that the average household weekly fuel bill is already up $12 since May. With stretched household budgets this means a further hit to consumer spending and less ability for companies to pass on price rises including from higher transport costs.
Some positives
Some things should help shares by year end – seasonality will start to become more positive; inflation is likely to continue to fall which should take pressure off central banks allowing them to start easing next year; and any recession is likely to be mild given the absence of excessive prior spending. That is why our 12-month view on shares remains positive.
Epilogue
As it turned out, the 1987 crash seemed to get forgotten about pretty quickly in 1988 – unless you were an Australian “entrepreneur” or an investor in one. The US, global and Australian economies did well with little impact from the share crash. And October 1987 now just looks like a blip in long term share prices. For many it was a great buying opportunity!

Oliver's insights - ineffective investors
22 October 2024 | Blog In the confusing and often seemingly illogical world of investing, investors often make various mistakes that keep them from reaching their financial goals. This note takes a look at the nine most common mistakes. Read more
Econosights - global housing trends
22 October 2024 | Blog The common belief that Australian homes have become unaffordable is understandable, as all the metrics around affordability have deteriorated. But how does the housing situation in Australia compare to our global peers? We go through this issue in this edition of Econosights. Read more
Weekly market update 18-10-2024
18 October 2024 | Blog Down down for global inflation and rates; soft Chinese data but better than feared; strong Australian jobs and the RBA; US earnings results; time for another baby bonus?; and more. Read moreWhat you need to know
While every care has been taken in the preparation of this article, neither National Mutual Funds Management Ltd (ABN 32 006 787 720, AFSL 234652) (NMFM), AMP Limited ABN 49 079 354 519 nor any other member of the AMP Group (AMP) makes any representations or warranties as to the accuracy or completeness of any statement in it including, without limitation, any forecasts. Past performance is not a reliable indicator of future performance. This document has been prepared for the purpose of providing general information, without taking account of any particular investor’s objectives, financial situation or needs. An investor should, before making any investment decisions, consider the appropriateness of the information in this document, and seek professional advice, having regard to the investor’s objectives, financial situation and needs. This article is solely for the use of the party to whom it is provided and must not be provided to any other person or entity without the express written consent AMP. This article is not intended for distribution or use in any jurisdiction where it would be contrary to applicable laws, regulations or directives and does not constitute a recommendation, offer, solicitation or invitation to invest.
The information on this page was current on the date the page was published. For up-to-date information, we refer you to the relevant product disclosure statement, target market determination and product updates available at amp.com.au.