

Key points
- The key drivers of expensive housing in Australia have been low interest rates and a chronic housing supply shortfall.
- Thankfully Australian governments are now focussing on boosting supply, but this will face various constraints and more effort needs to be put into decentralisation.
- The role of high immigration levels (now about 500,000 per annum) can’t be ignored. On our estimates it needs to be cut back to nearer 200,000 people a year to line up with building industry capacity & to reduce the supply shortfall.
Introduction
For years now there has been much discussion about poor housing affordability in Australia but debate about how immigration contributes to this issue is often lacking. For a country with abundant land, it’s ironic that housing affordability is so poor. Much of the focus has been on grants and other means to make it easier for first time buyers to get a loan or on rent subsidies. But of course, this just boosts demand making affordability worse. In recent times, there seems to be more recognition of constraints on the supply side. But surging immigration levels could easily overwhelm these efforts and lead to an even worse situation.
Australia’s surging population
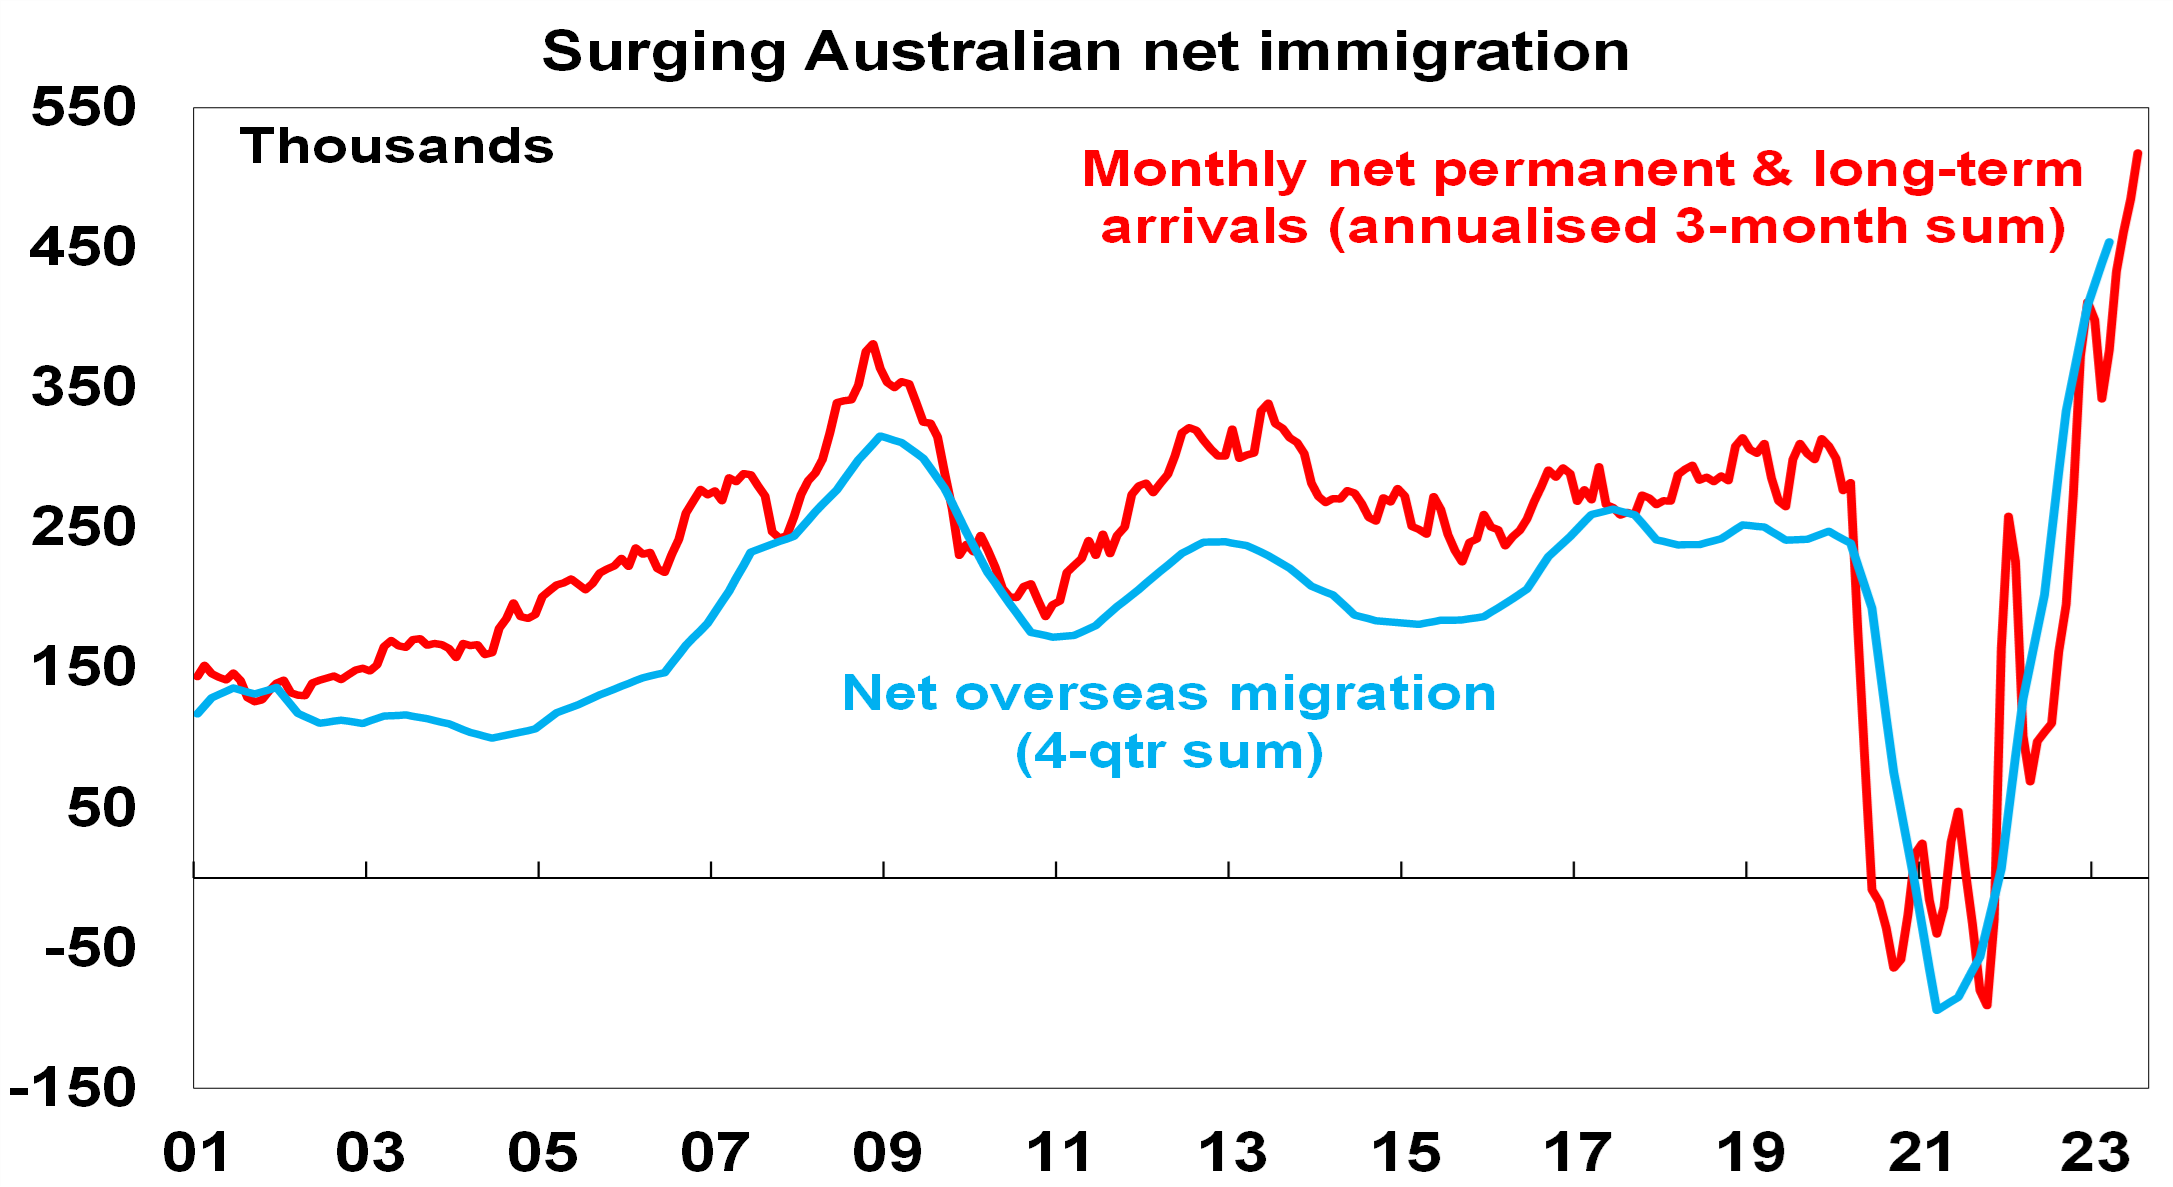
March quarter data showed that Australia’s population rose by 563,000 or 2.2% over 12 months, with 454,000 of that coming from immigration. Permanent and long-term arrival data up to July suggest that the surge in immigration is continuing and we are on track for net immigration of 500,000 or more in the last financial year.
Source: ABS, AMP
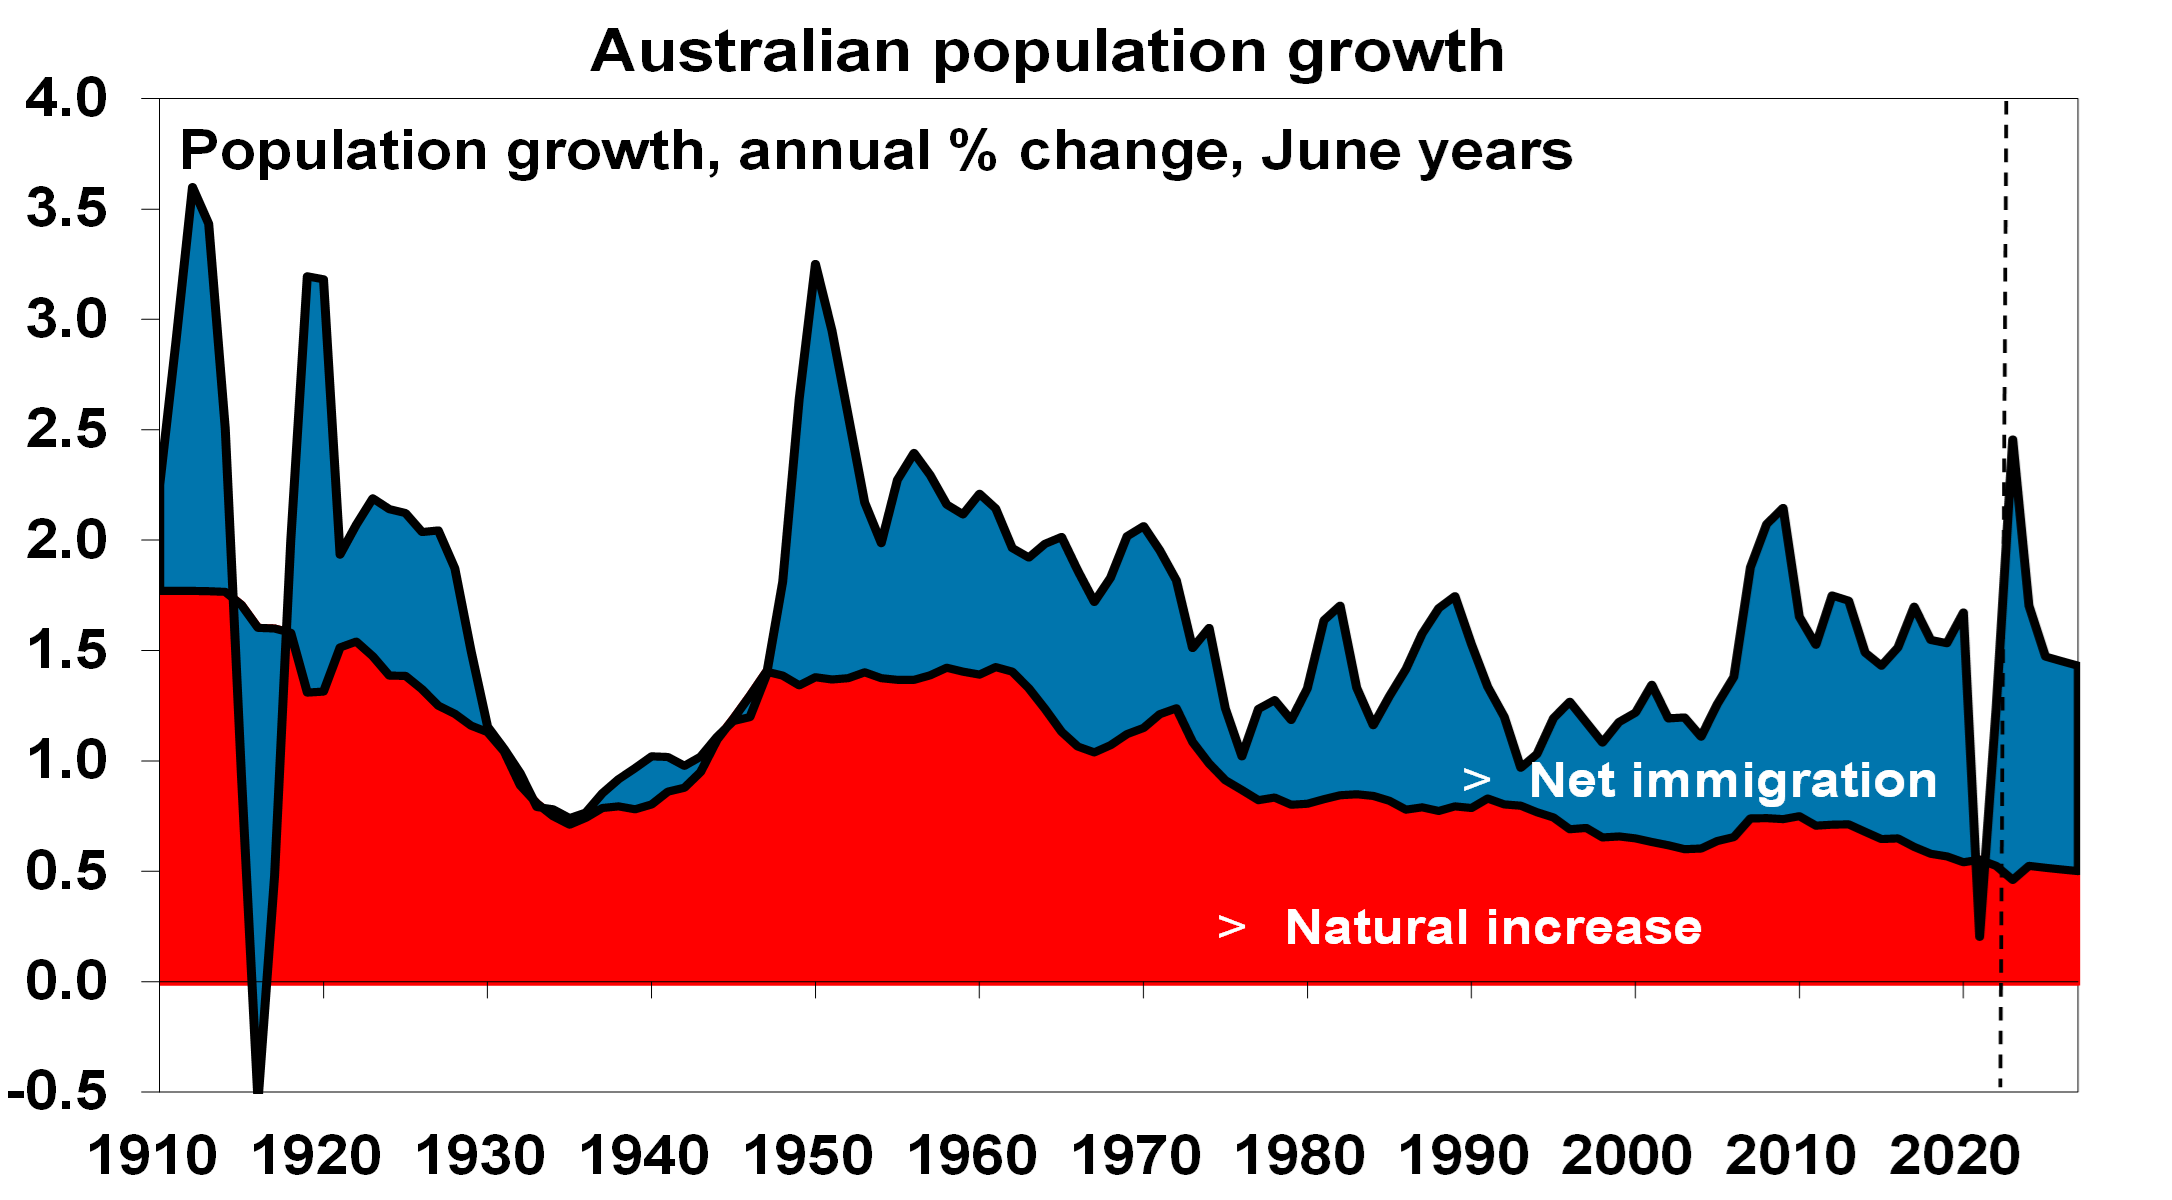
This would take population growth to 2.5% in 2022-23, its fastest since the 1950s. Note the next chart assumes net immigration falls to 315,000 this financial year and 260,000 thereafter as consistent with the May Budget projections, but budget immigration projections have been very unreliable. For example, net immigration for 2022-23 was projected to be 180,000 in the March 2022 Budget, 235,000 in the October 2022 Budget and 400,000 in the May Budget but now looks like 500,000 or more.
Source: RBA, ABS, AMP
Some of the surge is catch up after the pandemic slump. It will help boost GDP growth and immigration makes for a more dynamic economy. But what really counts for living standards is per capita GDP (and it’s going backwards) & surging immigration is making the housing shortage worse.
Poor housing affordability
At its core, housing affordability is determined by home prices, income levels, and interest rates. Whichever way you cut it housing affordability has deteriorated massively in recent decades.
- The ratio of home prices to wages and household income (which allows for the rise of two income families) has surged since the 1980s.
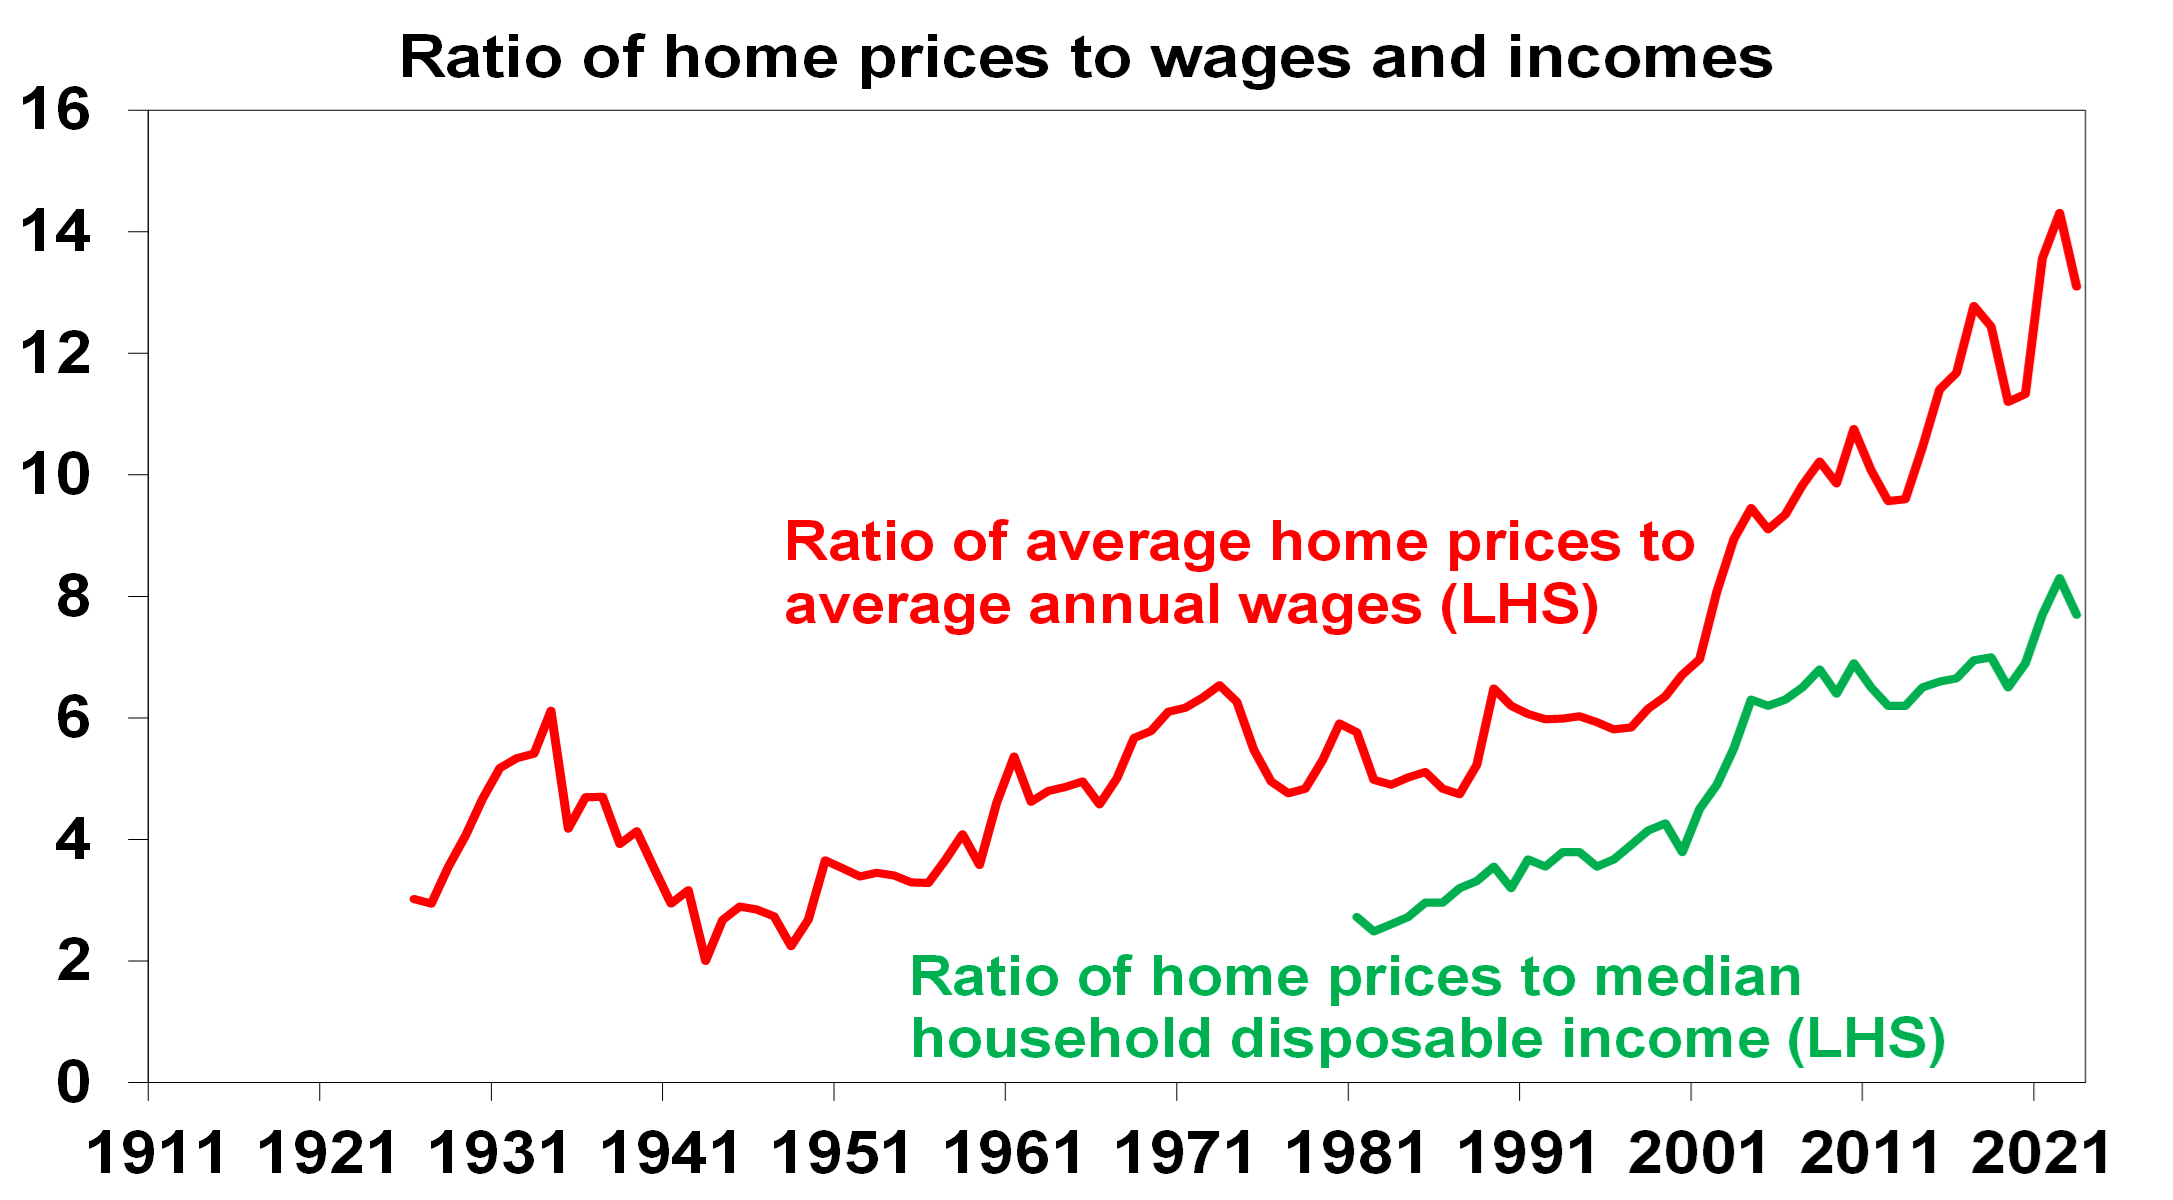
Source: ABS, CoreLogic, AMP
- According to the 2023 Dermographia Affordability Survey, the median multiple of house prices to income for major cities is 8.2 times in Australia versus around 5 times in the UK & US. In Sydney, it’s 13.3x!
- The share of mortgage interest as a share of household income is set to rise to record levels once current interest rates fully flow through.
- Since the mid-1990s, the time taken for someone on average full-time earnings to save a 20% deposit has doubled from about 5 years to 10.
Deteriorating housing affordability is something to be concerned about as it is driving increasing inequality and could threaten social cohesion.
Key drivers of poor housing affordability
The drivers of poor housing affordability have been subject to much debate. At times many zoom in on things like tax concessions for investors, SMSF buying and foreign demand. But investor and foreign demand were not big drivers of the surge in prices going into early 2022. Rather the fundamental drivers have been a combination of three things:
- The shift from high interest rates at the start of the 1990s to low interest rates along with the increased availability of debt has boosted borrowing ability and hence buyers’ capacity to pay for homes. But this can’t be the full story because lots of countries have had low interest rates without such expensive housing relative to incomes.
- Looking a bit deeper, there has been a fundamental failure of housing supply (for lots of reasons ranging from development controls to capacity constraints) to keep up with a surge in demand for housing that started in the mid-2000s with rapid population growth.
- The concentration of people in just a few coastal cities hasn’t helped.
The role of immigration in the demand/supply mismatch is critical.
Population growth and Australia’s housing shortfall
Starting in the mid-2000s annual population growth jumped by around 150,000 people on the back of a surge in net immigration levels – see the blue line in the next chart. This should have been matched by an increase in dwelling completions of around 60,000 per annum but there was no such rise in completions until after 2015 leading to a chronic undersupply of homes – see the red line. The unit building boom of the second half of last decade and the slump in population growth through the pandemic helped relieve the imbalance but the unit building boom was brief and a decline in household size from 2021 resulted in demand for an extra 120,000 dwellings on the RBA’s estimates. The rebound in population growth has taken the property market back into undersupply again.
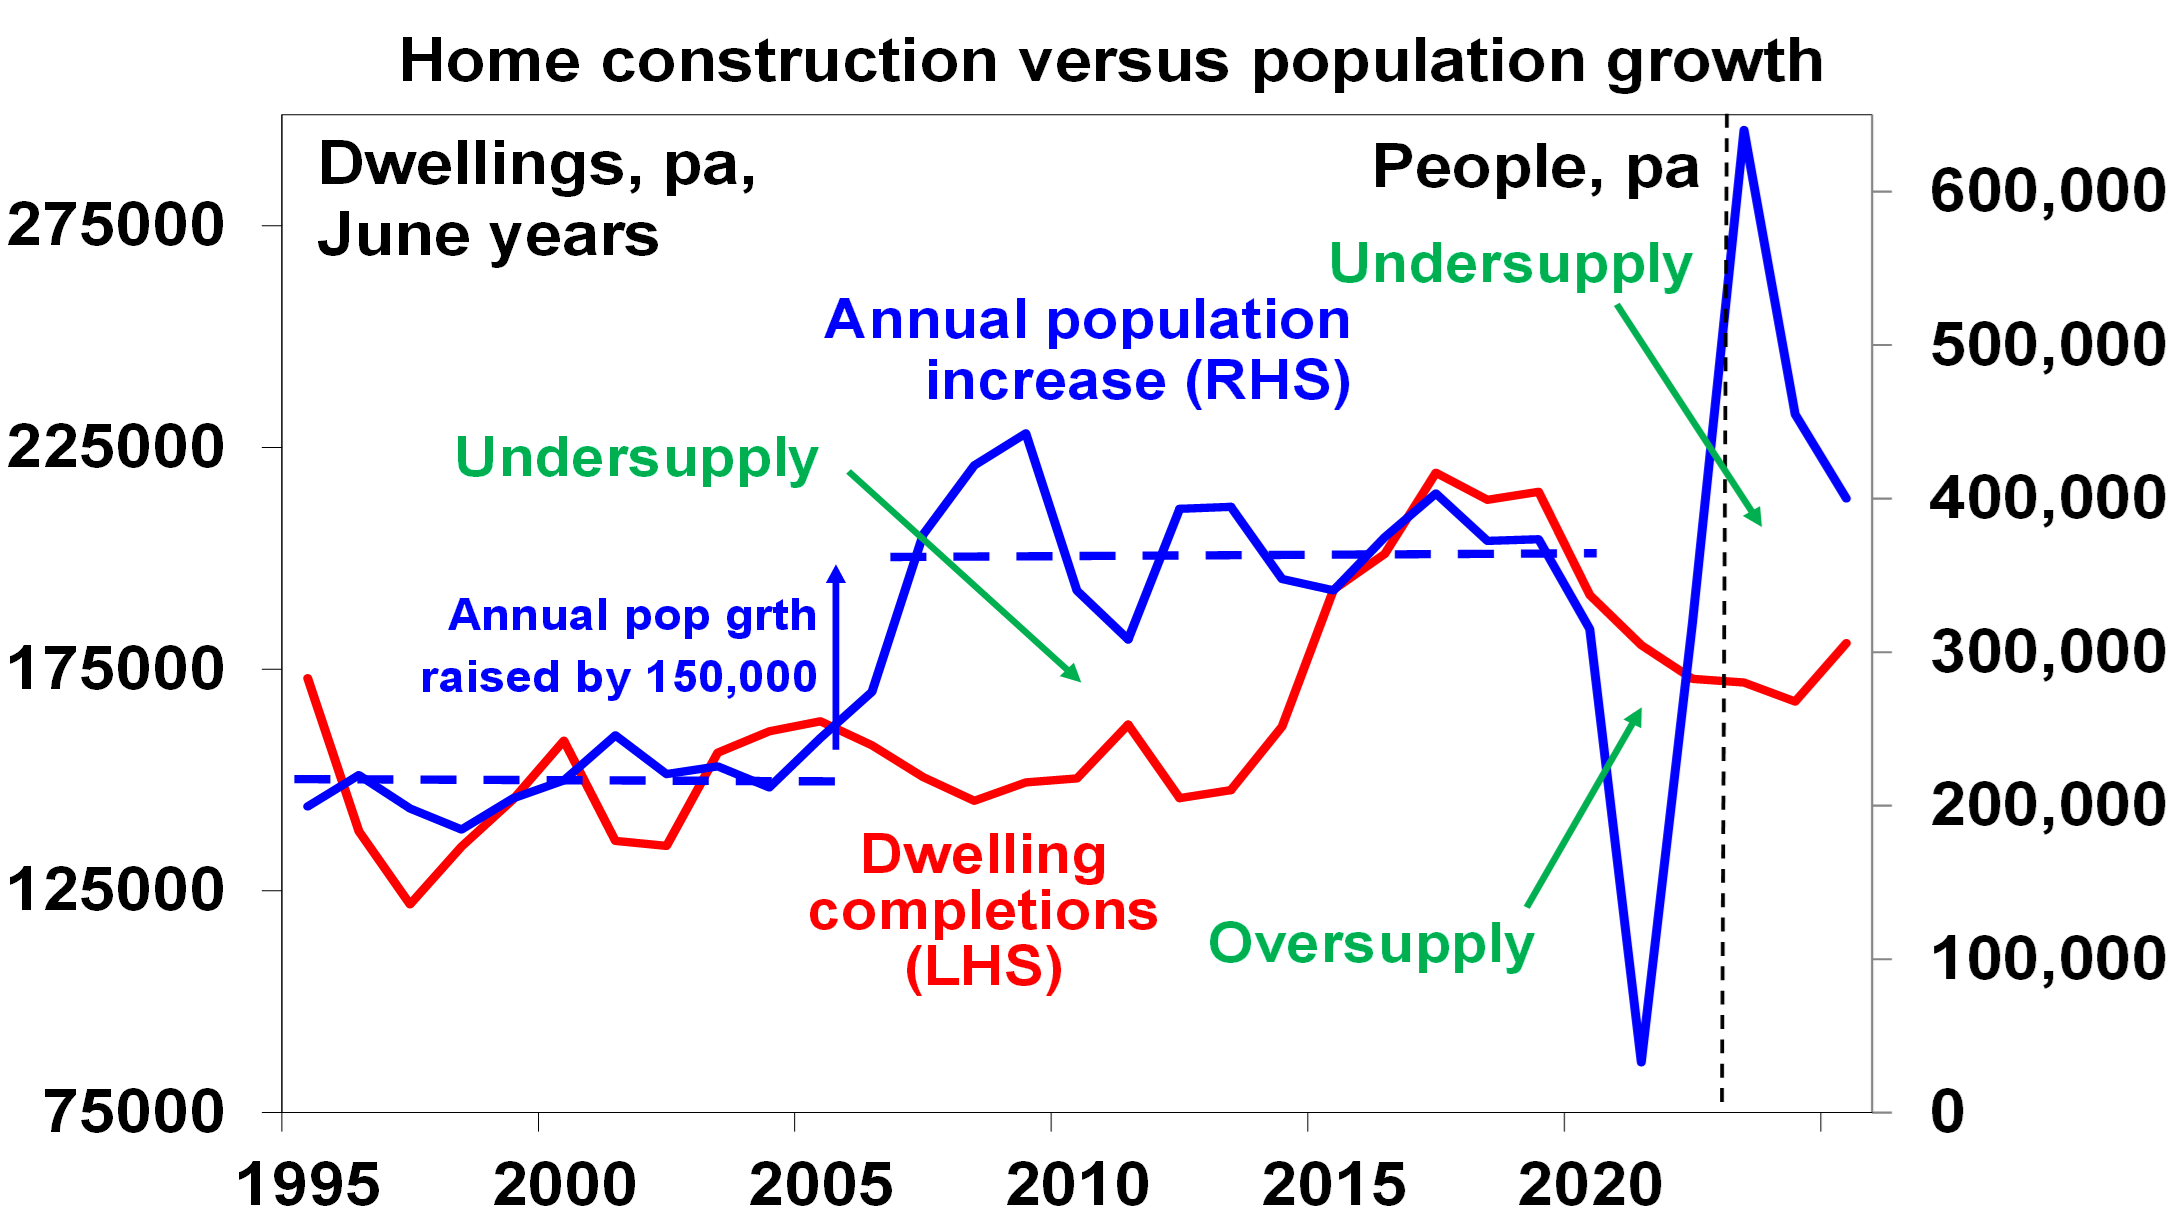
Source; ABS, AMP
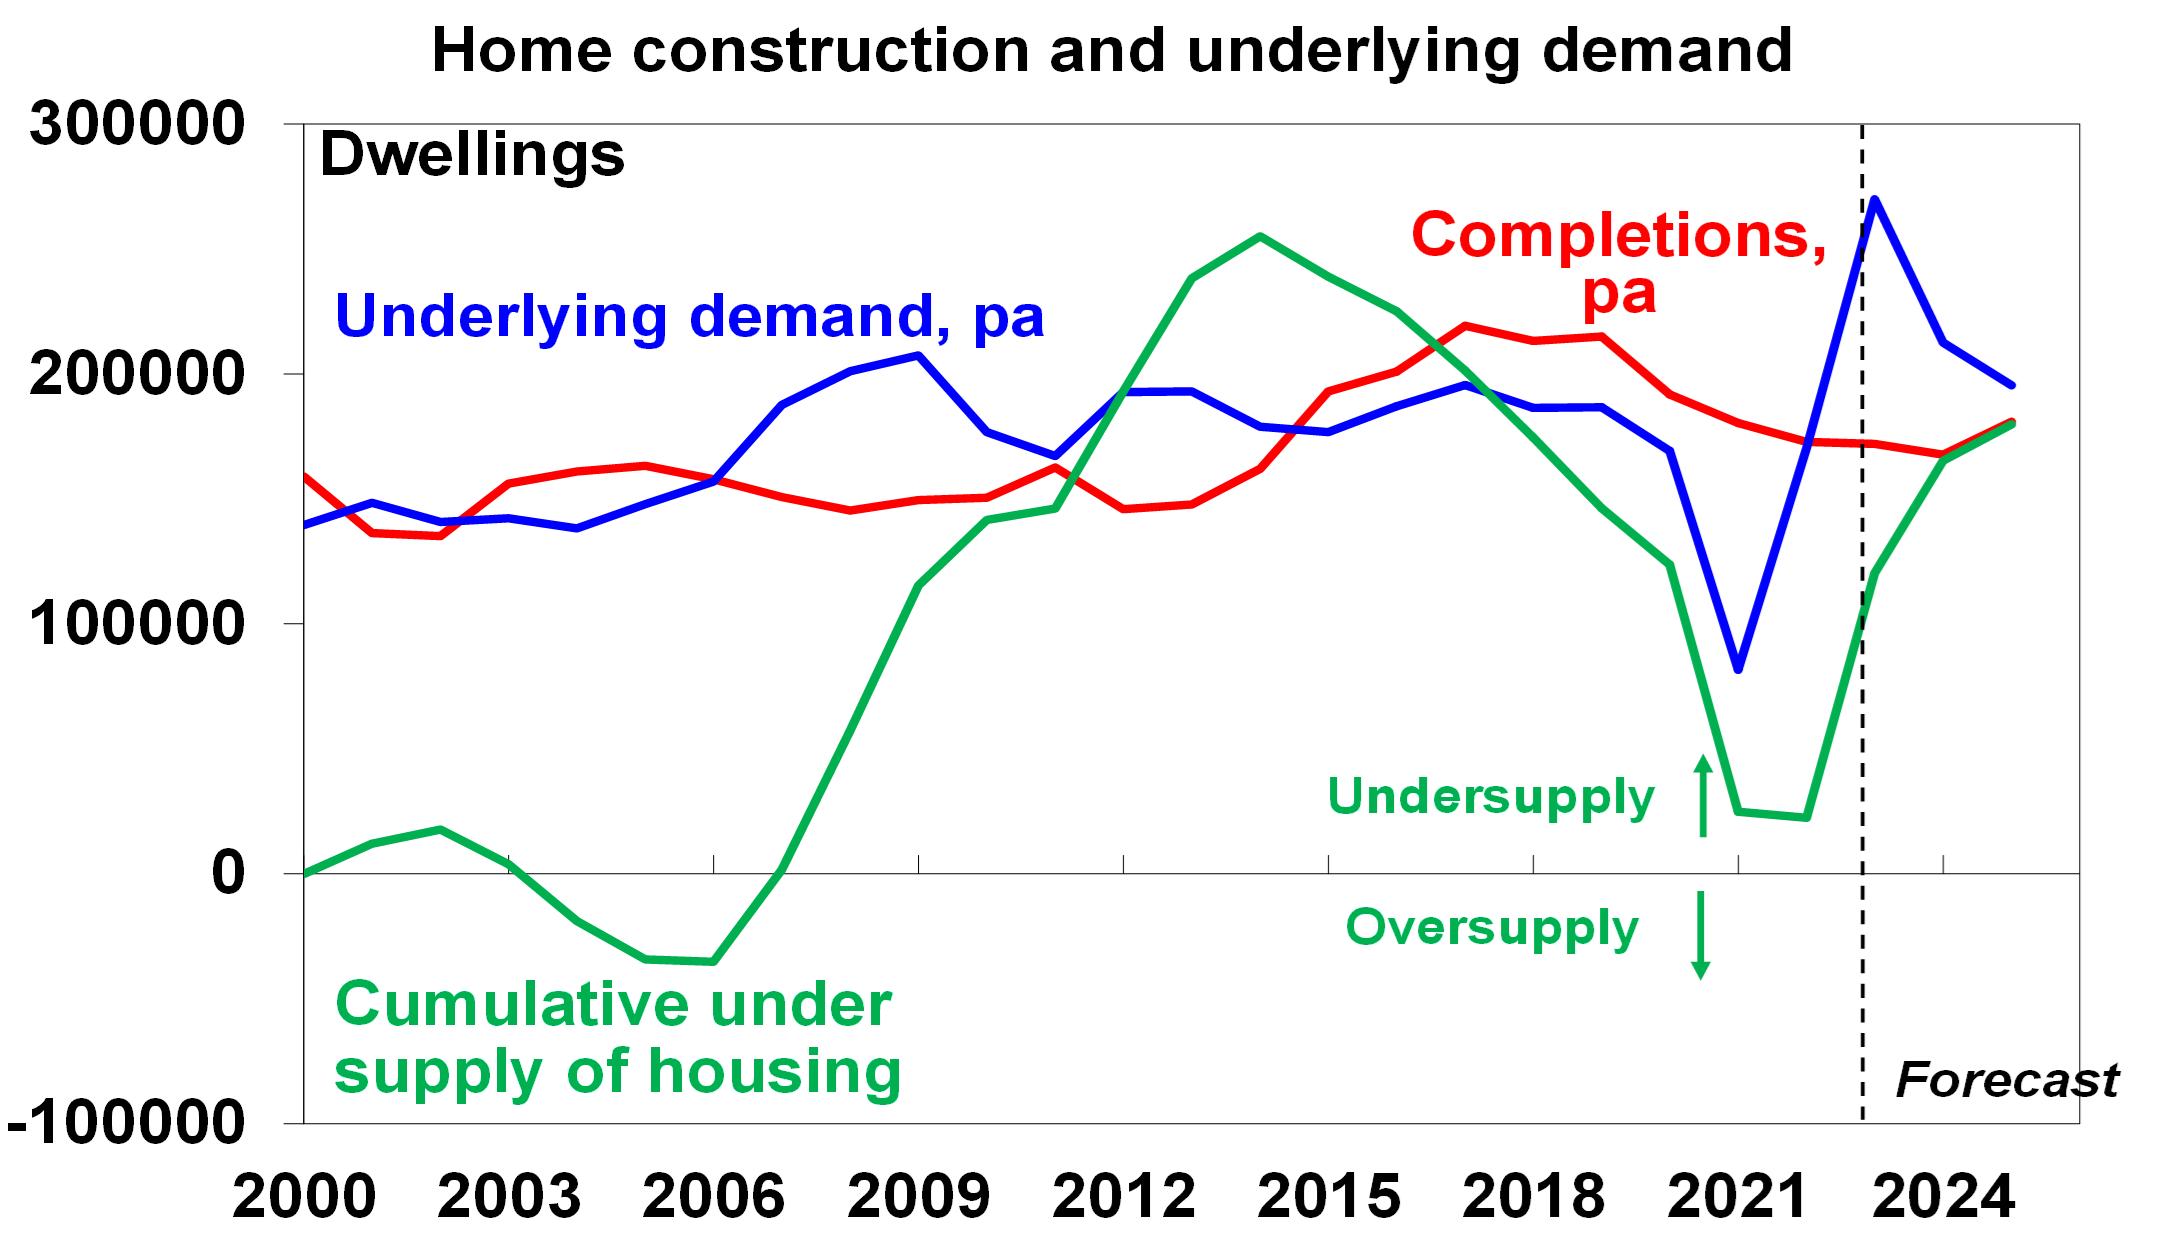
The next chart looks at this in terms of underling demand (blue line) and supply (red line) for homes and the cumulative undersupply gap between them (green line). Up until 2005 the housing market was in rough balance. It then went into a massive shortfall of about 250,000 dwellings by 2014 as underlying demand surged with booming immigration. This short fall was then cut into by the unit building boom and we nearly got back to balance in the pandemic. A rebound in underlying demand on the back of this year’s immigration surge and weak completions has now pushed the shortfall back up to 120,000 and by mid next year it will be around 165,000. This makes no allowance for the pandemic induced fall in household size which could take the shortfall up to around 285,000.
Meanwhile the surge in immigration has pushed underlying demand for homes to an average 220,000 dwellings over the three years to 2025. But thanks to rate hikes and capacity constraints dwelling completions look like averaging around 175,000 which means a new shortfall each year of about 45,000 dwellings adding to the already existing shortfall.
Source; ABS, AMP
The housing shortfall is confirmed by record low rental vacancy rates.
Housing supply
The good news is that Australian governments appear at last to be serious about focussing on supply as a key to improving housing affordability. The target to build 1.2 million new homes over five years from July 2024 (or 240,000 pa) - supported by 50,000 social and affordable homes over five years from the Housing Australia Future Fund and the National Housing Accord along with various programs to incentivise states to build more homes - are to be welcomed. Over the five years to 2022 Australia built nearly one million new homes (or 200,000 pa) mostly in the private sector but we need a stretch target to solve the housing affordability issue given a shortfall of 165,000 to 285,000 dwellings by mid next year. However, this is not going to be easy. First, despite a backlog of approvals yet to be completed we are struggling to complete 180,000 dwellings pa with labour and material shortages and regular failures amongst homebuilders. We may be able to get this back up to 200,000 pa with more units/lower cost housing in the mix (like late last decade) but it’s hard to see where the capacity is going to come from to get to 240,000 dwellings a year.
Secondly, similarly albeit less ambitious supply side commitments in the past have failed. And finally, as noted, the surge in immigration is adding to the already large supply shortfall and threatening to swamp the extra supply commitments governments are making.
Immigration levels need to be lower
There are a lot of things that need to be done to improve housing affordability: making it easier to build more homes but in a way that does not lead to ever worsening urban congestion and compromise the very things that make Australia great (yes like many Australians I admit to being a NIMBY); encouraging greater decentralisation to regional Australia to take pressure off cities; and tax reform in terms of replacing stamp duty with land tax and reducing the capital gains tax discount. But it's impossible to escape the conclusion that immigration levels need to be calibrated to the ability of the home building industry to supply housing. This is critical. Current immigration levels are running well in excess of the ability of the housing industry to supply enough homes exacerbating an acute housing shortage and poor housing affordability.
Our rough estimate is that if home building supply capacity is 200,000 dwellings a year (as we managed in the five years to 2022) then immigration levels need to be cut back to 260,000 from around 500,000 now. But if capacity is just 180,000 dwellings pa or we want to reduce the accumulated supply shortfall by say 20,000 dwellings a year then immigration should be cut back to near 200,000 people a year.

Weekly market update 26-07-2024
26 July 2024 | Blog Dr Shane Oliver discusses the risk off as tech hit continues; correction risks into August/September; global rate cutting cycle underway; Australian June quarter CPI to rise but the hurdle to another RBA rate hike should be high; and more. Read more
Oliver's insights - rise of populism and bigger government
24 July 2024 | Blog This article takes a look at the rise of populism and what it means for economic policies and investors. Read more
Weekly market update 19-07-2024
19 July 2024 | Blog This week shares are down; US election/Trump prospects starting to impact; global rates easing cycle on track; China Plenum; Australian jobs still tight but easing so RBA needs to be careful; and more. Read moreWhat you need to know
While every care has been taken in the preparation of this article, neither National Mutual Funds Management Ltd (ABN 32 006 787 720, AFSL 234652) (NMFM), AMP Limited ABN 49 079 354 519 nor any other member of the AMP Group (AMP) makes any representations or warranties as to the accuracy or completeness of any statement in it including, without limitation, any forecasts. Past performance is not a reliable indicator of future performance. This document has been prepared for the purpose of providing general information, without taking account of any particular investor’s objectives, financial situation or needs. An investor should, before making any investment decisions, consider the appropriateness of the information in this document, and seek professional advice, having regard to the investor’s objectives, financial situation and needs. This article is solely for the use of the party to whom it is provided and must not be provided to any other person or entity without the express written consent AMP. This article is not intended for distribution or use in any jurisdiction where it would be contrary to applicable laws, regulations or directives and does not constitute a recommendation, offer, solicitation or invitation to invest.
The information on this page was current on the date the page was published. For up-to-date information, we refer you to the relevant product disclosure statement, target market determination and product updates available at amp.com.au.