Key points
- Australian national average home prices fell another 1% in November and are now down by 6.9% from their high, having seen their steepest fall in the last forty years.
- Rising mortgage rates are the main driver of the slump and there is likely more to go. Since April a buyer on average full-time earnings with a 20% deposit has seen a 25% decline in their home buying power.
- While the time taken to save a 20% deposit to buy a home in Australia has fallen, it’s still double mid-1990s levels.
- We continue to expect a 15-20% top to bottom fall in home prices out to the September quarter next year, as the full impact of rate hikes flows through and as economic conditions slow sharply into next year resulting in rising unemployment, followed by a gradual recovery.
The slump in home prices continues
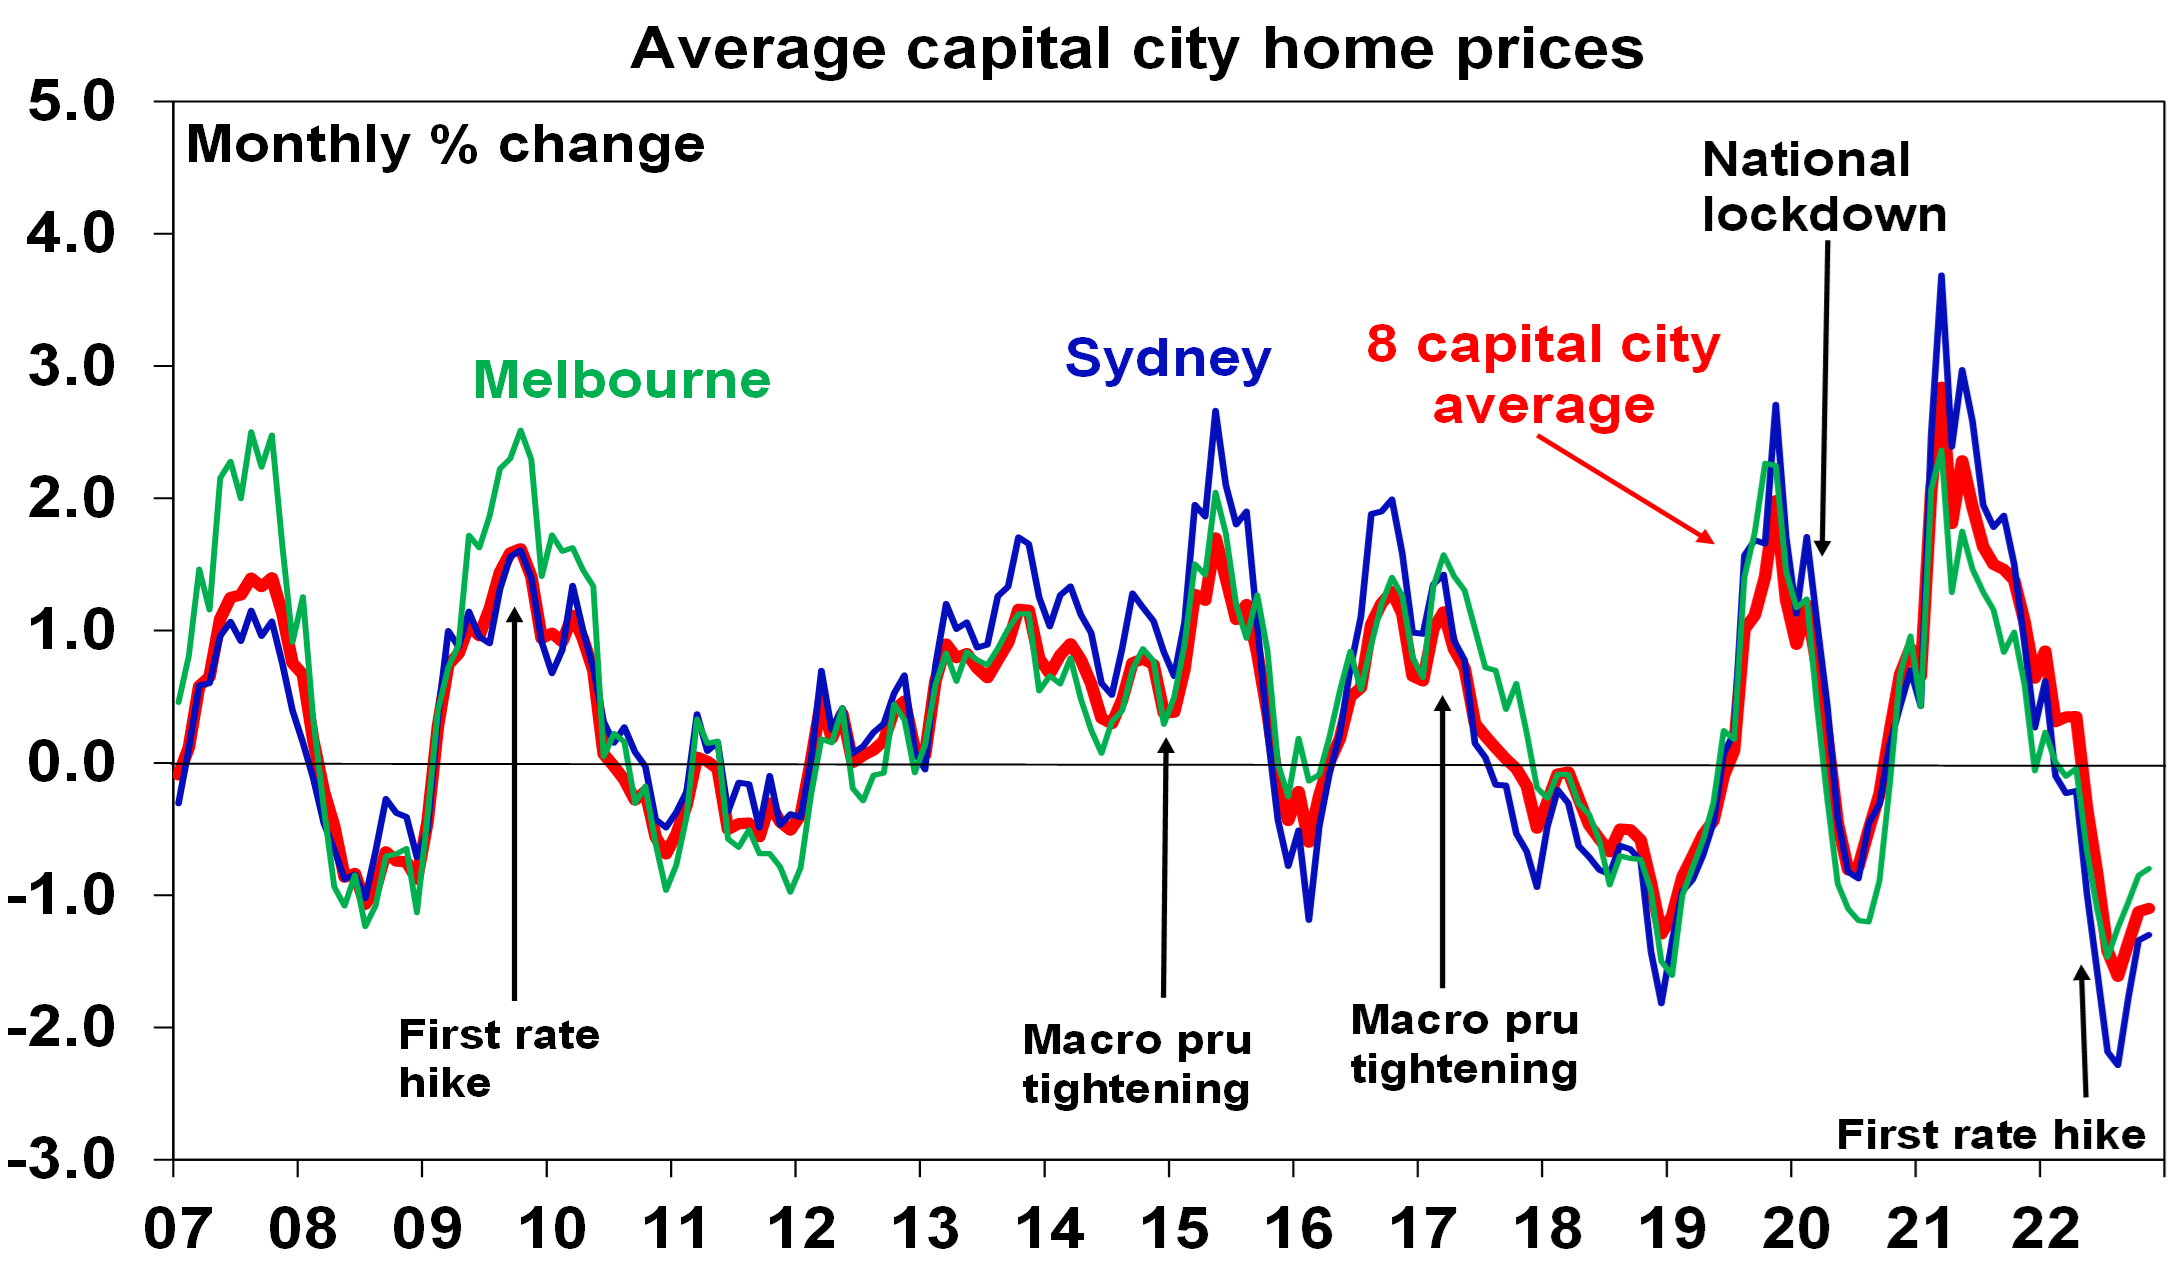
After surging by 28.6% from their pandemic lows early this year to record highs on the back of record low interest rates, home prices are continuing to plunge on the back of the fastest surge in interest rates since the early 1990s. Australian capital city average dwelling prices fell another 1.1% in November according to CoreLogic, making it their seventh monthly decline in a row. Including regional dwellings, which fell another 0.9%, national dwelling prices fell 1%. Perth and Darwin remain relatively resilient as they are still getting over their post mining boom slumps.
House prices are continuing to fall faster than unit prices, reflecting the much stronger boom in house prices and as unit prices are relatively supported by better affordability and tight rental markets.
Australian dwelling price growth, to November
| Nov % chg | Annual % chg | % chg v high | |
| Sydney | -1.3 | -10.6 | -11.4 |
| Melbourne | -0.8 | -7.0 | -7.1 |
| Brisbane | -2.0 | 3.3 | -8.1 |
| Adelaide | -0.3 | 13.4 | -0.9 |
| Perth | 0.0 | 3.9 | -0.7 |
| Hobart | -2.0 | -4.1 | -7.6 |
| Darwin | 0.2 | 5.5 | -0.7 |
| Canberra | -1.2 | -1.3 | -6.5 |
| Capital city avg | -1.1 | -5.2 | -7.5 |
| Regional avg | -0.9 | 3.3 | -5.7 |
| National avg | -1.0 | -3.2 | -6.9 |
Source: CoreLogic, AMP
The key drivers of the downturn remain: poor affordability; rising mortgage rates; a rotation in spending from goods, including houses back to services; cost of living pressures, making it even harder to save for a deposit; and poor homebuyer confidence. Rising mortgage rates are the biggest driver of the slump as the surge in fixed mortgage rates, that started last year, and then variable rates has substantially reduced the amount new home buyers can borrow and hence pay for a home.
While the pace of monthly price declines has slowed in some cities, including the national average, this likely reflects the market getting used to the initial shock of rate hikes, bargain hunters taking advantage of lower prices and vendors holding off selling. Auction clearance rates also remain up from a low of around 50%, albeit in recent months they have stalled around 60% and volumes remain low.
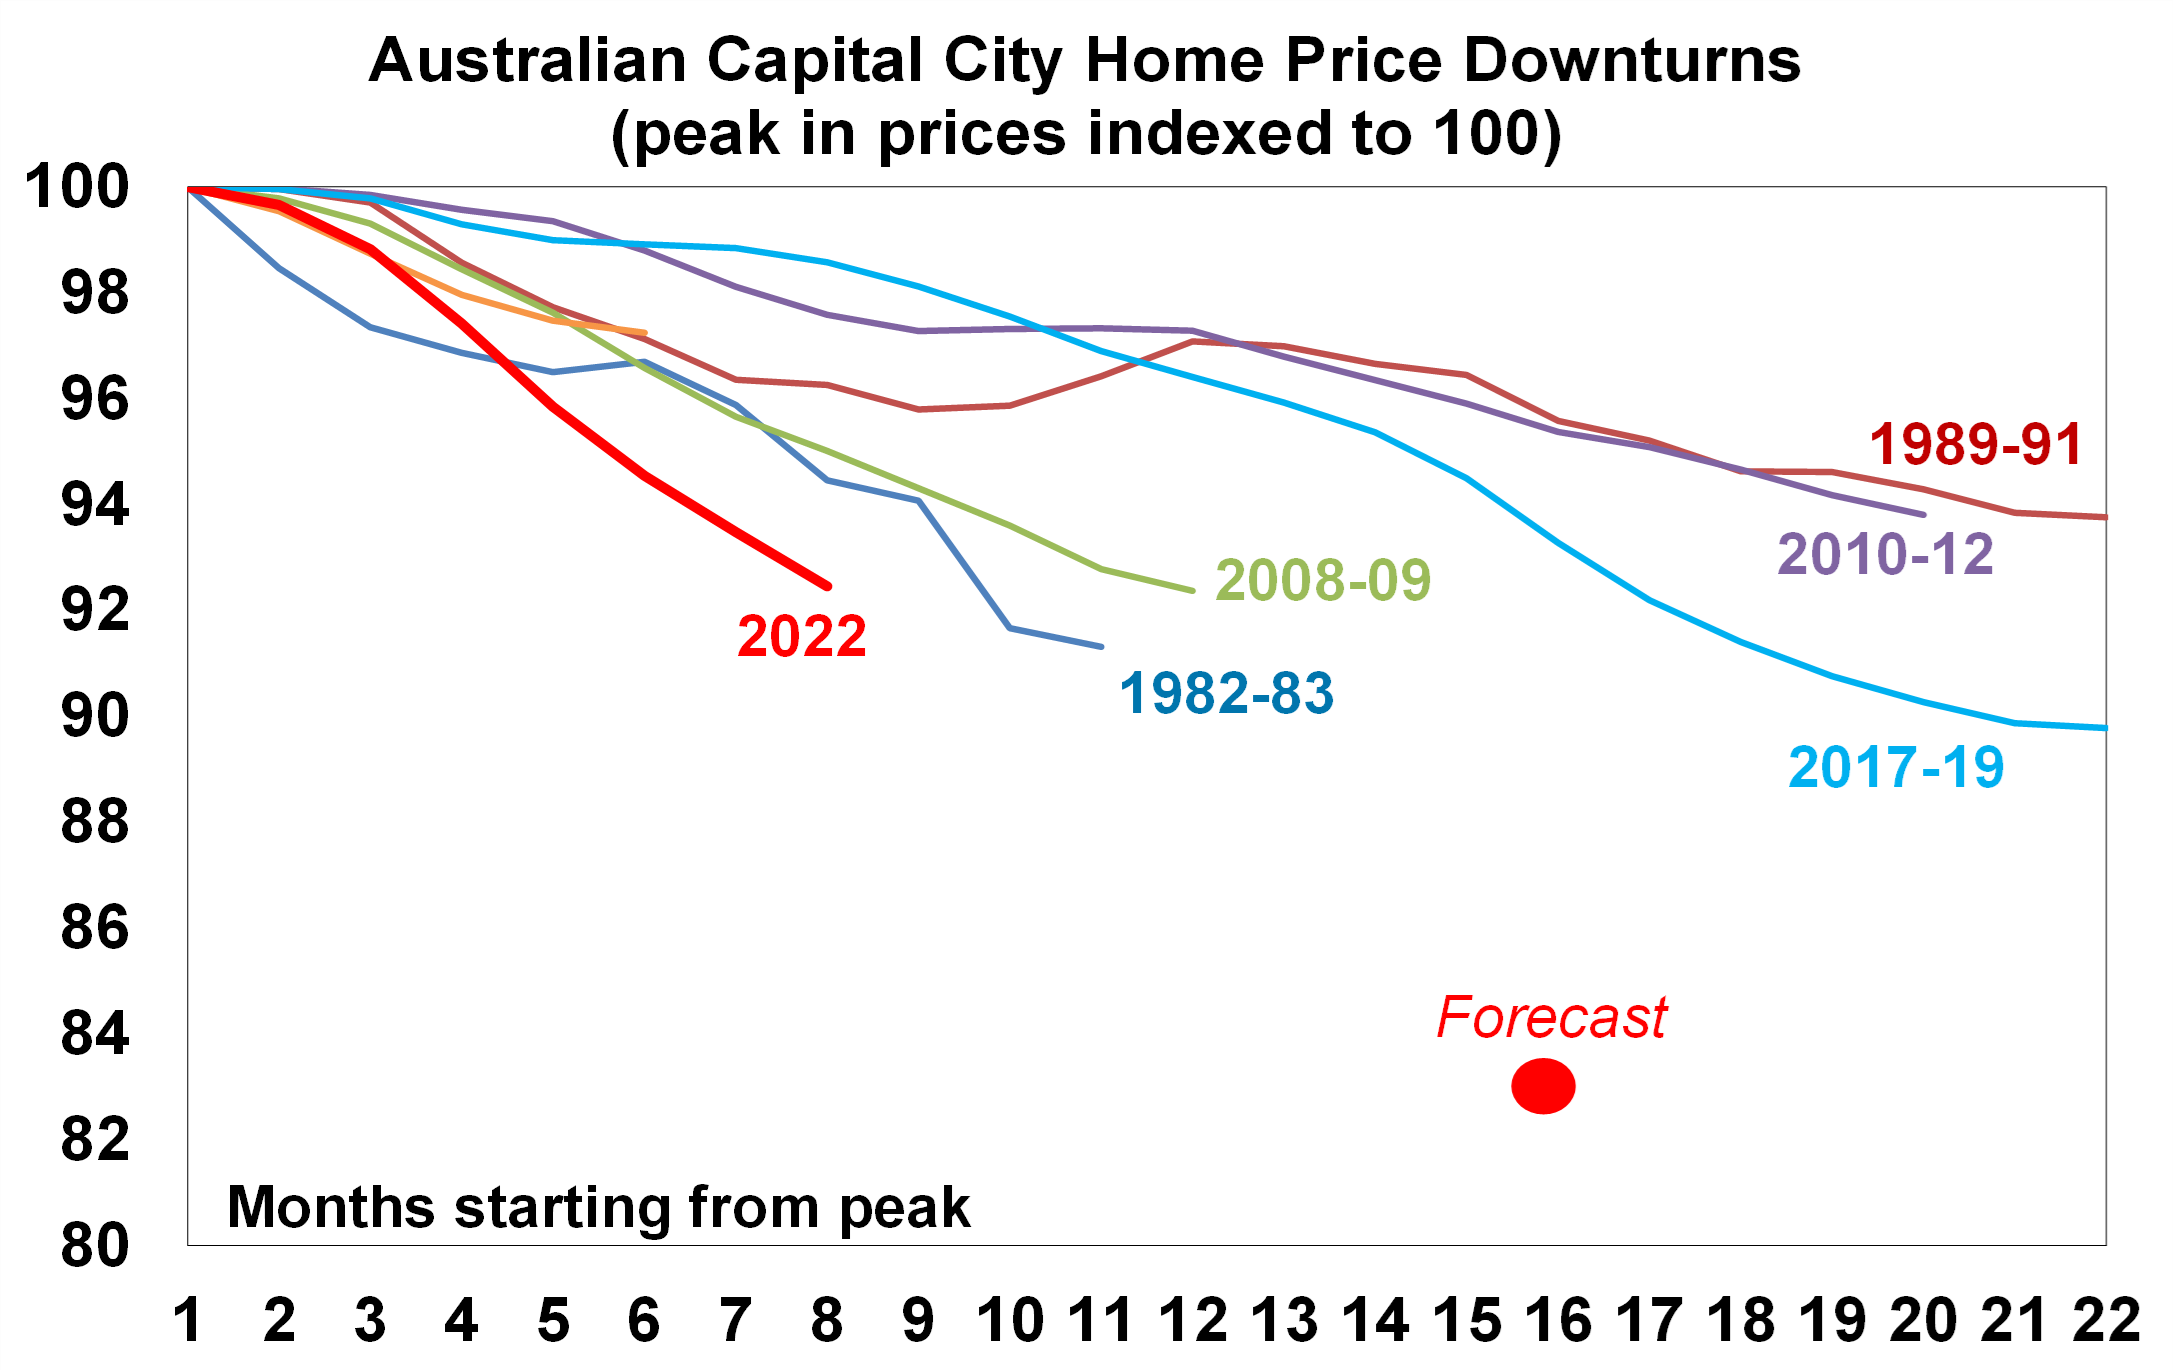
But with the full impact of rate hikes yet to be felt, interest rates still rising and the economy set to weaken, the slowdown in price falls in some cities is unlikely to presage an imminent bottoming in home prices. Past periods of property price falls experienced a few gyrations in the pace of price declines before prices ultimately bottomed, eg in the 2017-19 down cycle. See the next chart.
Source: CoreLogic, AMP
So far national average property prices are down 6.9% from their high and average capital city home prices are down 7.5% both over seven months. This is the fastest pace of decline on CoreLogic records going back to 1980. The rapidity of the decline likely reflects the de facto tightening that started with rising fixed mortgage rates a year ago, the speed of RBA cash rate hikes (the fastest since 1994) and heightened sensitivity to rising rates due to high debt levels, along with the extent of the prior boom.
Source: CoreLogic, AMP
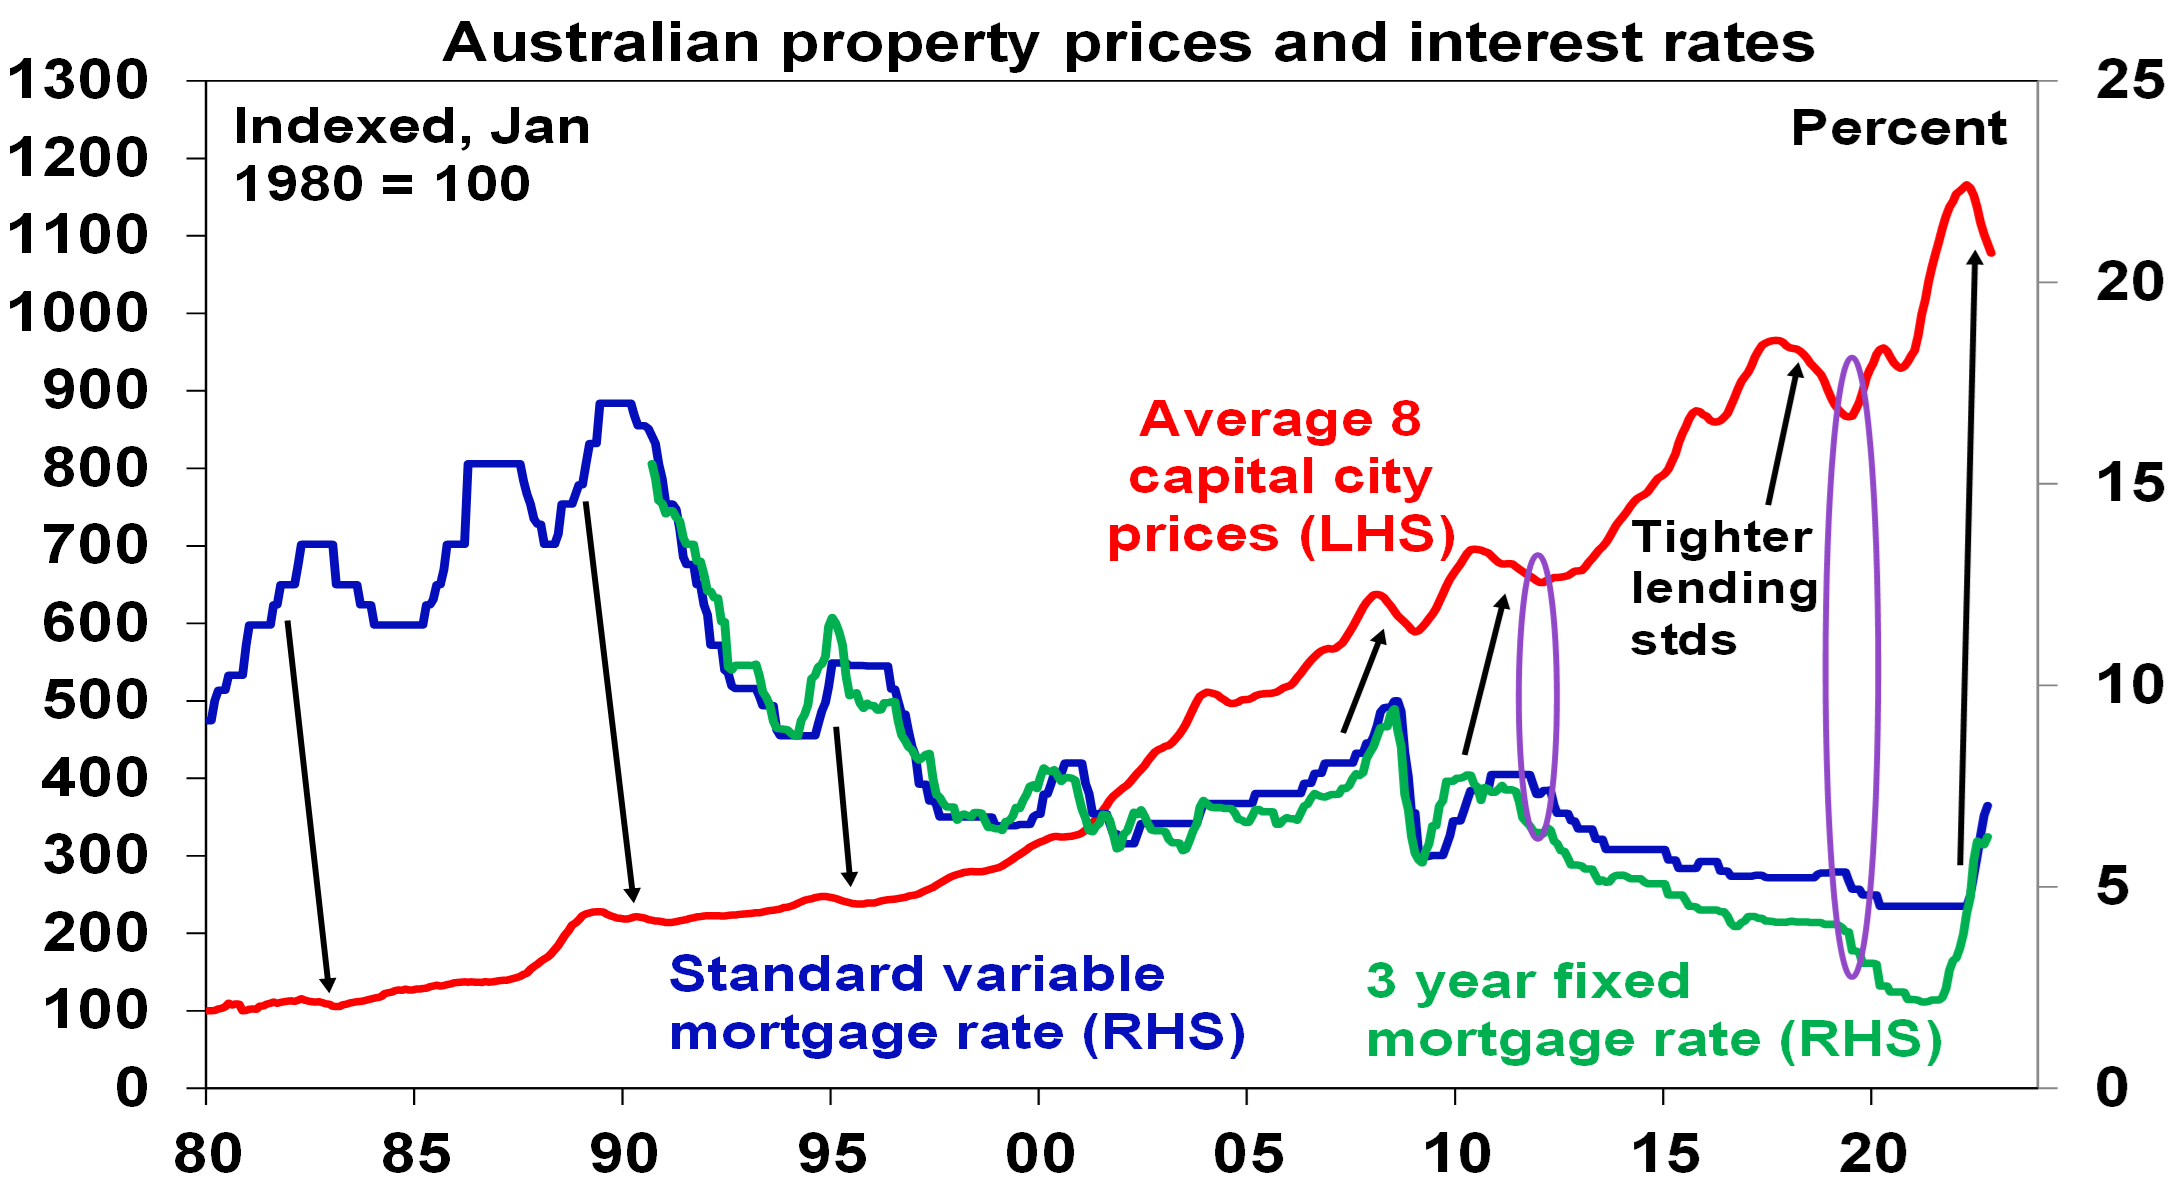
Of course, average home price levels have still only seen a flick off the top after a huge boom. See the next chart.
Source: CoreLogic, AMP
Outlook – we continue to expect average property prices to have a top to bottom fall of 15 to 20%
We expect average property prices to fall further into second half 2023 as rate hikes continue to flow through and economic conditions deteriorate:
- the full impact of variable rate hikes has yet to be fully felt as it takes 2-3 months for RBA hikes to show up in actual mortgage payments;
- we are expecting another 0.25% hike this month with the risk of another 0.25% in February and the money market is still expecting the cash rate to be raised to near 4% (from 2.85% currently);
- two thirds of the 40% of households with a mortgage on fixed rates will see their mortgage rate reset from around 2% to around 5 or 6% by the end of next year. This is likely to result in a sharp rise in mortgage stress – this is the so called “fixed mortgage rate cliff”;
- economic conditions are set to deteriorate next year as weaker global growth and rate hikes slow the economy & push up unemployment.
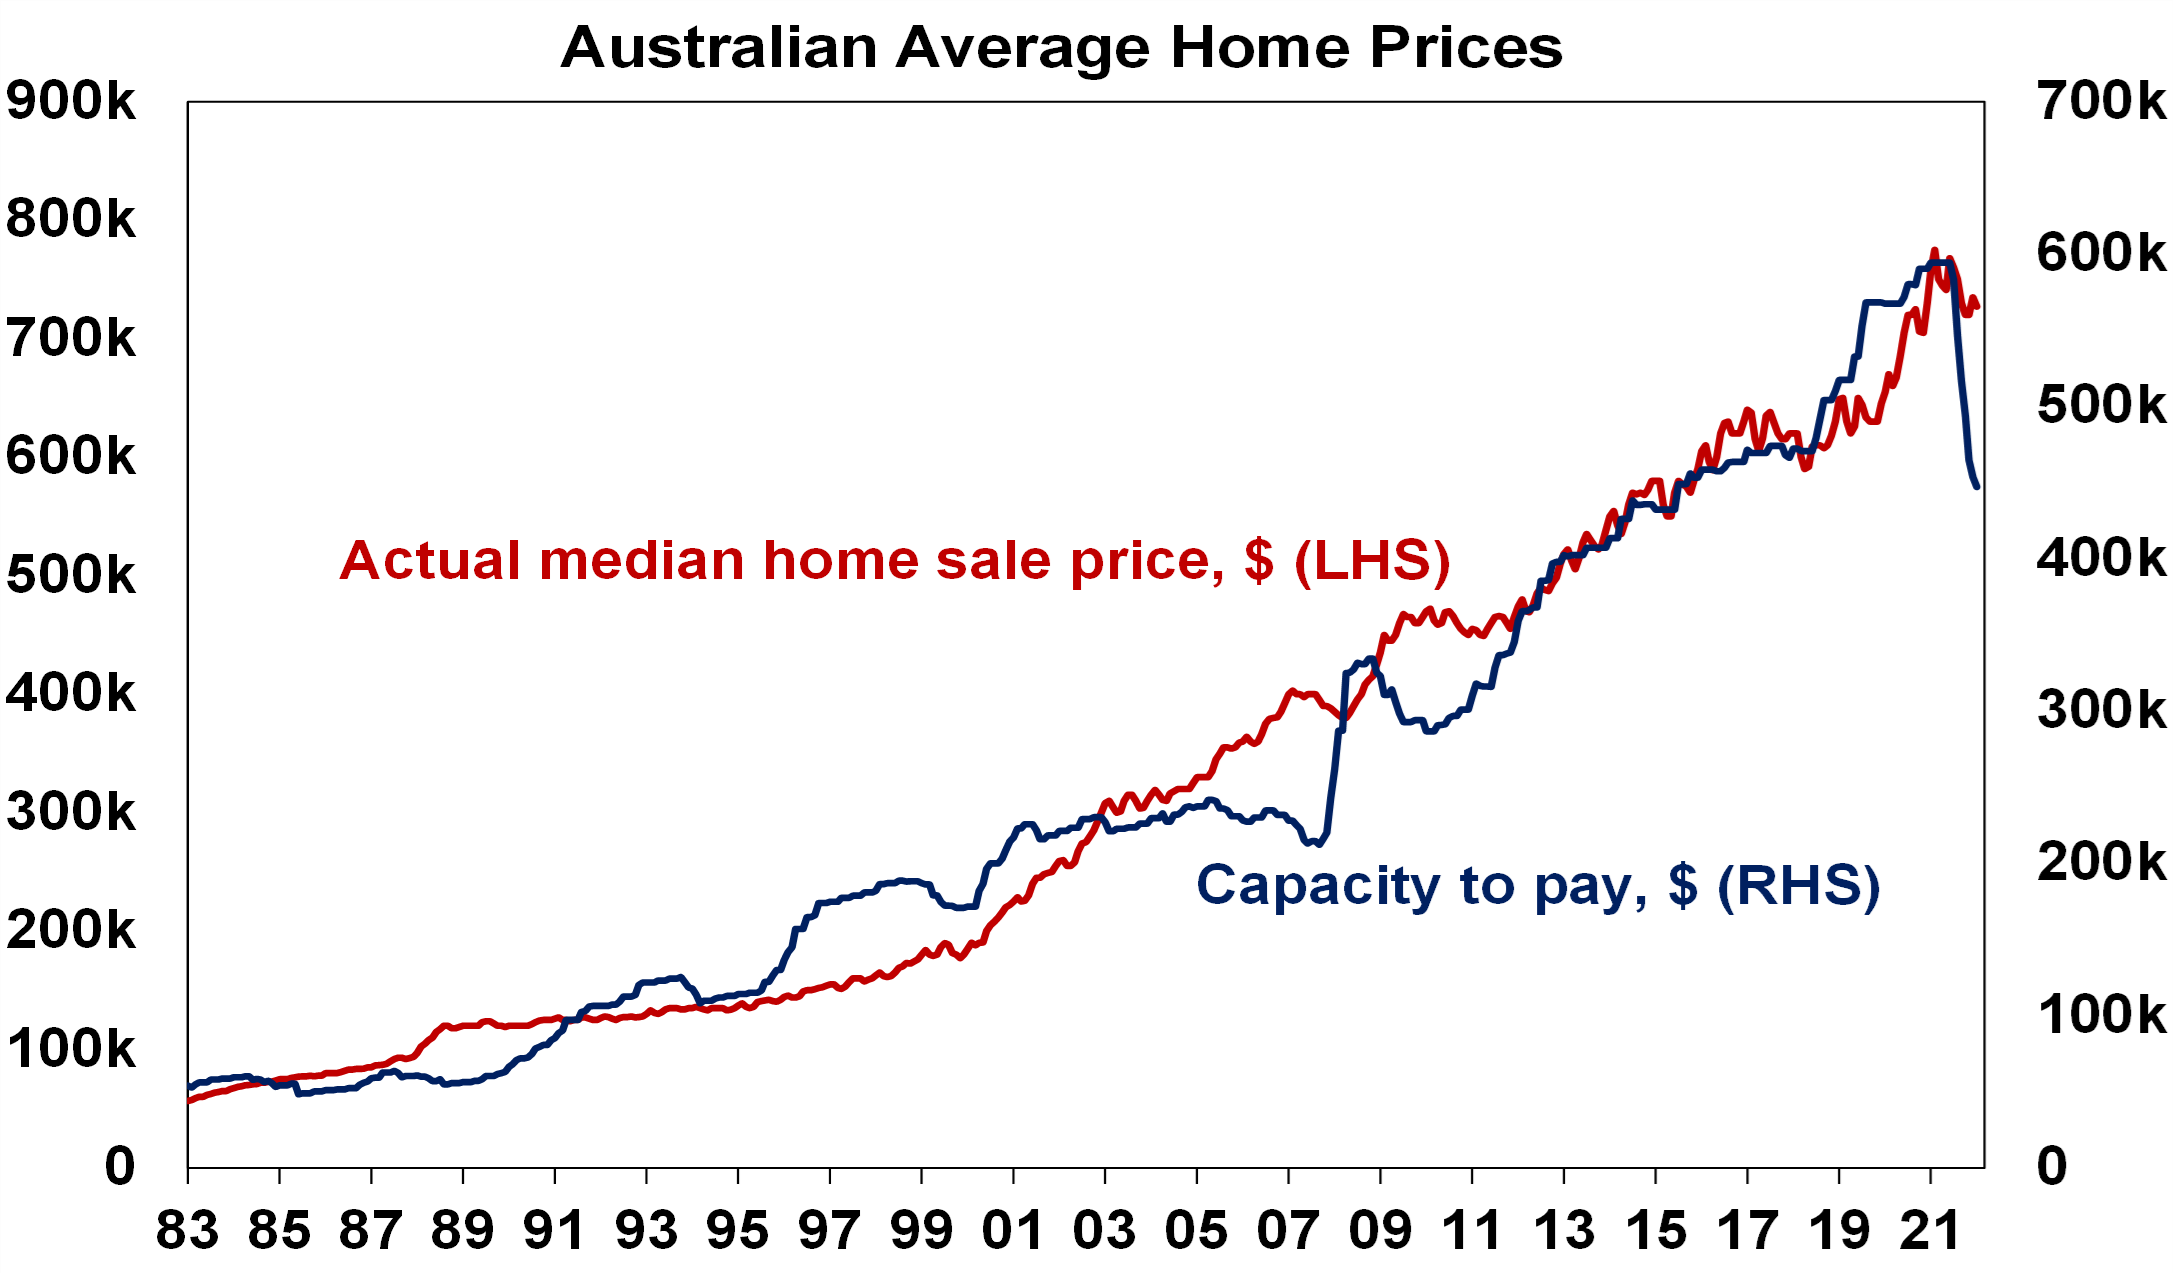
The combination will result in a further weakening in demand and a potential increase in supply as some financially stressed homeowners sell. In terms of the former, the next chart shows actual home prices compared to an estimate of what a buyer - with a 20% deposit, average full time earnings and mortgage payments assessed at 28% of their income – can afford to pay for a home. The shift in mortgage rates from 17% in 1989 to record lows in 2020 around 2-3% was the main enabler of the surge in home prices and price to income ratios. In other words, record low mortgage rates were reflected in record high home prices. While it can be seen from the chart that there are deviations and there are lots of other factors impacting home prices (supply, immigration, household size, taxation, help from “mum and dad”, home size and quality, and government incentives), over time home prices are tied to what people can afford to pay. But since April the amount an average new buyer can afford to pay has dropped by roughly 25% from around $600,000 to around $450,000. This demand side impact has been the key driver of home price falls so far, but suggests there is much more to go.
Partly based on a Deutsche Bank analysis. Source: RBA, CoreLogic, AMP
Out of interest, while home prices have fallen 7% or so from their recent high, the time taken to save for a 20% deposit remains almost double what it was in the mid 1990s. The combination of the surge in interest rates and still sky high home prices relative to incomes, which necessitate very high debt levels, means affordability is almost as bad as its ever been.
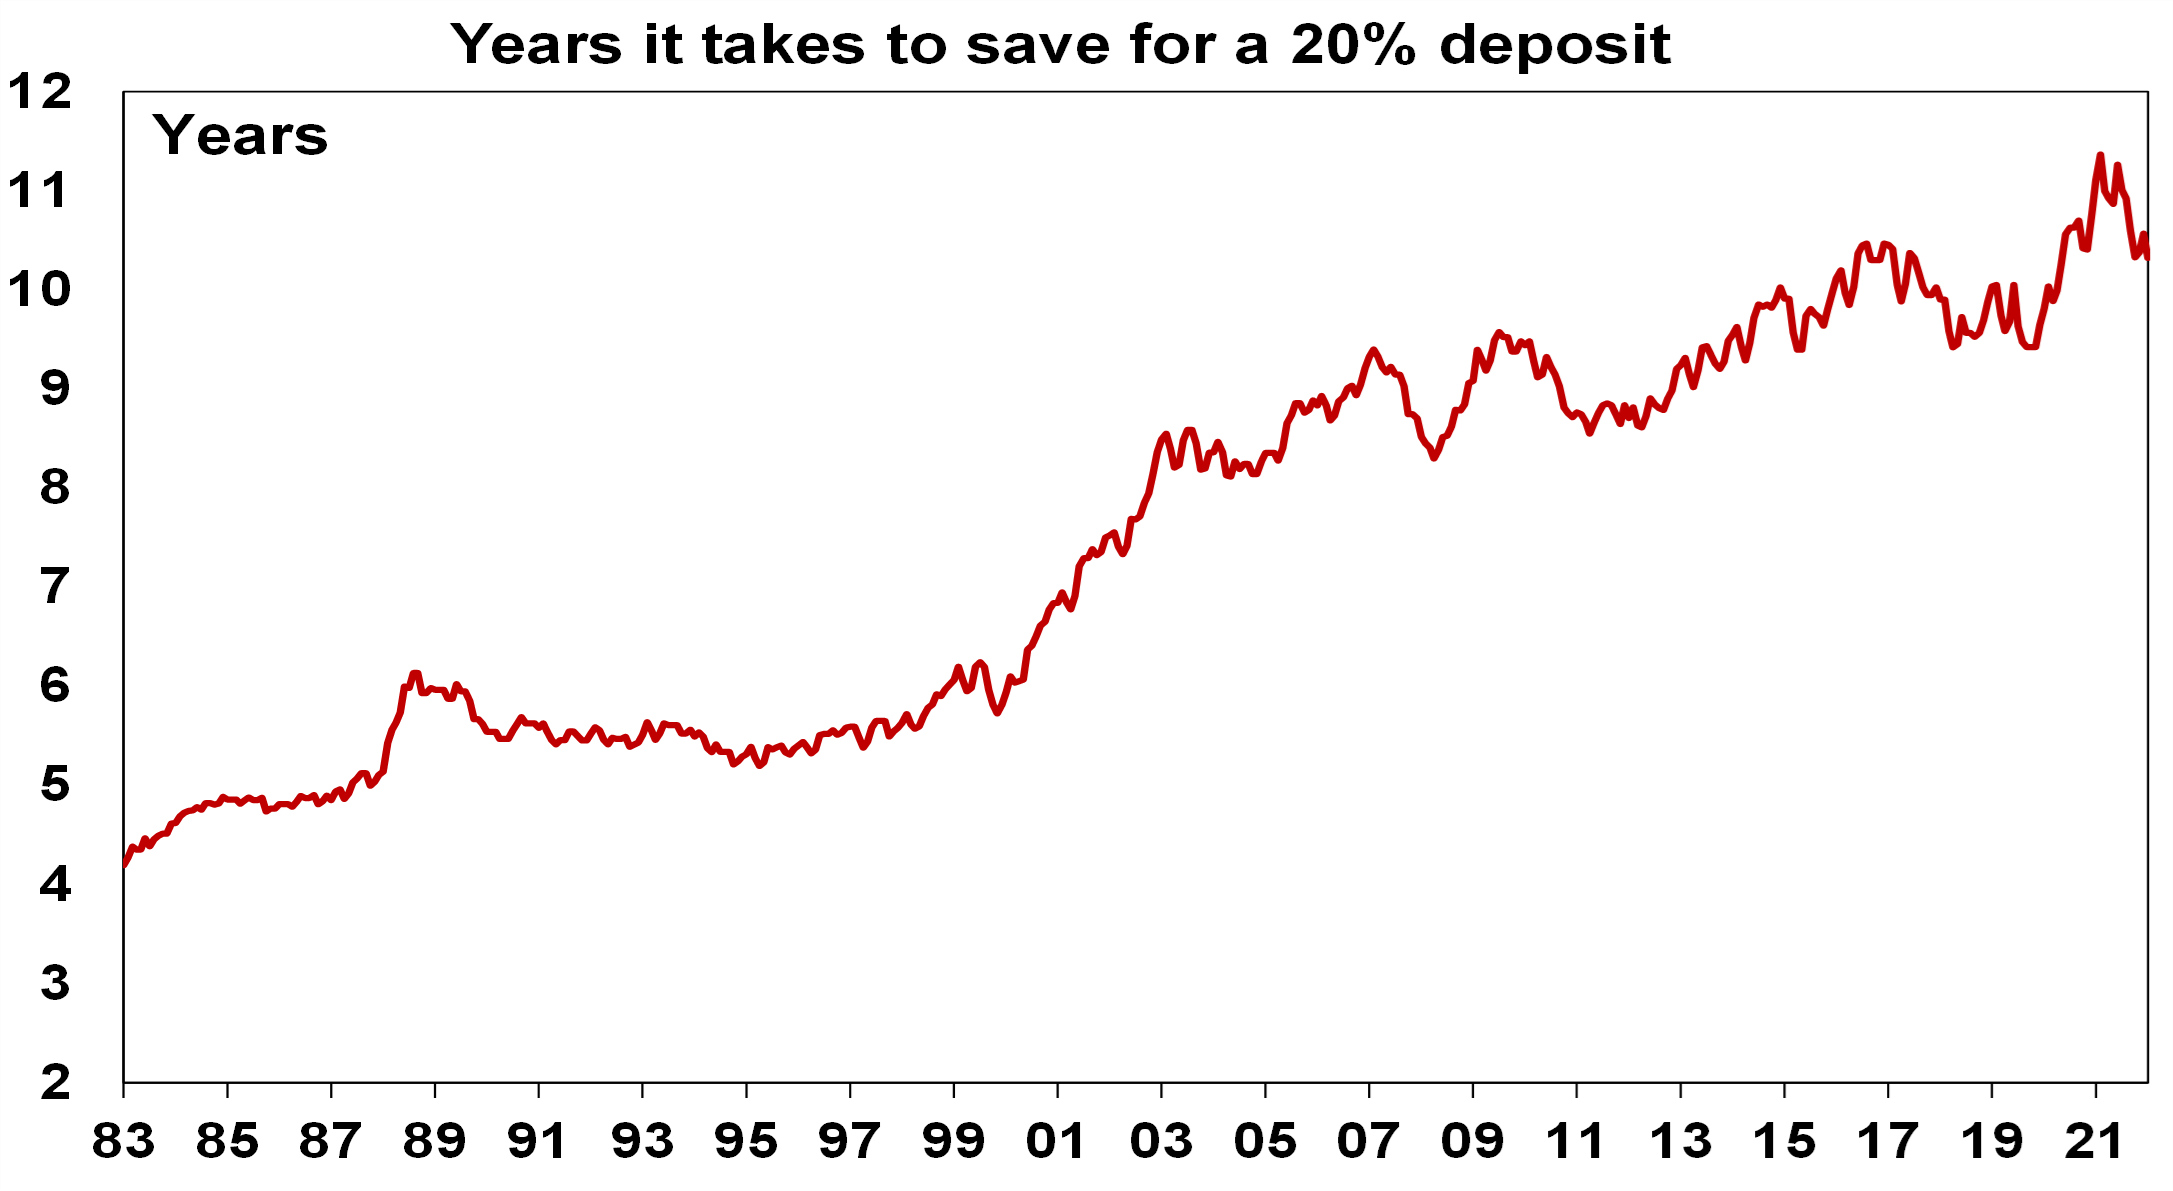
This assumes that the buyer saves 15% of their income each year. Source: RBA, CoreLogic, AMP
In terms of financial stress, with the 2.85% cash rate household interest payments as a share of income are already estimated to be at a near nine year high. Given record debt levels, further increases in mortgage rates will start to push total mortgage payments (principal and interest) to record highs relative to household income. This is likely to result in a sharp rise in mortgage stress – particularly as fixed rate loans reset next year.
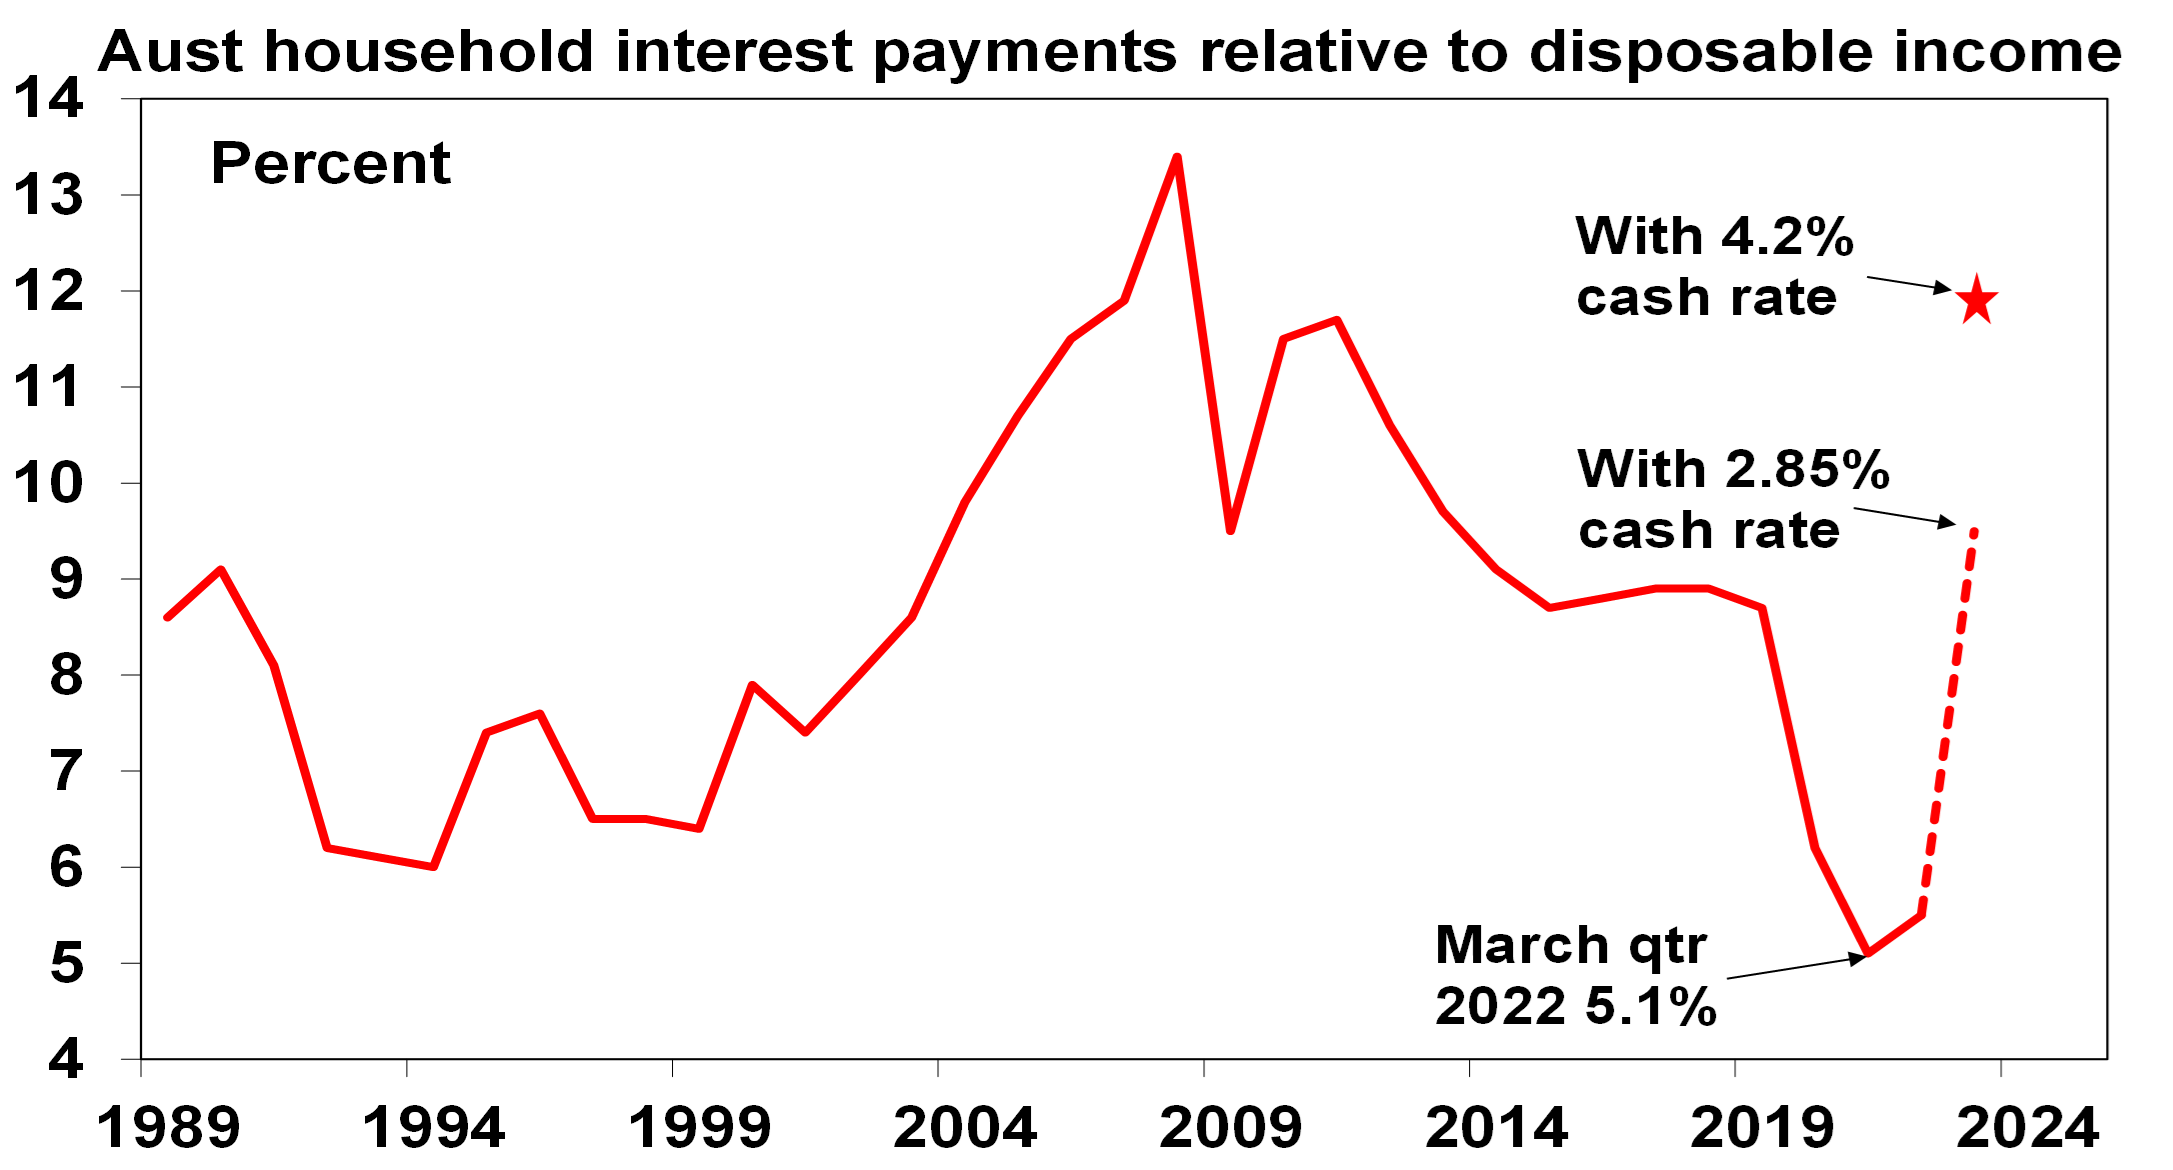
Source: ABS, RBA, AMP
As a result of these demand and supply side considerations flowing from higher interest rates, we continue to expect national home prices will have a top to bottom fall of 15 to 20% out to around September quarter next year, of which we are only about 40% of the way through.
The main risks on the downside are that the RBA raises the cash rate to around 4% (as the money market is assuming) and the economy enters recession. The RBA has already raised rates by more than the 2.5% interest rate serviceability buffer that applied up to October last year. In this scenario home prices could fall by around 30%.
On the upside several factors will help put a floor under prices and eventually drive a recovery. These include: government support programs (eg, home deposit schemes, “Help to Buy” schemes and NSW first home buyers swapping stamp duty for land tax); the tight rental market; & rapidly rising immigration. But for now, the property market will be dominated by higher rates. A pause in rate hikes on its own is unlikely to be enough to drive an upswing in prices as the capacity of buyers to pay will still be depressed. The last two major upswings in property prices that started in 2012 and 2019 required rate cuts before prices started to rise - see the purple ovals in the third chart in this note. Right now, we don’t anticipate rate cuts to start until late next year or early 2024.

Weekly market update 26-07-2024
26 July 2024 | Blog Dr Shane Oliver discusses the risk off as tech hit continues; correction risks into August/September; global rate cutting cycle underway; Australian June quarter CPI to rise but the hurdle to another RBA rate hike should be high; and more. Read more
Oliver's insights - rise of populism and bigger government
24 July 2024 | Blog This article takes a look at the rise of populism and what it means for economic policies and investors. Read more
Weekly market update 19-07-2024
19 July 2024 | Blog This week shares are down; US election/Trump prospects starting to impact; global rates easing cycle on track; China Plenum; Australian jobs still tight but easing so RBA needs to be careful; and more. Read moreWhat you need to know
While every care has been taken in the preparation of this article, neither National Mutual Funds Management Ltd (ABN 32 006 787 720, AFSL 234652) (NMFM), AMP Limited ABN 49 079 354 519 nor any other member of the AMP Group (AMP) makes any representations or warranties as to the accuracy or completeness of any statement in it including, without limitation, any forecasts. Past performance is not a reliable indicator of future performance. This document has been prepared for the purpose of providing general information, without taking account of any particular investor’s objectives, financial situation or needs. An investor should, before making any investment decisions, consider the appropriateness of the information in this document, and seek professional advice, having regard to the investor’s objectives, financial situation and needs. This article is solely for the use of the party to whom it is provided and must not be provided to any other person or entity without the express written consent AMP. This article is not intended for distribution or use in any jurisdiction where it would be contrary to applicable laws, regulations or directives and does not constitute a recommendation, offer, solicitation or invitation to invest.
The information on this page was current on the date the page was published. For up-to-date information, we refer you to the relevant product disclosure statement, target market determination and product updates available at amp.com.au.