
Key points
- We are reasonably upbeat on the outlook for investment markets this year, but it won’t be smooth sailing and after a strong start to the year share markets are vulnerable to a further pull back in the short term given ongoing issues around inflation, interest rates, recession and geopolitics.
- Seven key charts worth keeping an eye on remain: global business conditions PMIs; US inflation and our Pipeline Inflation Indicator; unemployment & underemployment; inflation expectations; earnings revisions; the gap between earnings yields and bond yields; and the US dollar.
Introduction
Shares had a strong start to the year seeing gains into early February around or above what we expect for the year as a whole. But we still expect that it will be a volatile year given that: the process of getting inflation back down won’t be smooth; the topping process in central bank rates will take time with setbacks along the way as we have seen for both the Fed and the RBA recently; recession risks are high; raising the US debt ceiling around the September quarter won’t be smooth; and geopolitical risks around Ukraine, China (as highlighted by the balloon over the US) and Iran (which is getting close to nuclear weapon breakout capacity) are significant. With shares becoming overbought after the new year rally and seasonality turning less positive, shares both globally and in Australia are vulnerable to more of a pull back in the short term. This note updates seven charts we see as critical for the investment outlook.
Chart # 1 - global business conditions PMIs
Whether share markets fall back to new lows and resume the bear market in US and global shares that started last year will be crucially dependent on whether major economies slide into recession and, if so, how deep that is. Our assessment is that global growth will be around 2.5-3% this year. Global Purchasing Managers Indexes (PMIs) – surveys of purchasing managers at businesses – will be a key warning indicator.
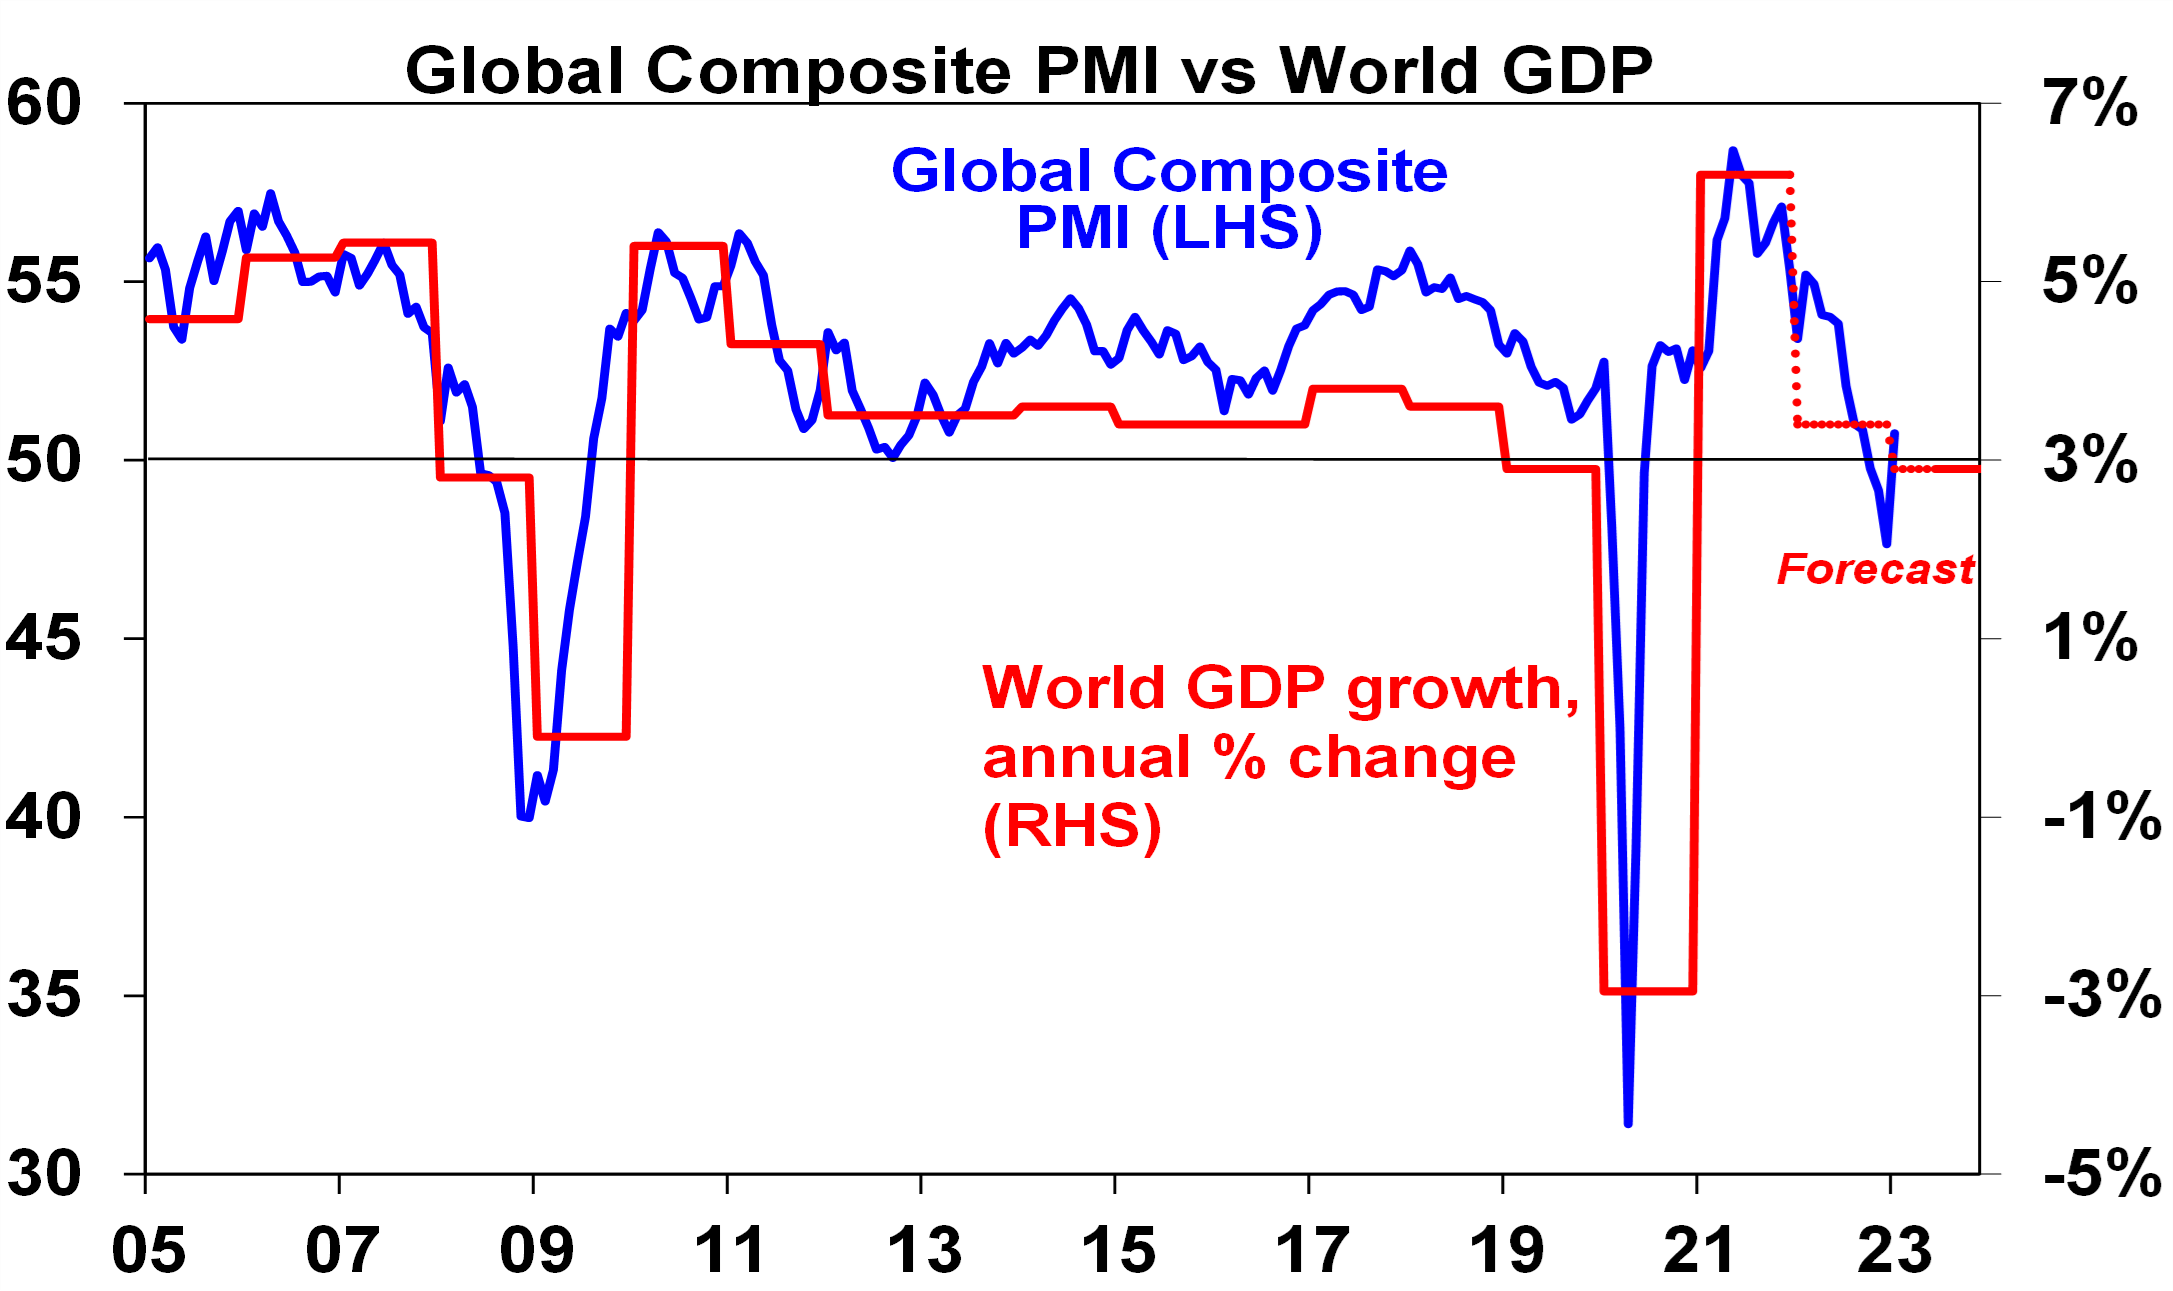
Source: Bloomberg, AMP Capital
They have slowed but are not at levels associated with recession. In January they rose, helped by China’s reopening. So far, they still look ok.
Chart 2 (and 2b) – inflation
A lot continues to ride on how far key central banks raise interest rates. And the path of inflation will play a key role in this. Recently the news has been better with inflation rates in key countries rolling over. US inflation is well down from its high last year and our US Pipeline Inflation Indicator – reflecting a mix of supply and demand indicators – has been falling, pointing to a further fall in inflation. The key is that US inflation continues to fall – if so, this should allow the Fed to stop hiking in either March or May and it could find itself needing to cut rates from later this year.
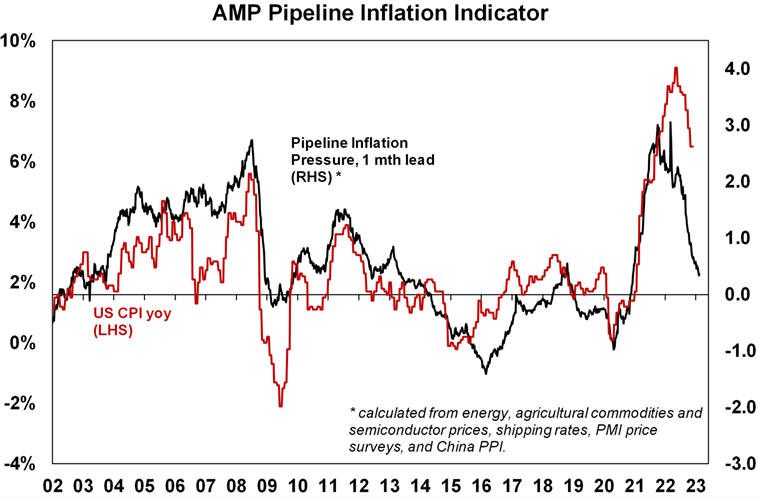
Source: Bloomberg, AMP
Our Australian Pipeline Inflation Indicator also suggests that Australian inflation has peaked and will fall through this year, albeit Australian inflation and the RBA are lagging the US and the Fed.
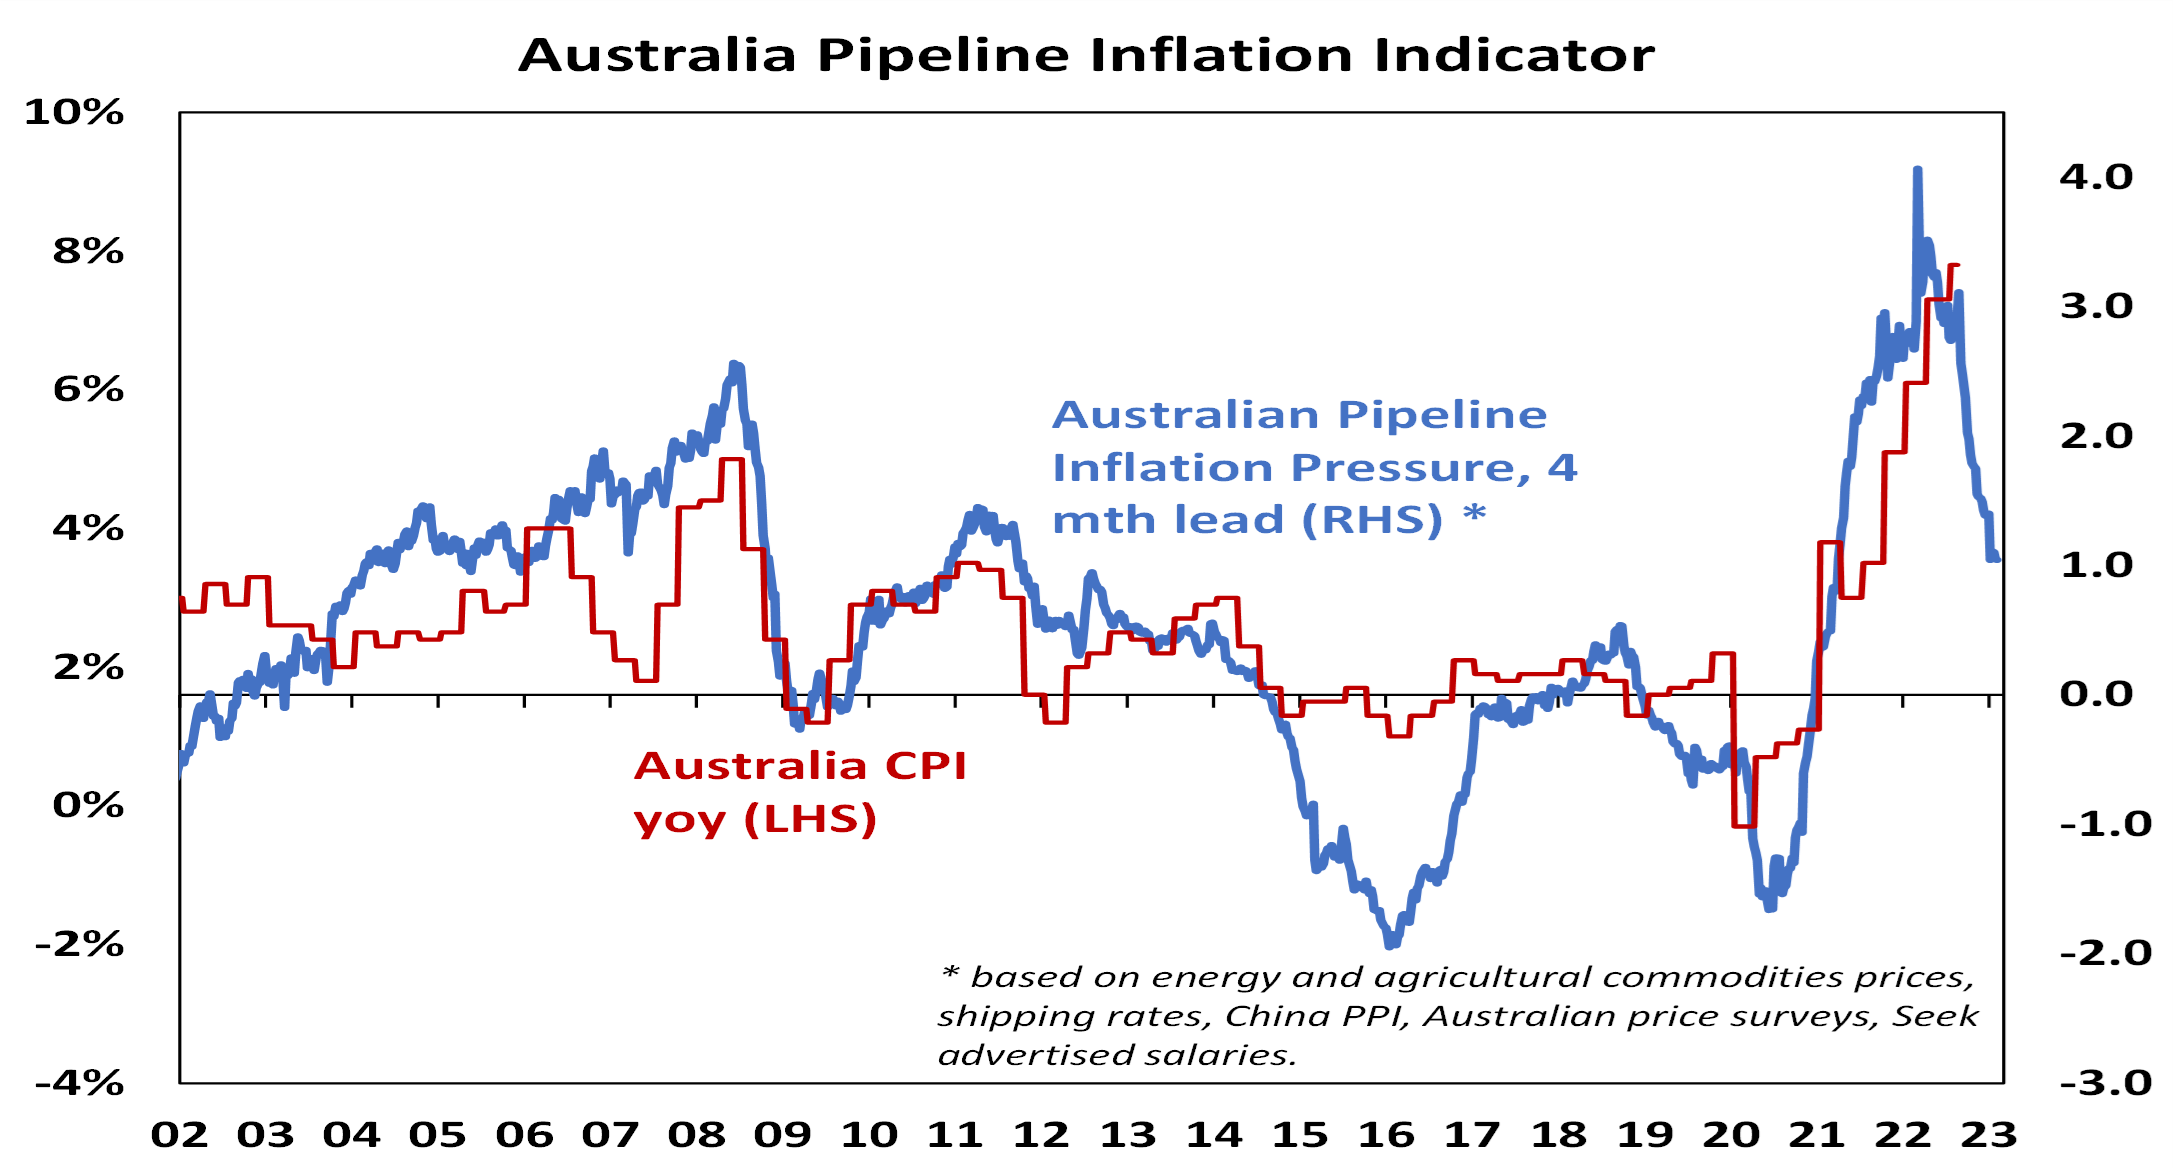
Source: Bloomberg, AMP
Chart 3 – unemployment and underemployment
Also critical is the tightness of labour markets as this will help drive wages growth. If wages growth accelerates too far it risks locking in high inflation with a wage-price spiral which would make it hard to get inflation down. Unemployment and underemployment are key indicators of this. Both remain very low in the US & Australia (putting upwards pressure on wages), but there is some evidence that labour markets have seen the best and may now be slowing. And wages growth in the US looks to have peaked.
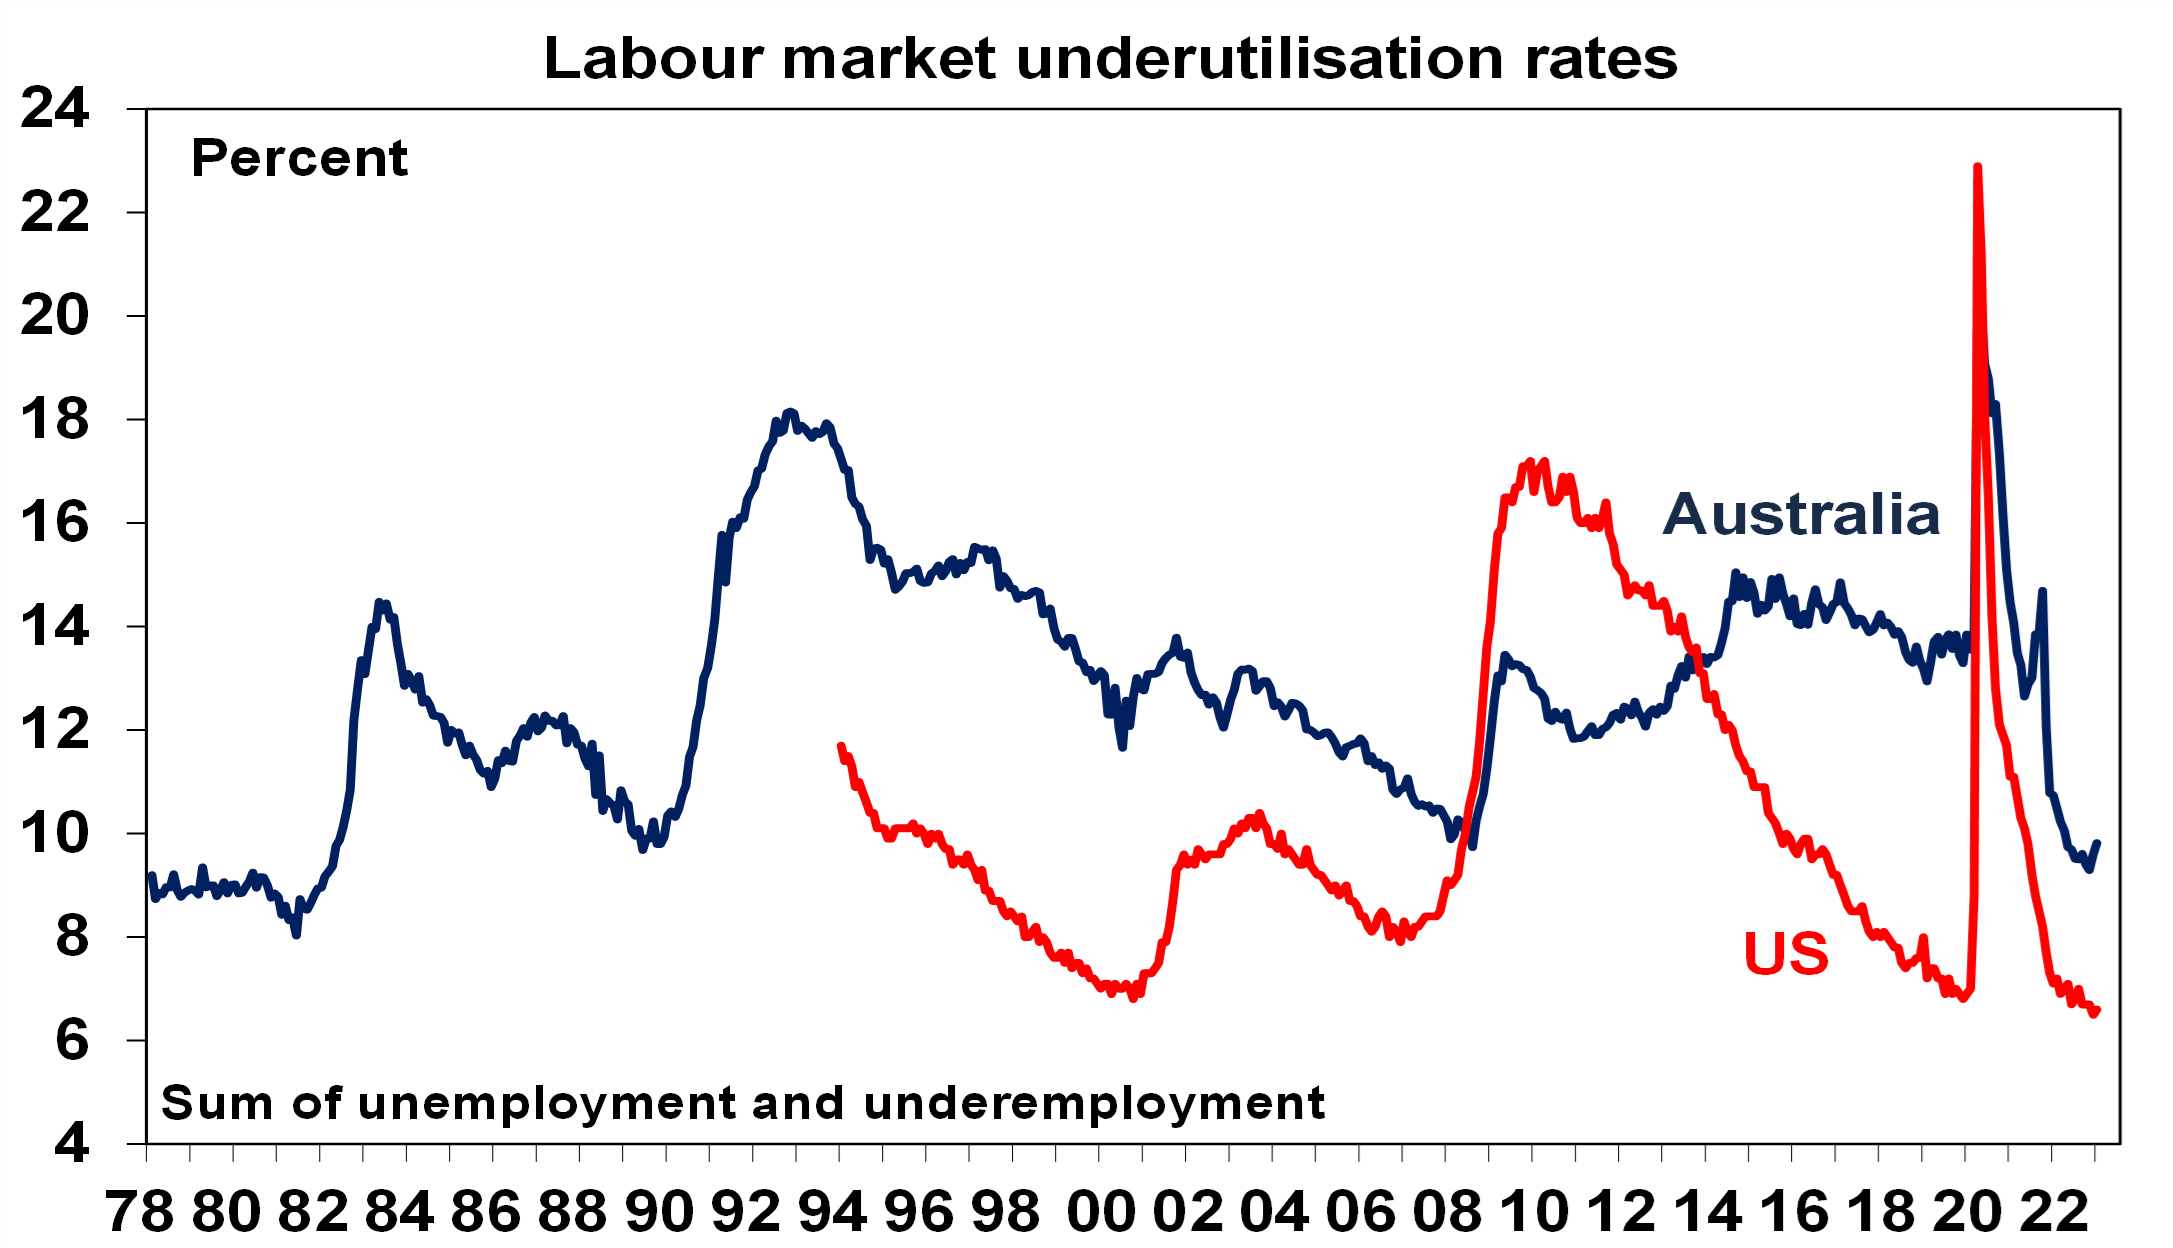
Source: Bloomberg, AMP
Chart 4 – longer term inflation expectations
The 1970s experience tells us the longer inflation stays high, the more businesses, workers and consumers expect it to stay high & then they behave (in terms of wage demands, price setting & tolerance for price rises) in ways which perpetuate it. The good news is that short term (1-3 years ahead) inflation expectations have fallen lately in the US and longer-term inflation expectations remain low. The latter is consistent with 2% or so inflation & suggests the job of central banks should be far easier today than say in 1980 when the same measure was around 10% and deep recession was required to get inflation back down. The key is that it stays low.
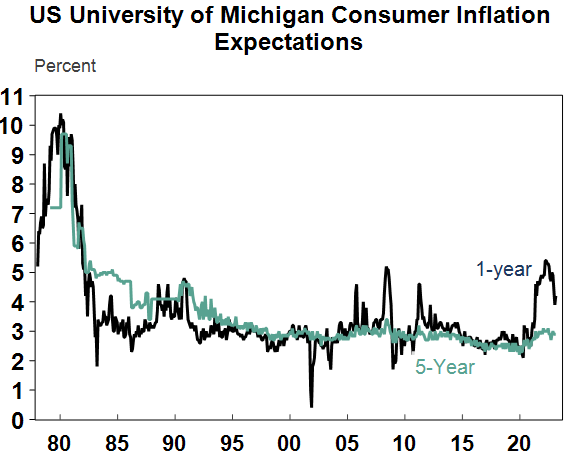
Source: Macrobond, AMP
Chart 5 – earnings revisions
Consensus earnings growth expectations for this year are around 11% for the US and around 7% for Australia. They look a bit too high, but a deterioration on the scale seen in the early 1990s, 2001-03 in the US and 2008 would be bad news. So far so good.
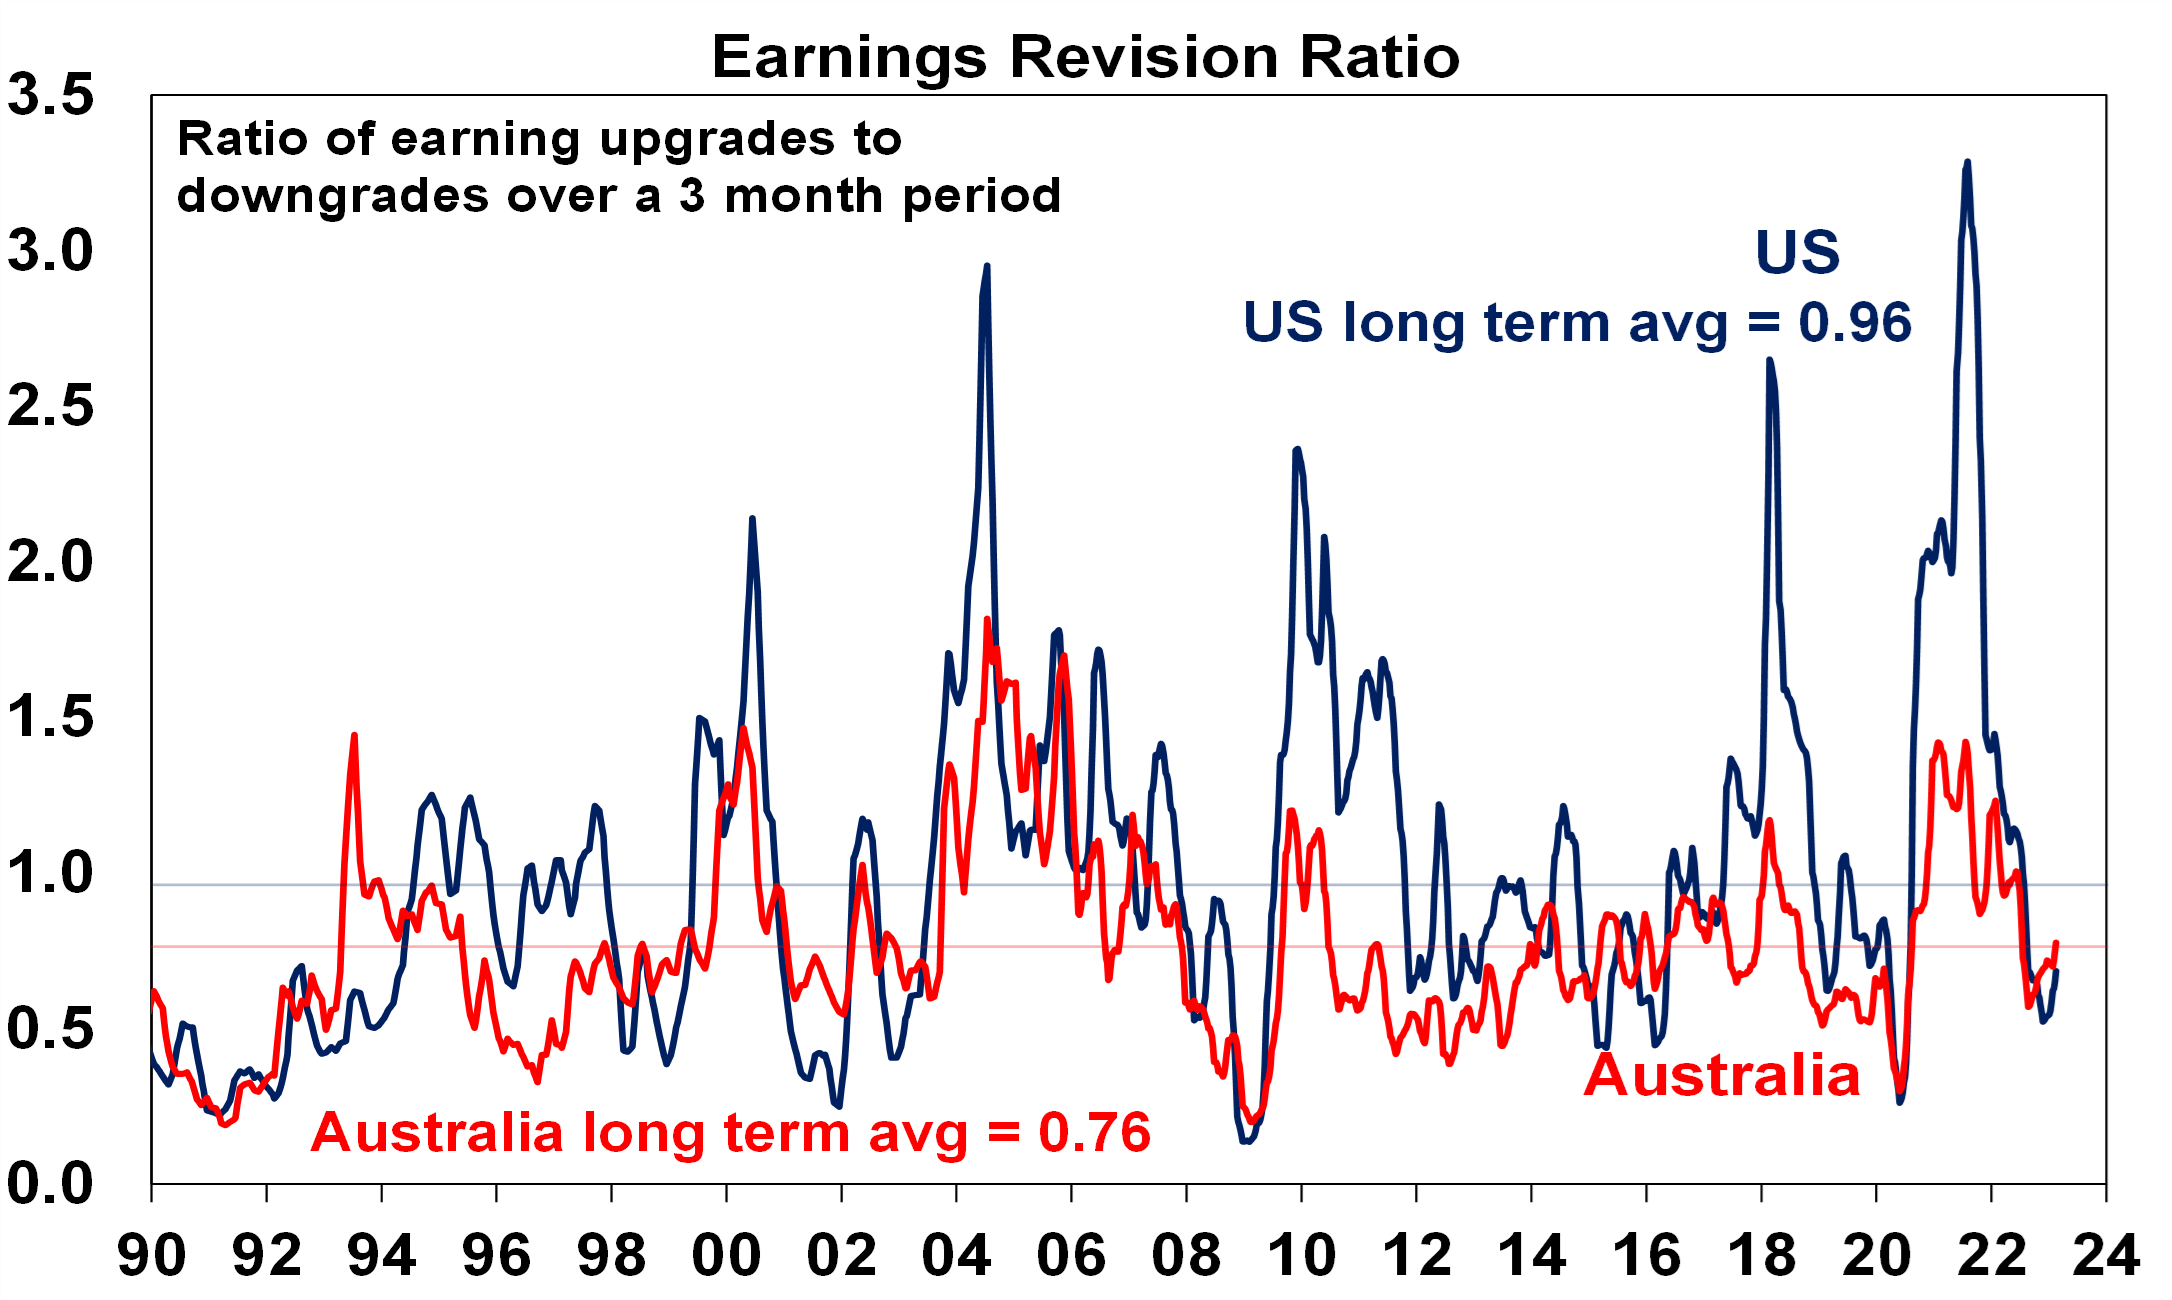
Source: Reuters, AMP
Chart 6 – the gap between earnings and bond yields
Over the last year rising bond yields have weighed on share market valuations. As a result, the gap between earnings yields and bond yields (which is a proxy for shares’ risk premium) has narrowed to its lowest since the GFC in the US. Compared to the pre-GFC period shares still look cheap. Australian share valuations look a bit more attractive than those in the US though helped by a higher earnings yield. Ideally bond yields need to continue to decline and earnings downgrades need to be limited in order to keep valuations okay.
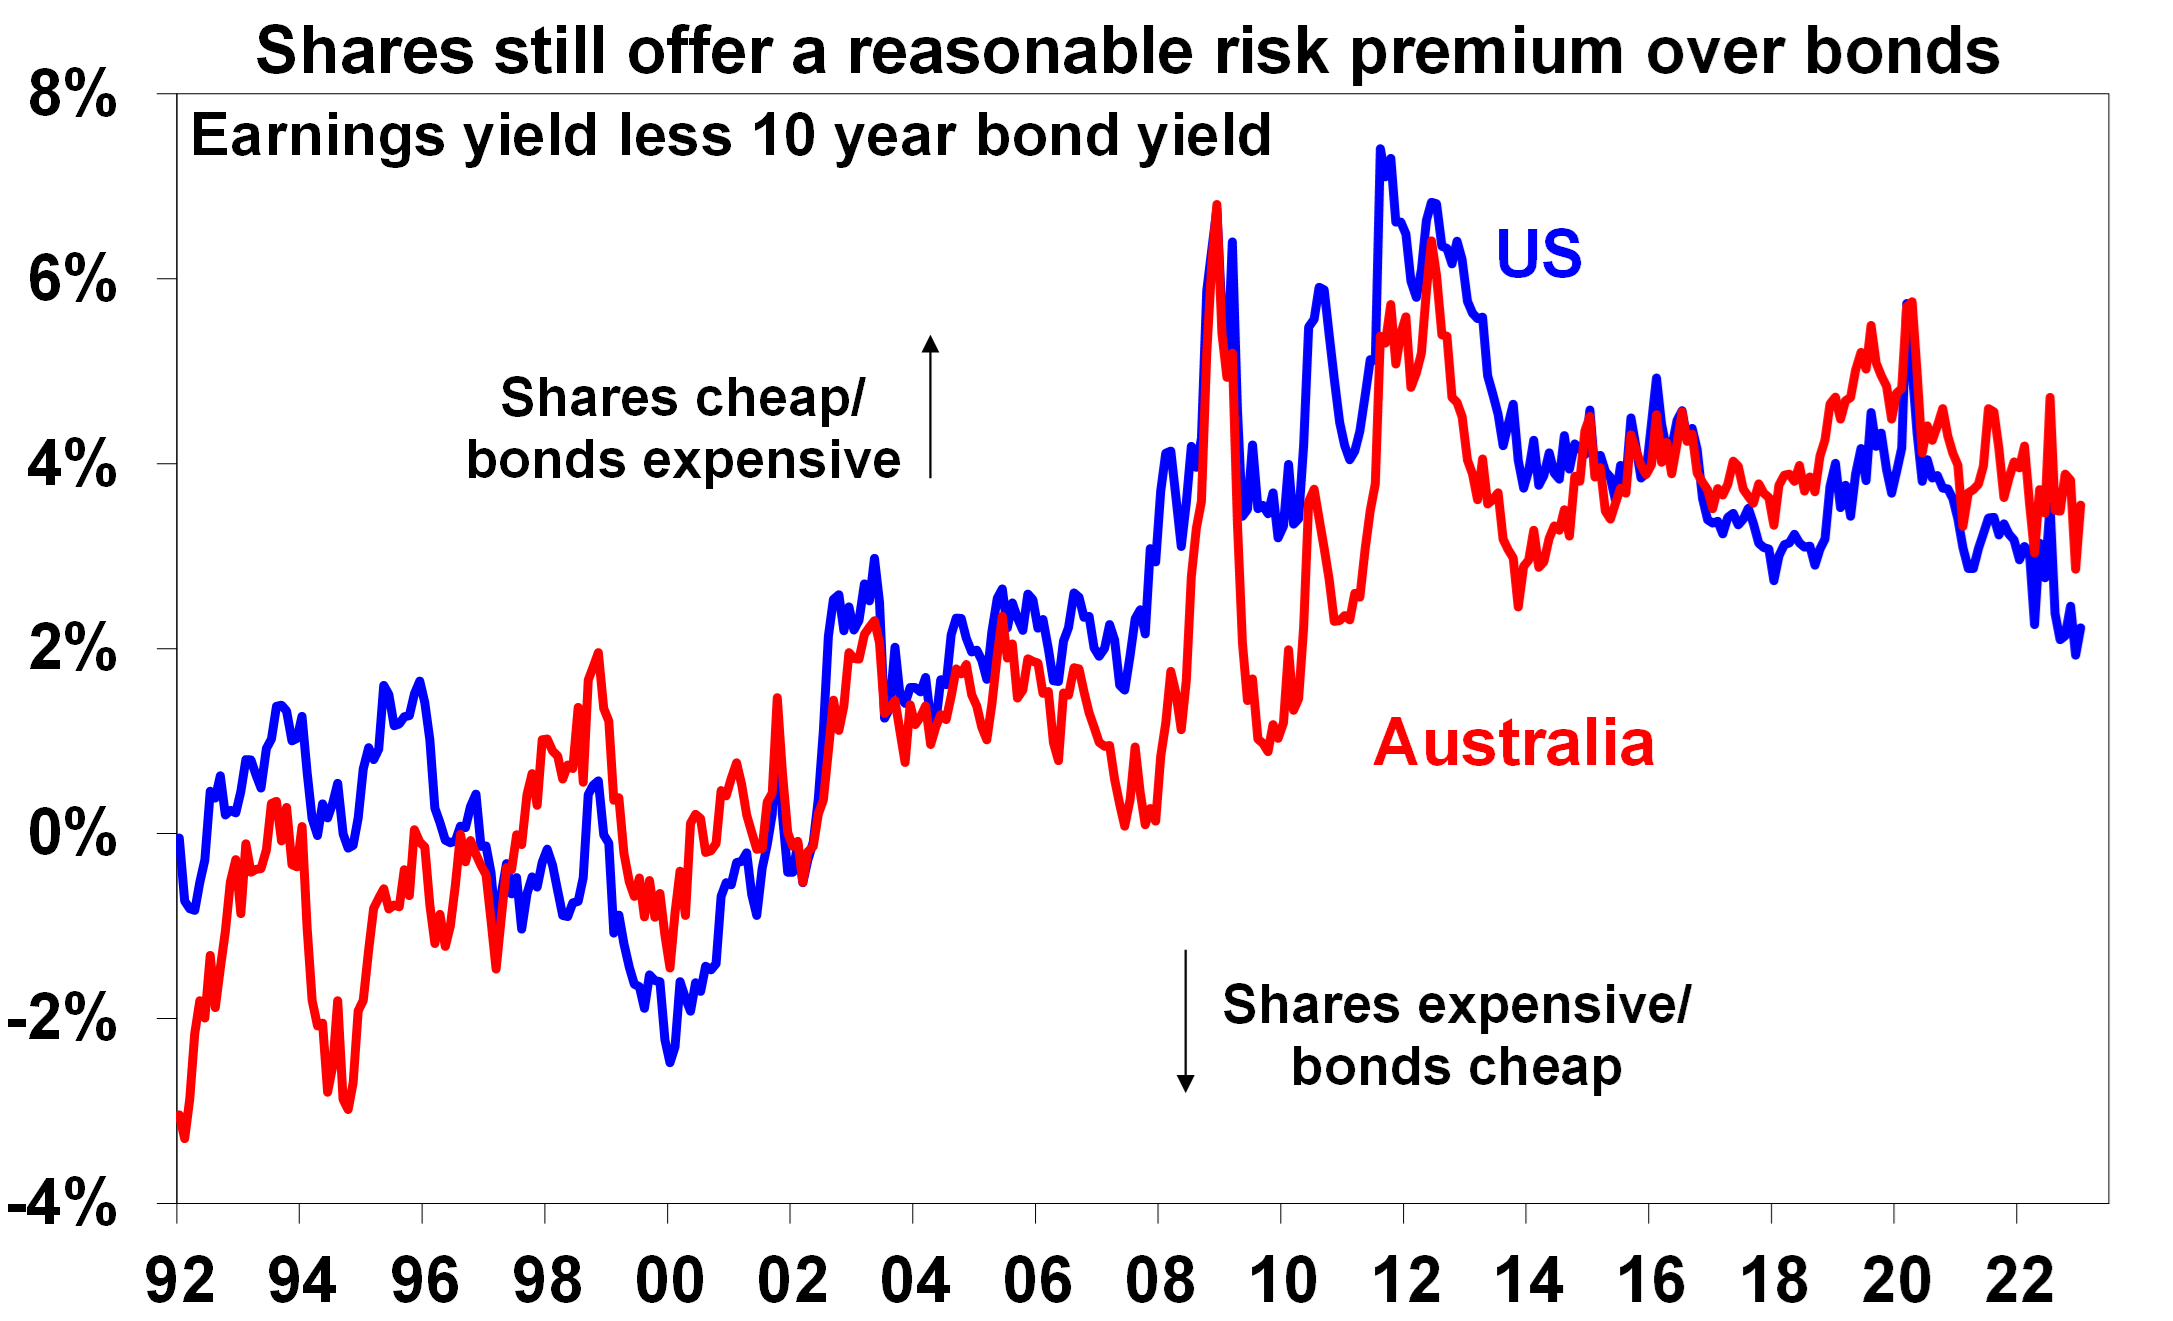
Source: Reuters, AMP
Chart 7 – the US dollar
The US dollar is a counter cyclical currency, so big moves in it are of global significance and bear close watching as a key bellwether of the economic and investment cycle. Due to the relatively low exposure of the US economy to cyclical sectors, the $US tends to be a “risk-off” currency, ie, it goes up when there are worries about global growth and down when the outlook brightens. Last year the $US surged with safe haven demand in the face of worries about recession and war and more aggressive monetary tightening by the Fed. Since September though it has fallen back as inflation and Fed rate hike fears have eased and geopolitical risks receded a bit. A further fall in the $US would be consistent with our reasonably upbeat view of investment markets this year, whereas a sustained new upswing would suggest it may be vulnerable. So far so good.
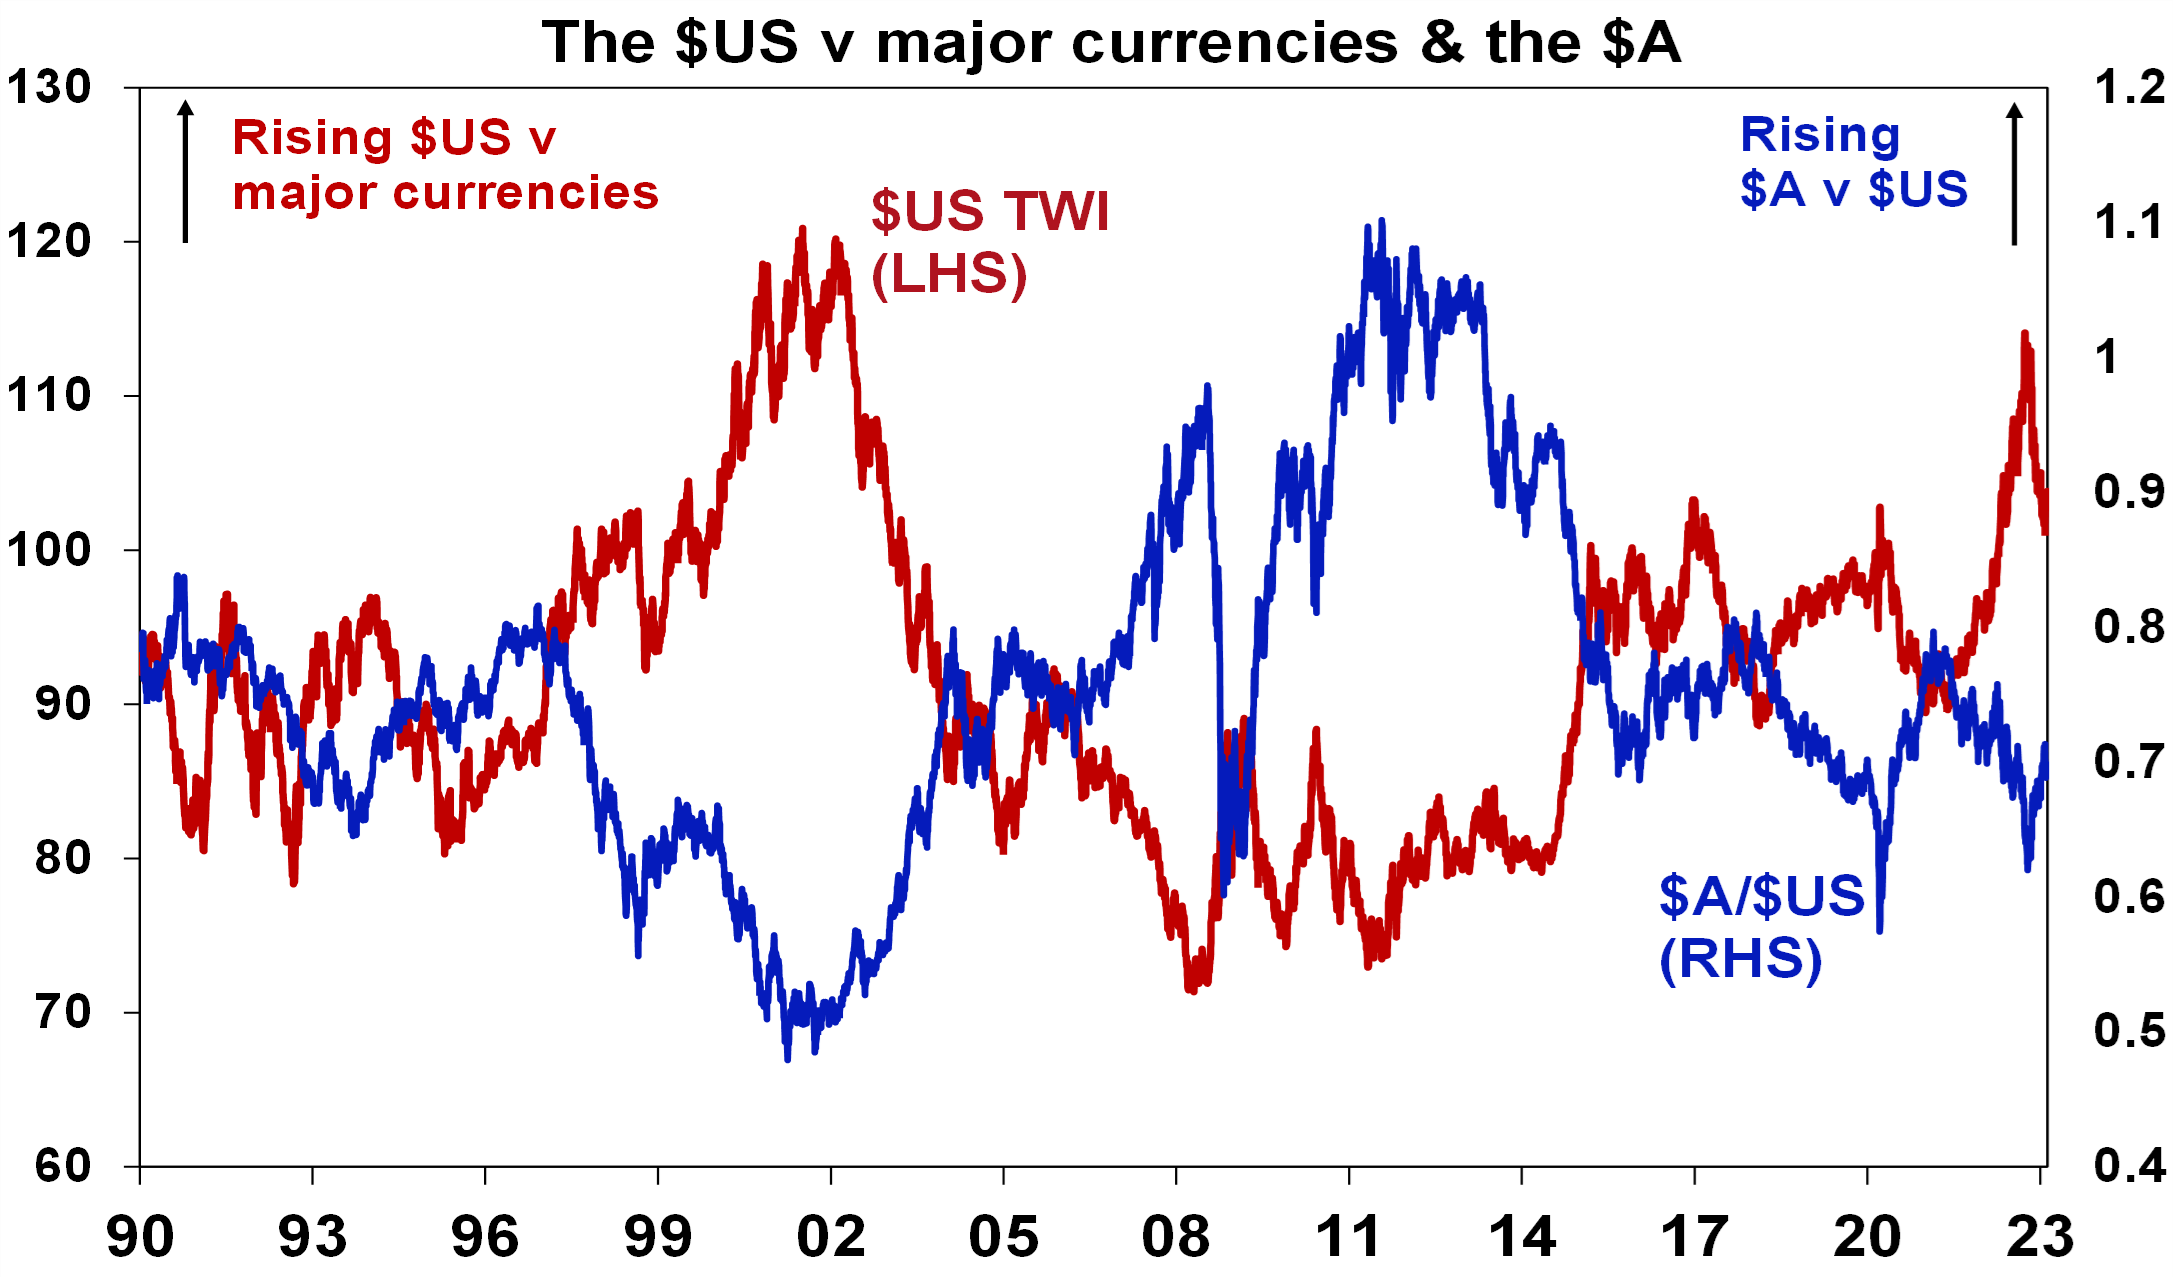
Source: Bloomberg, AMP

Weekly market update 26-07-2024
26 July 2024 | Blog Dr Shane Oliver discusses the risk off as tech hit continues; correction risks into August/September; global rate cutting cycle underway; Australian June quarter CPI to rise but the hurdle to another RBA rate hike should be high; and more. Read more
Oliver's insights - rise of populism and bigger government
24 July 2024 | Blog This article takes a look at the rise of populism and what it means for economic policies and investors. Read more
Weekly market update 19-07-2024
19 July 2024 | Blog This week shares are down; US election/Trump prospects starting to impact; global rates easing cycle on track; China Plenum; Australian jobs still tight but easing so RBA needs to be careful; and more. Read moreWhat you need to know
While every care has been taken in the preparation of this article, neither National Mutual Funds Management Ltd (ABN 32 006 787 720, AFSL 234652) (NMFM), AMP Limited ABN 49 079 354 519 nor any other member of the AMP Group (AMP) makes any representations or warranties as to the accuracy or completeness of any statement in it including, without limitation, any forecasts. Past performance is not a reliable indicator of future performance. This document has been prepared for the purpose of providing general information, without taking account of any particular investor’s objectives, financial situation or needs. An investor should, before making any investment decisions, consider the appropriateness of the information in this document, and seek professional advice, having regard to the investor’s objectives, financial situation and needs. This article is solely for the use of the party to whom it is provided and must not be provided to any other person or entity without the express written consent AMP. This article is not intended for distribution or use in any jurisdiction where it would be contrary to applicable laws, regulations or directives and does not constitute a recommendation, offer, solicitation or invitation to invest.
The information on this page was current on the date the page was published. For up-to-date information, we refer you to the relevant product disclosure statement, target market determination and product updates available at amp.com.au.