

Key points
- Australian and US consumer price inflation are now at relatively similar levels.
- The recent uptick in US inflation is a concern, as both a leading indicator for price growth and as a signal for future interest rate cuts.
- But, we think Australian inflation trends are now different to the US because of: the divergent impact of rate hikes, lower wages growth in Australia, measurement differences, business survey trends and our pipeline indicator.
- We still see inflation slowing in Australia over 2024 to under 3% by late 2024.
Introduction
The latest March US consumer price data showed that the progress in reducing the pace of US inflation has stalled. Does the recent uptick in US inflation data mean that Australian inflation will also remain higher than expected in 2024? We look at this issue in this Econosights.
Recent US Inflation
The headline US consumer price index (CPI) is running at 3.5% over the year to March and core inflation is at 3.8%. While this is much lower than the peak of 9% in mid-2022, inflation has basically moved sideways in the past few months, instead of trending down. Shelter and core services (ex shelter) inflation is a problem in the US. Goods price inflation remains negative – see the chart below. The US Federal Reserve targets a 2% inflation rate as measured by the personal consumption expenditure (or PCE) deflator. This is slightly different to the CPI because the weights used to calculate price growth change frequently based on current spending data. The PCE deflator is usually below the CPI and is currently at 2.8% over the year to February.
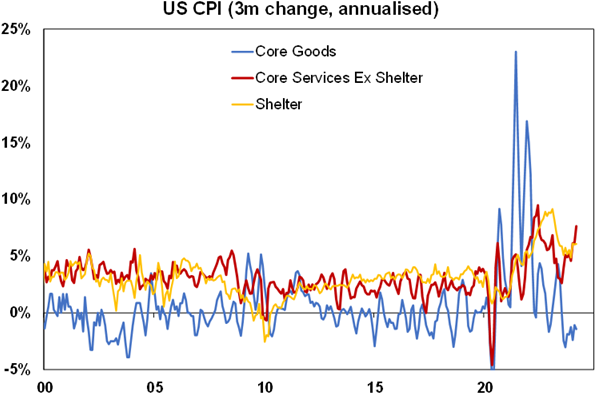
Source: Bloomberg, AMP
Differences in inflation in the US and Australia
Australian headline inflation is running at 3.4% over the year to February, basically in line with the US (see the next chart) and core inflation (or the trimmed mean) is also close to the US at 3.9% year on year.
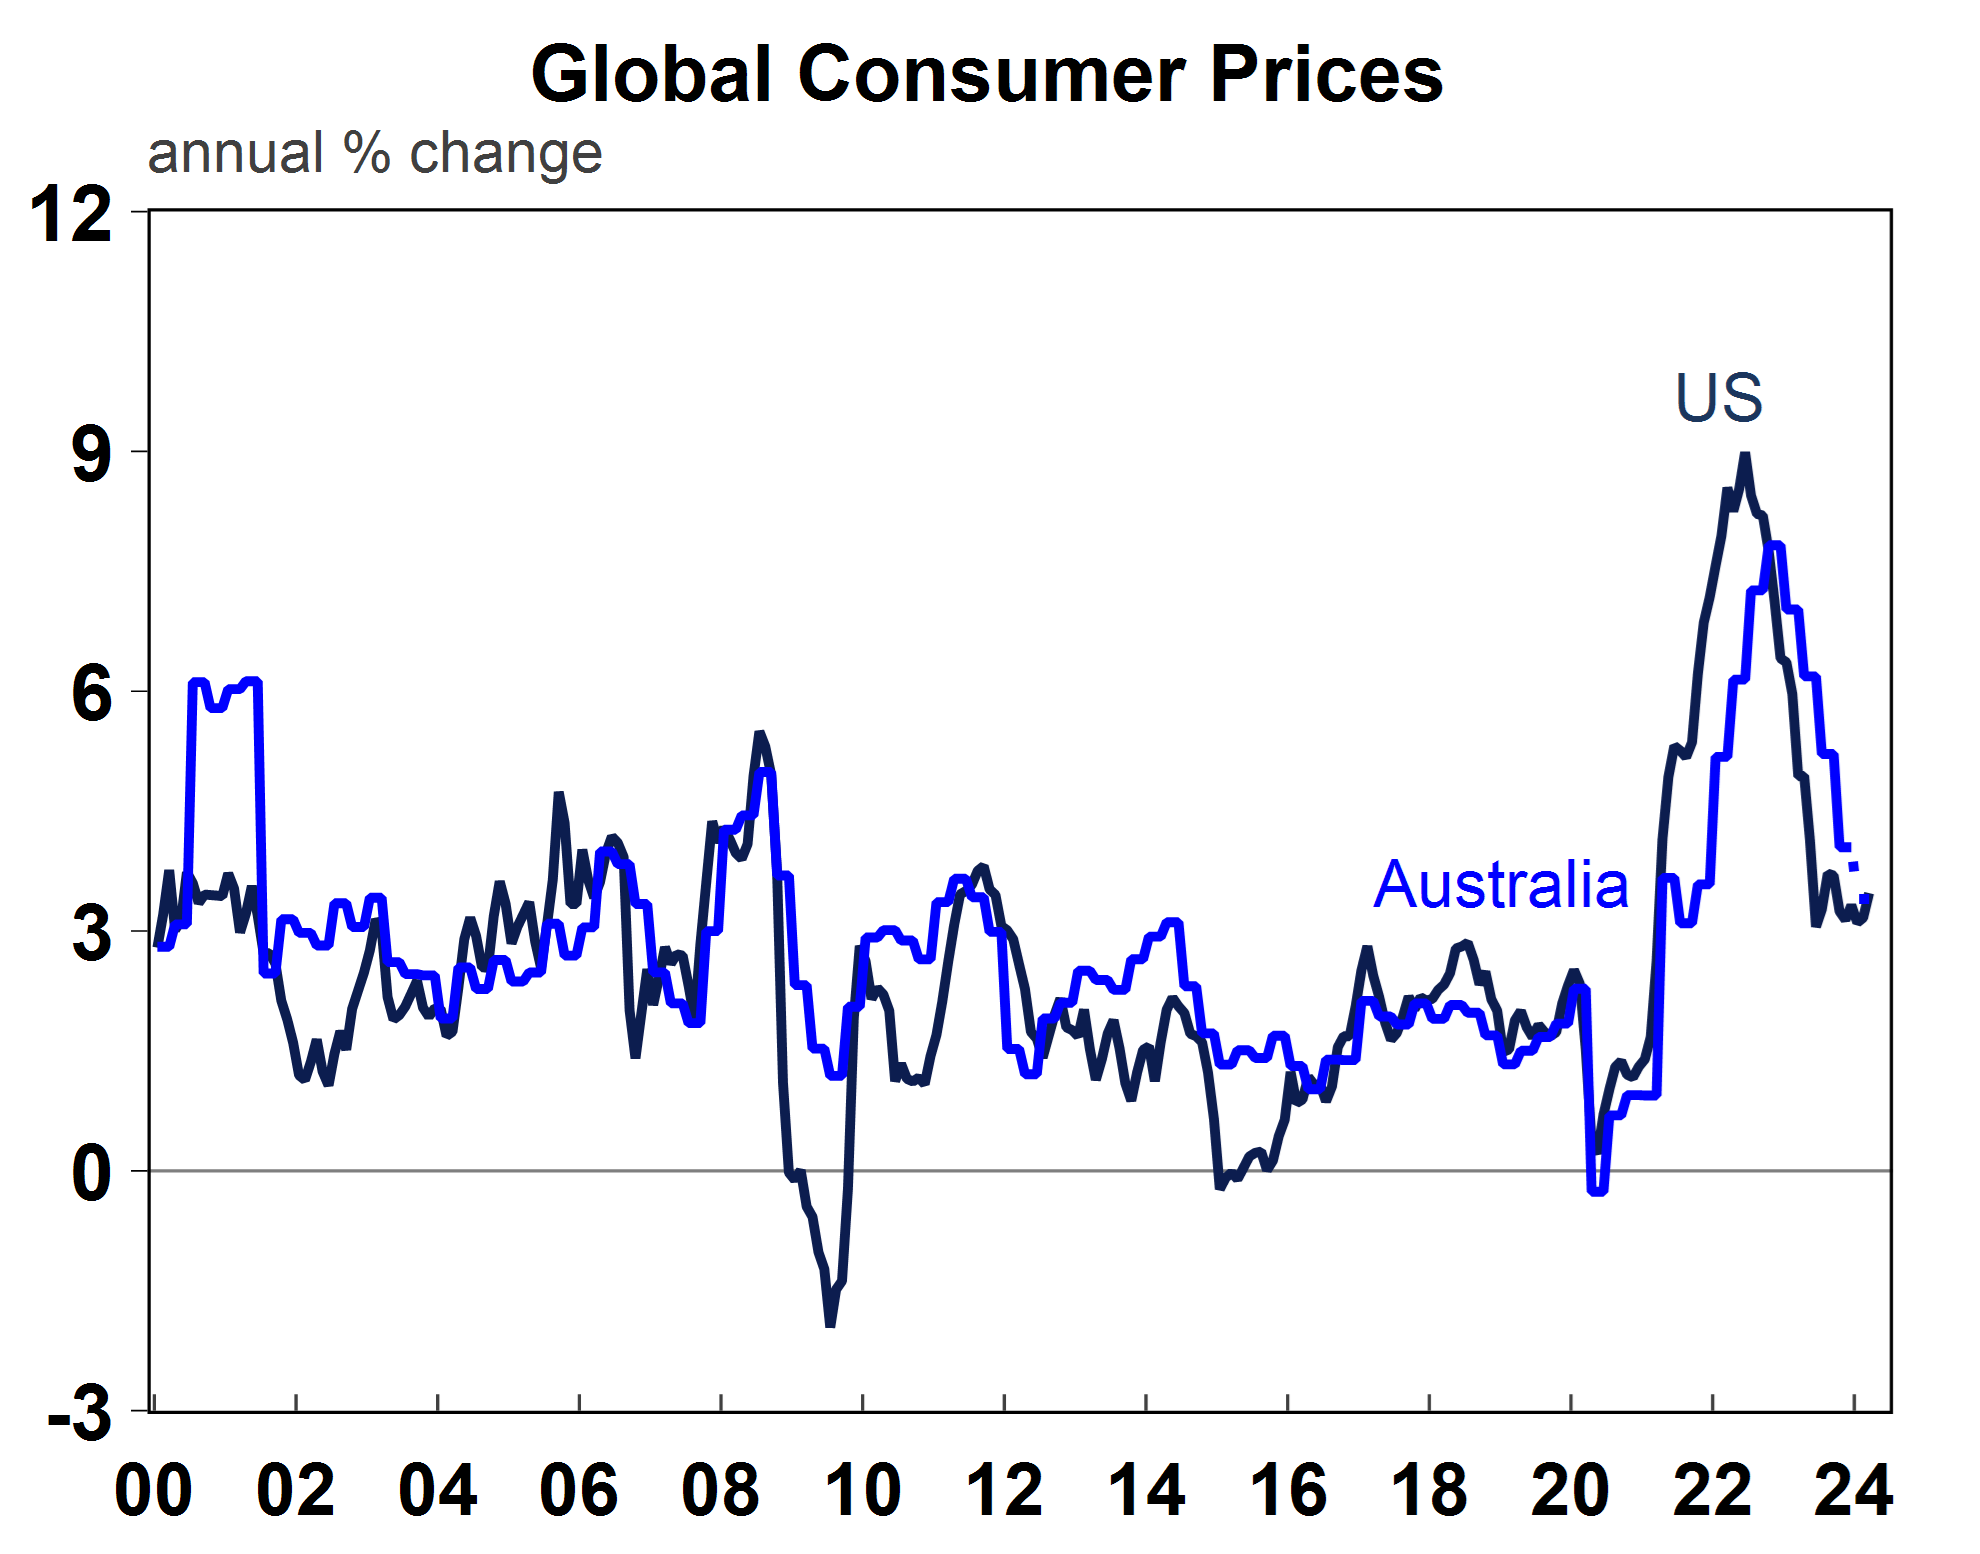
Source: Macrobond, AMP
Australian inflation peaked around 6 months after the US (in December 2022) and we had been looking to US inflation trends as a signal for Australia. However, we think Australian inflation will see a further slowing from here, unlike the recent pattern in the US.
1. Domestic conditions in the US and Australia have been impacted differently by monetary policy. The Australian consumer is highly sensitive to interest rate changes because mortgages are on short-term fixed or variable interest rates. US outstanding mortgage rates have risen by 0.5 percentage points, compared to 3.2 percentage points in Australia (see the chart below). This is despite Australia increasing interest rates by 1% less than the US.
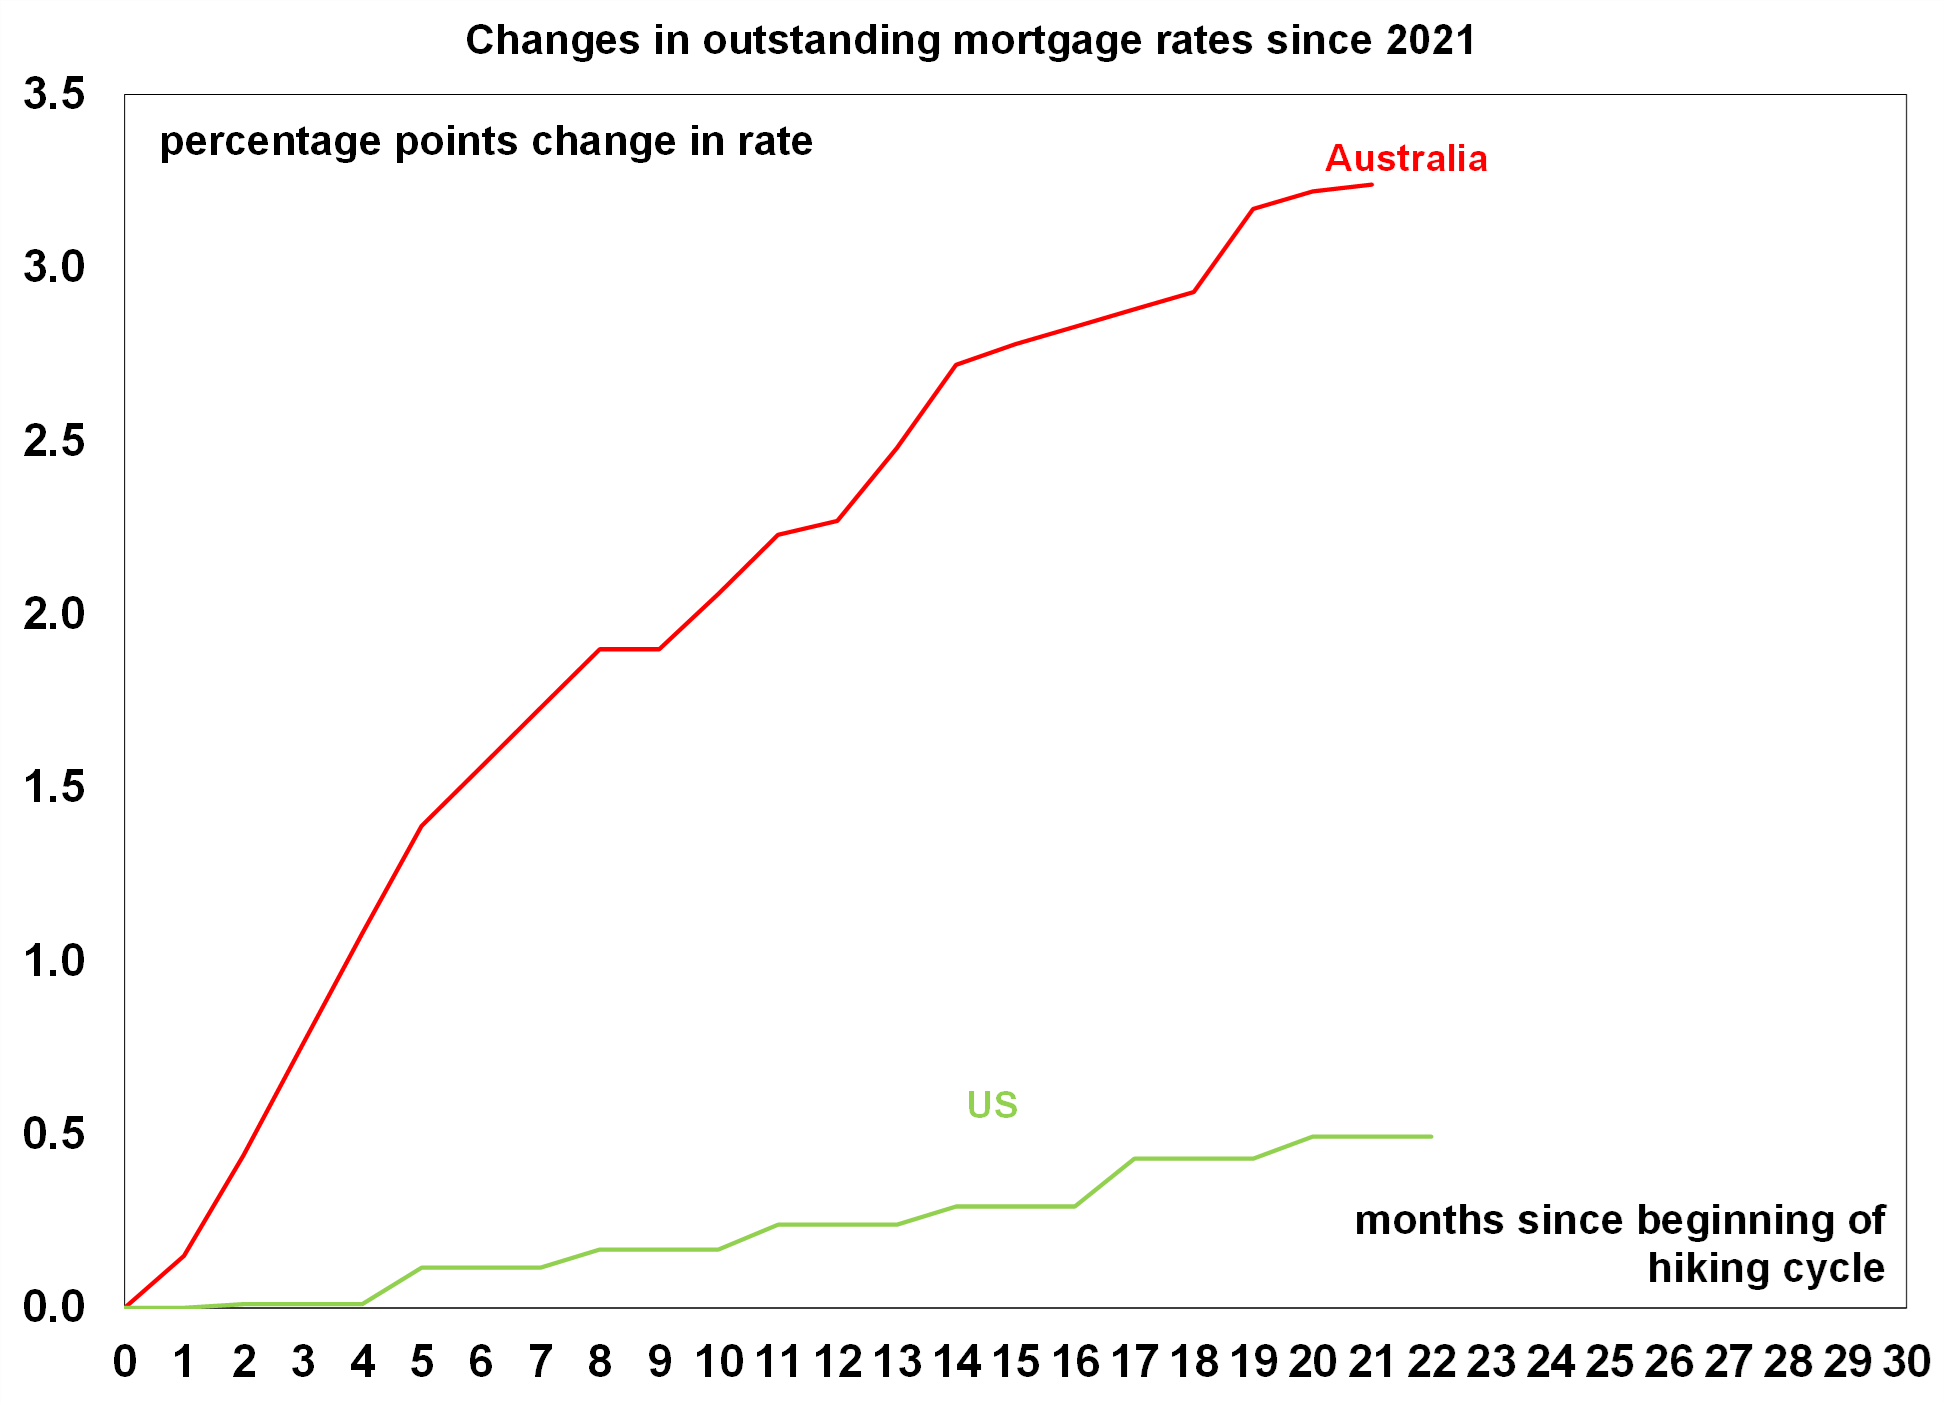
Source: Macrobond, AMP
As a result, households are in worse shape in Australia than the US. Australian retail volumes have been negative (in annual terms) since April 2023 while US retail volumes have been positive since mid-2023. Australian real household disposable income was deeply negative (at 6.1%) over the year to Q3 2023, while US income was up by 2.6%. Australian consumer confidence has been in recessionary-like levels for 26 months, while US consumer confidence readings have better. A softer consumer weighs on spending and inflation.
2. Wages growth never increased as much in Australia as it did in the US. High US wages growth is keeping US services inflation elevated. The Australian supply of labour (the participation rate) lifted to a record high after the pandemic, keeping a lid on wages growth. The US participation rate fell after the pandemic and has not recovered to its pre-Covid level as many left the workforce permanently, leading to a lift in wages growth.
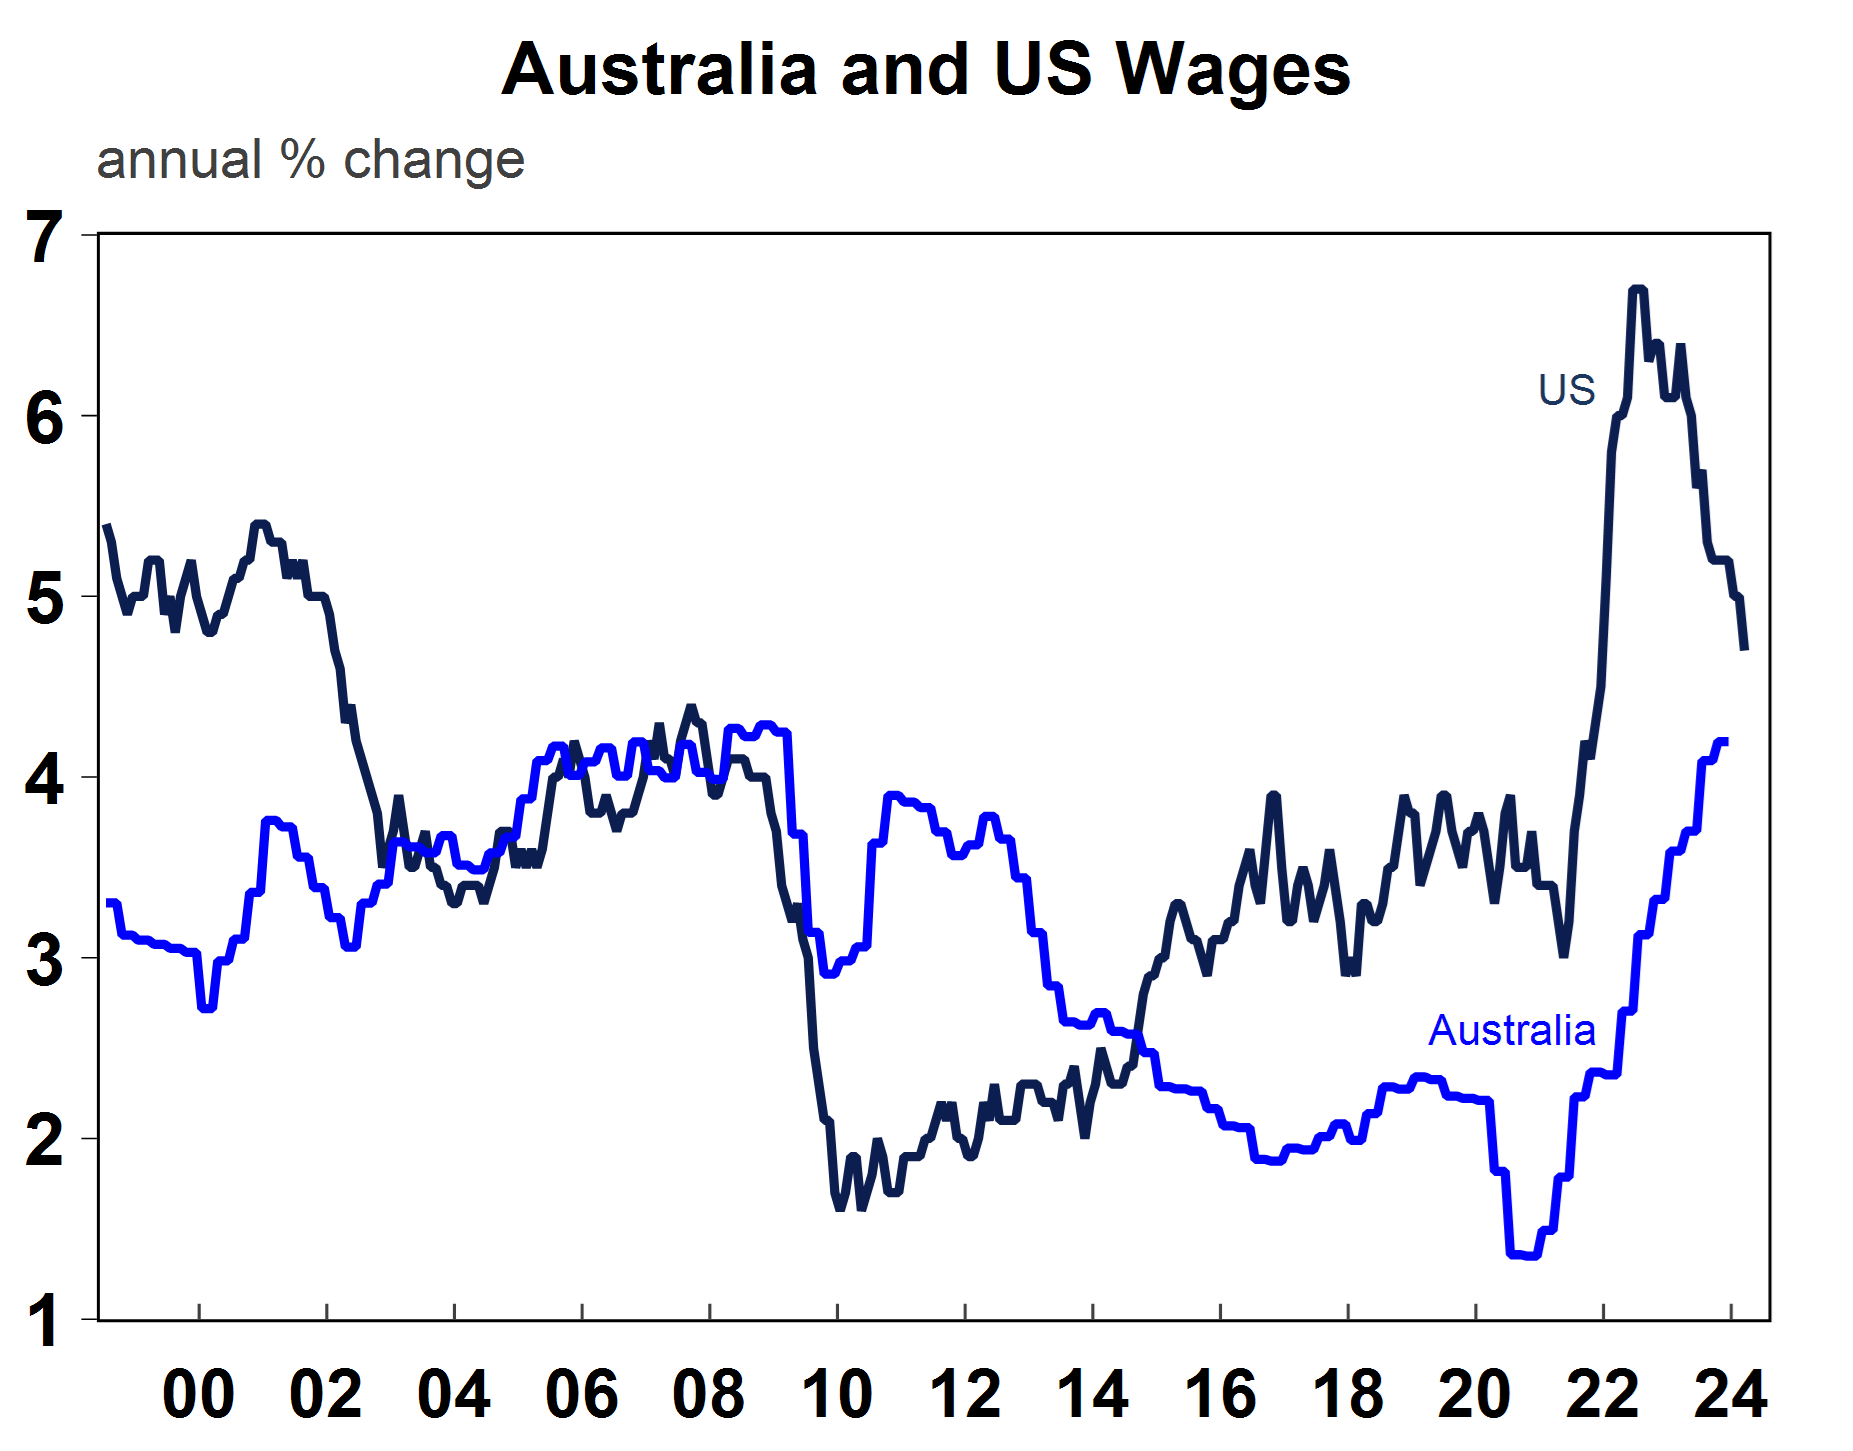
Source: Macrobond, AMP
US wages growth has slowed from its highs but needs to be between 3-4% (per annum) to be compatible with the 2% inflation target. Australian wages growth has also risen to its highest level since 2009 as a result of high wage increases awarded to those on awards, enterprise bargaining agreements and minimum wages (which sum to 60% of the workforce) and a lift in private sector individual agreement wages from a tight labour market. In Australia, the same increase to minimum, award and enterprise agreements is unlikely to be awarded this year and the unemployment rate is expected to lift as labour demand has slowed. Softer wages growth in 2024 will see a softening in services inflation.
3. There are measurement differences in inflation. The US CPI data has a high weighting to “shelter” (at 33%) which includes both rents and “owner’s equivalent rent” which is how much you would pay yourself to live in your own dwelling. In Australia, only rents are included (with a weight of 5.8%), as payments for a mortgage are considered an asset and home owner costs are measured as dwelling costs.
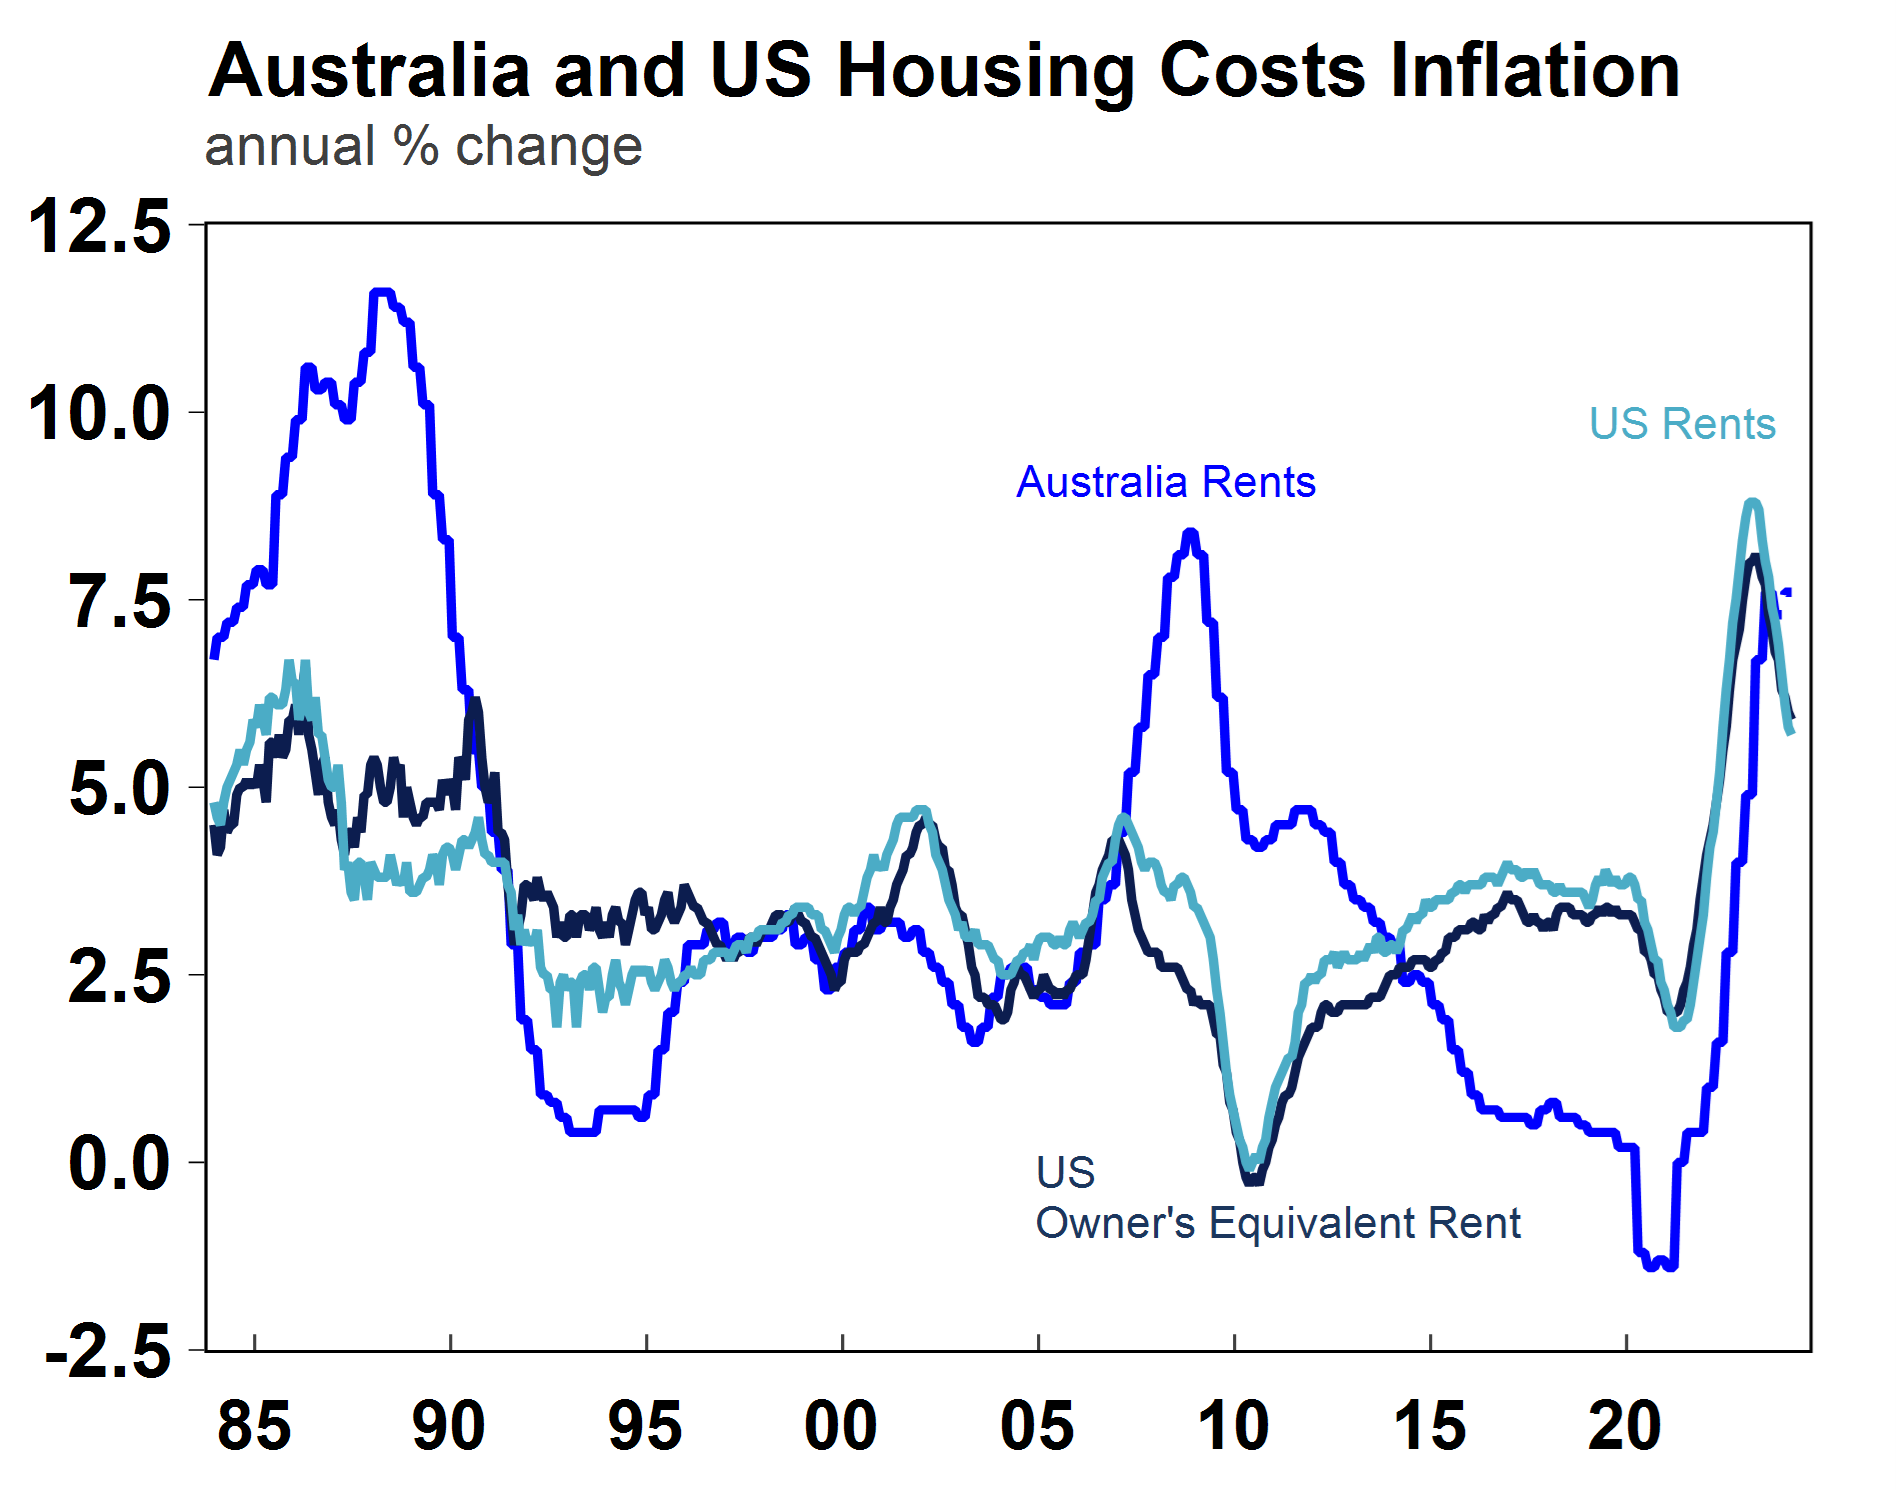
Source: Macrobond, AMP
Both rents and owner’s equivalent rent have had high inflation in the US (as per the previous chart). If Australia had a higher weighting to rents, then services inflation would remain higher for longer, as very elevated Australian population growth is keeping rental inflation high.
4. US price surveys have turned up (see the chart below) across business surveys and leading indicators like PMIs.
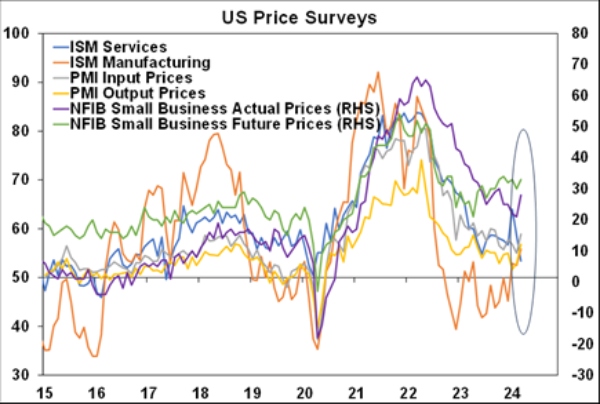
Source: Bloomberg, AMP
But in Australia, they have been trending down lately (see the chart below).
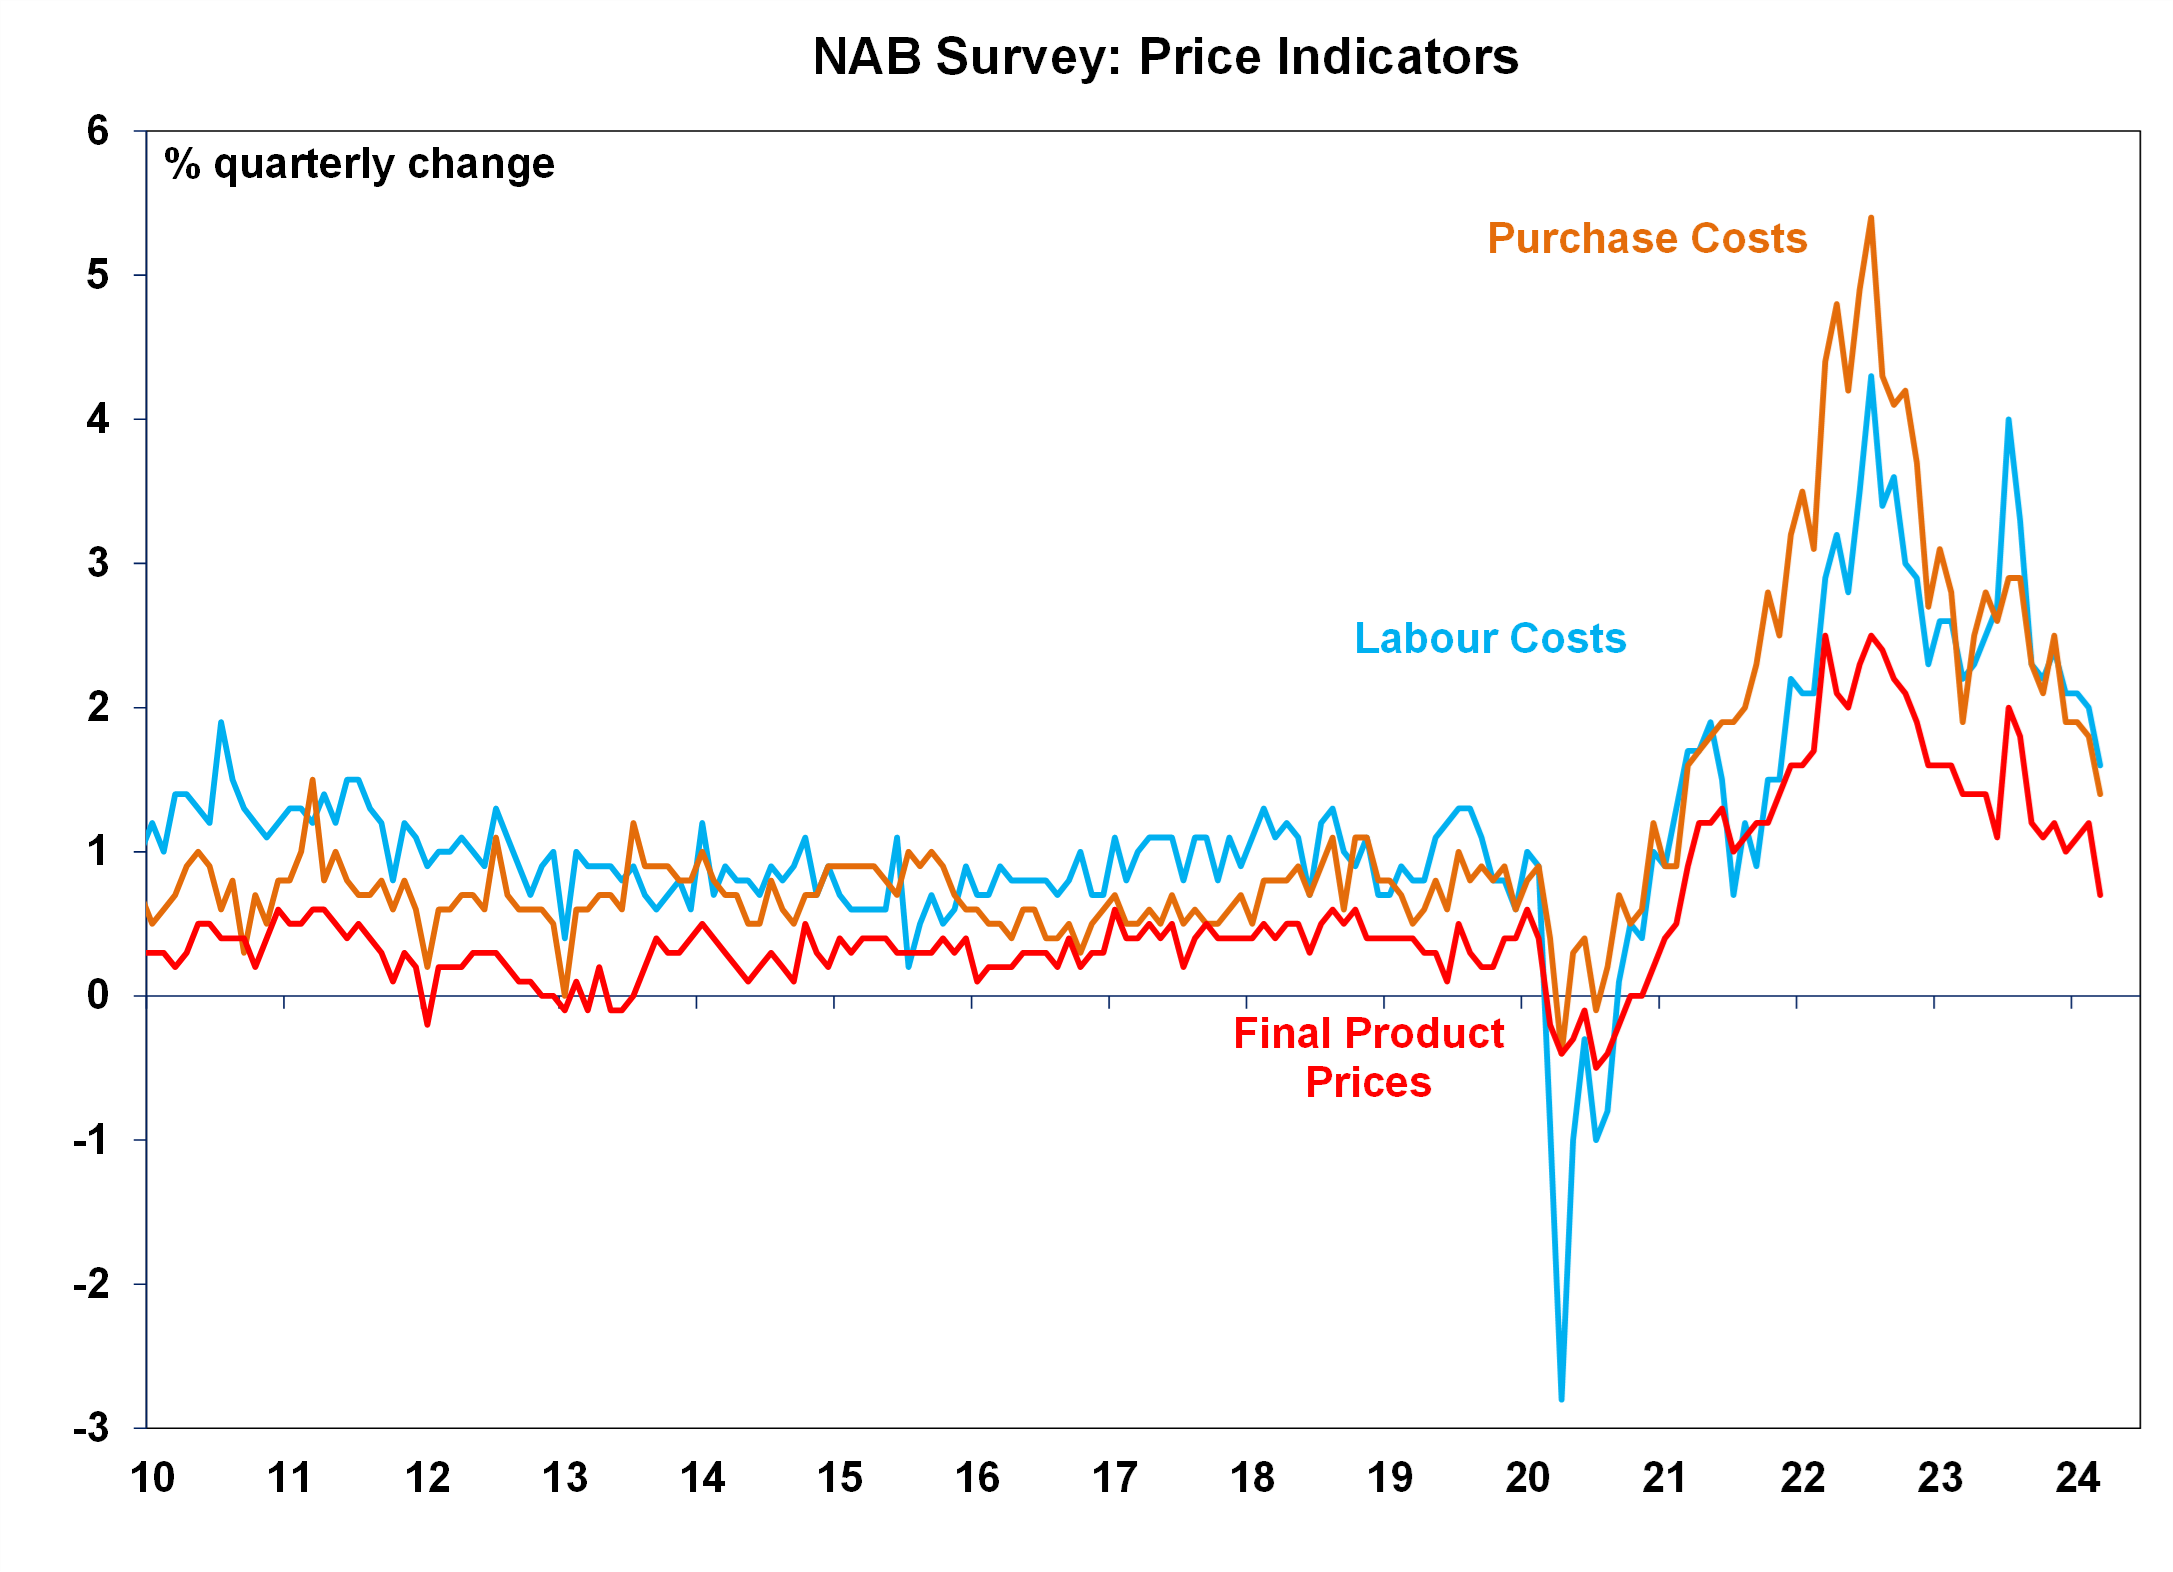
Source: Bloomberg, AMP
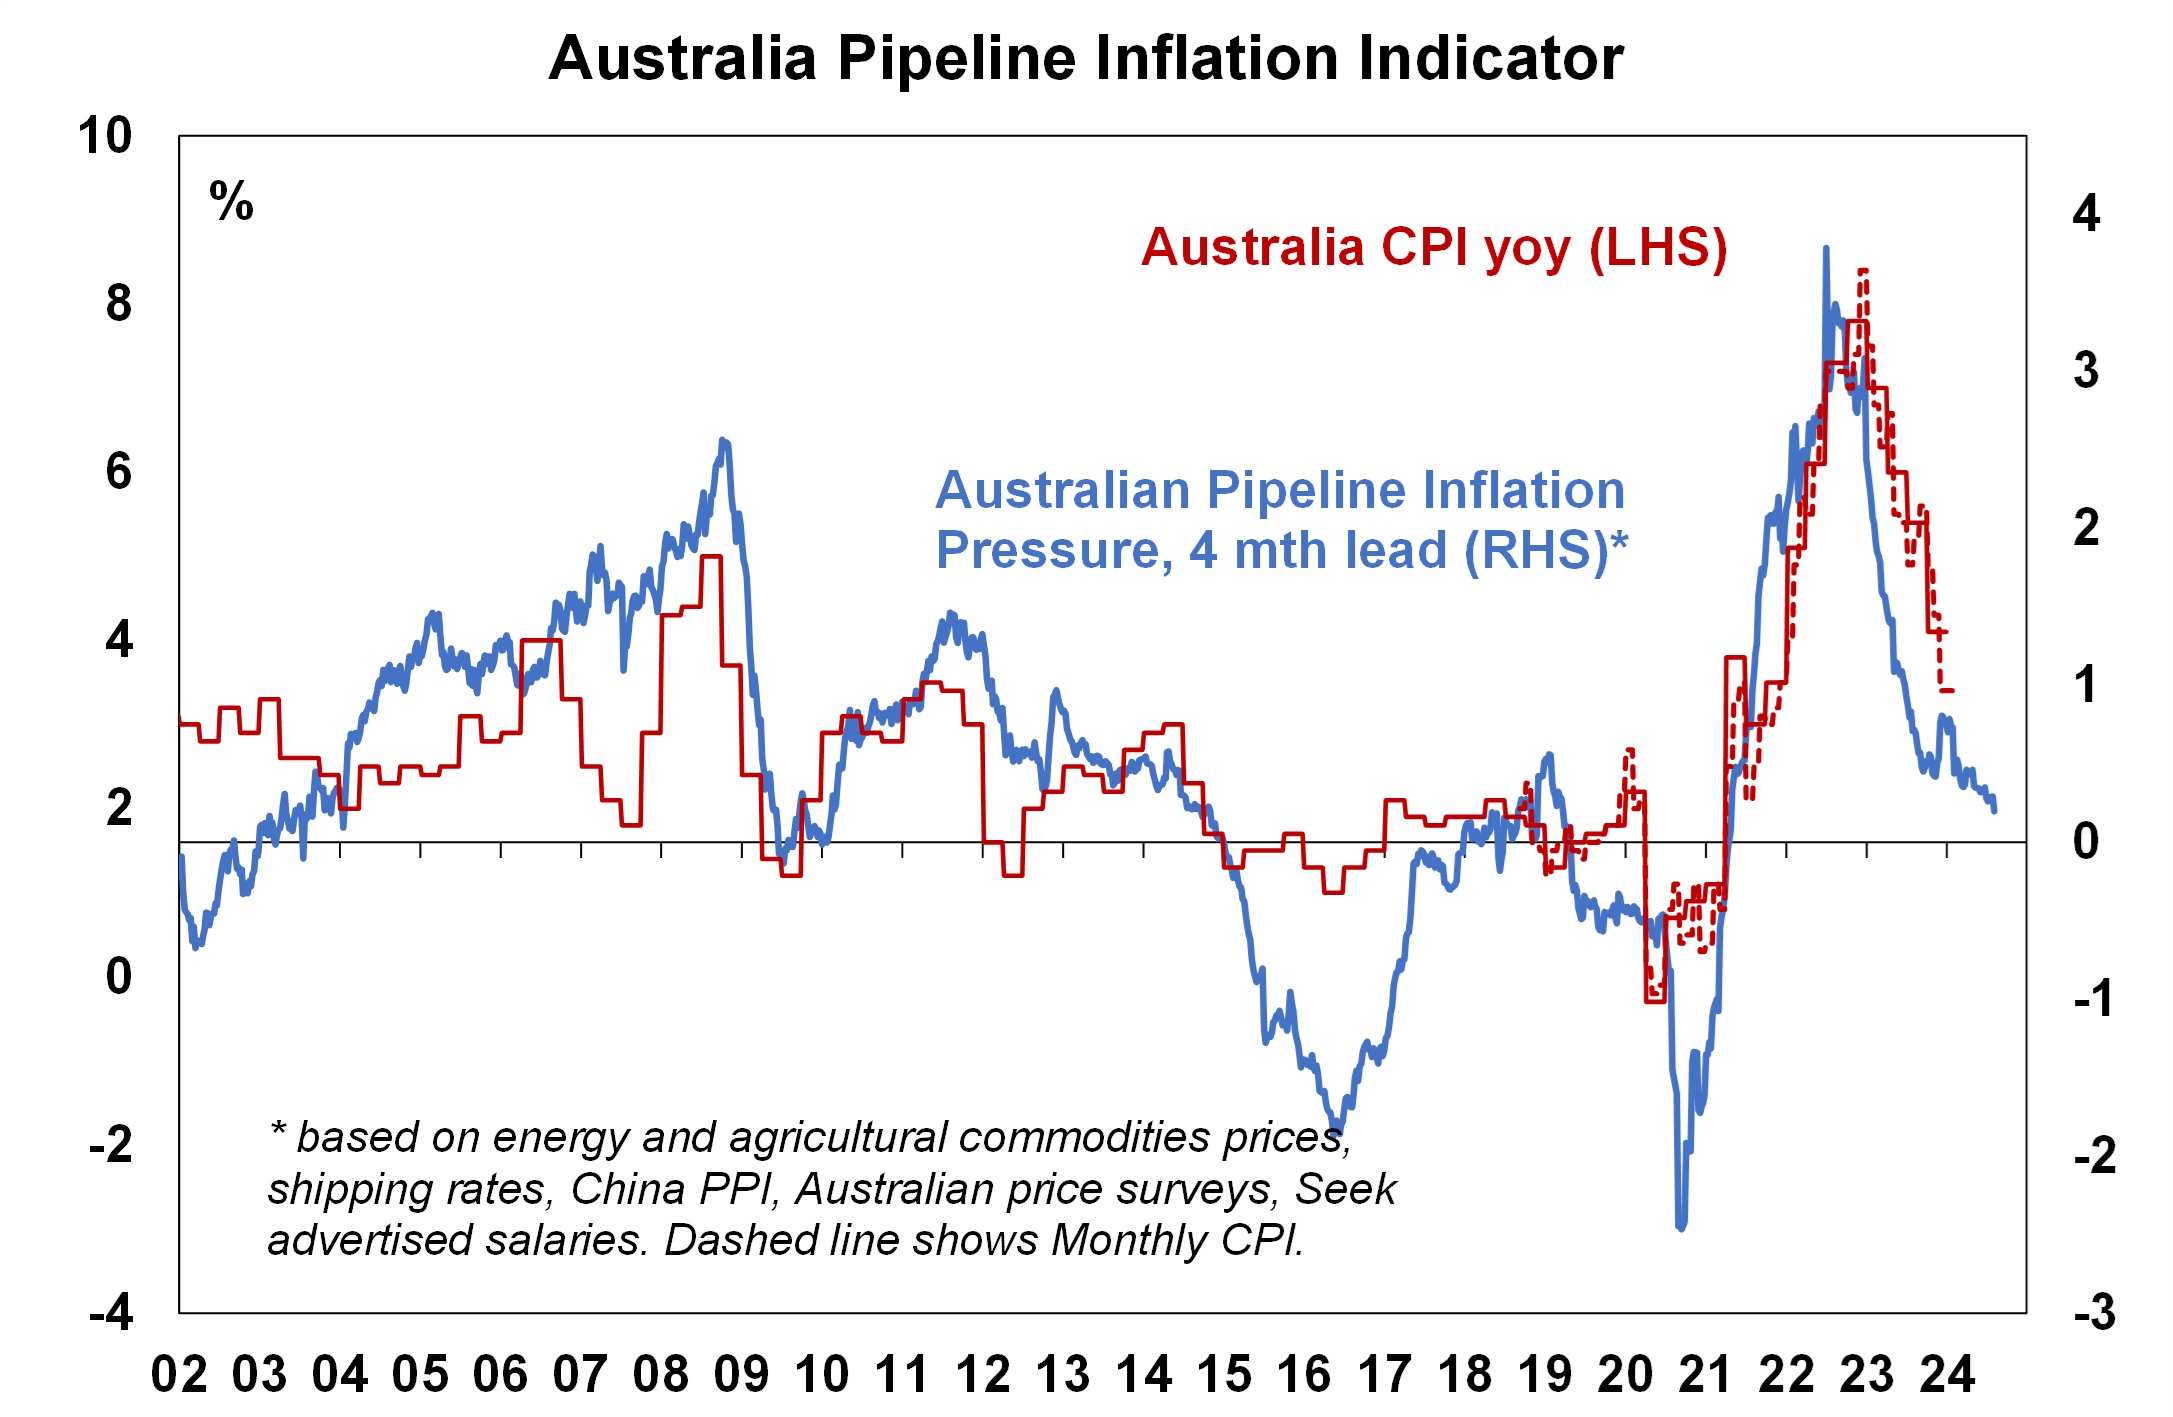
5. And finally, when we look at our Australian pipeline indicator, there is still a further slowing in inflation likely to occur, whereas progress in the US inflation indicator has stalled.

Weekly market update 26-07-2024
26 July 2024 | Blog Dr Shane Oliver discusses the risk off as tech hit continues; correction risks into August/September; global rate cutting cycle underway; Australian June quarter CPI to rise but the hurdle to another RBA rate hike should be high; and more. Read more
Oliver's insights - rise of populism and bigger government
24 July 2024 | Blog This article takes a look at the rise of populism and what it means for economic policies and investors. Read more
Weekly market update 19-07-2024
19 July 2024 | Blog This week shares are down; US election/Trump prospects starting to impact; global rates easing cycle on track; China Plenum; Australian jobs still tight but easing so RBA needs to be careful; and more. Read moreWhat you need to know
While every care has been taken in the preparation of this article, neither National Mutual Funds Management Ltd (ABN 32 006 787 720, AFSL 234652) (NMFM), AMP Limited ABN 49 079 354 519 nor any other member of the AMP Group (AMP) makes any representations or warranties as to the accuracy or completeness of any statement in it including, without limitation, any forecasts. Past performance is not a reliable indicator of future performance. This document has been prepared for the purpose of providing general information, without taking account of any particular investor’s objectives, financial situation or needs. An investor should, before making any investment decisions, consider the appropriateness of the information in this document, and seek professional advice, having regard to the investor’s objectives, financial situation and needs. This article is solely for the use of the party to whom it is provided and must not be provided to any other person or entity without the express written consent AMP. This article is not intended for distribution or use in any jurisdiction where it would be contrary to applicable laws, regulations or directives and does not constitute a recommendation, offer, solicitation or invitation to invest.
The information on this page was current on the date the page was published. For up-to-date information, we refer you to the relevant product disclosure statement, target market determination and product updates available at amp.com.au.