


Key points
- The commonly held idea that Australia is heavily reliant on the Chinese economy has been challenged over recent years as Australia has managed to grow its trade surplus despite a sizeable decline in exports to China.
- The share of Australian goods exports to China has fallen from a peak of 42% in 2021 to its current level of 33%. But, Australia’s trade balance is averaging around double its pre-COVID levels. High commodity prices have helped to offset some slowing in commodity export volumes.
- Current high commodity prices will not be able to permanently offset longer-term slower commodities demand from China as its potential GDP growth declines to 4% from its 2006-10 average of 10%. However, there will be other offsets as China’s urbanisation rate has further to rise and as Australia remains a preferred supplier of iron ore given its higher quality and its subject to less delays compared to the other major producer Brazil. Australia’s other major iron ore importers of Japan, South Korea and Japan could also take up the slack from lower Chinese demand.
- Chinese tourism arrivals are still less than half of their pre COVID levels but this has not had a particularly negative impact on the tourism economy.
- Financial markets still see Australia as a proxy to China, especially when it comes to the Australian dollar.
Introduction
It is commonly accepted that Australia is highly dependent on the Chinese economy because of demand for Australian mineral resources and agriculture. Does this mean that the recent weakness in the Chinese economy will also weigh down on Australian economic growth? We look at these issues in this edition of Econosights.
The backdrop
China has been Australia’s top trading partner since late 2009. Goods exports to China lifted to a peak of 42% of total goods exports in 2021 and have slowed to 33% (see the chart below). The decline in exports to China over the past two years reflects the trade tensions between Australia and China which impacted around $23billion (or 4.5% of total exports) worth of goods (which were mostly agricultural and coal exports and some of which have now been reversed), COVID-19 lockdown disruptions which reduced Chinese import demand and a softening in Chinese growth. Despite the fall in exports to China since mid-2021 Australia’s trade surplus has averaged $11billion over 2023, roughly double its value compared to pre-COVID levels.
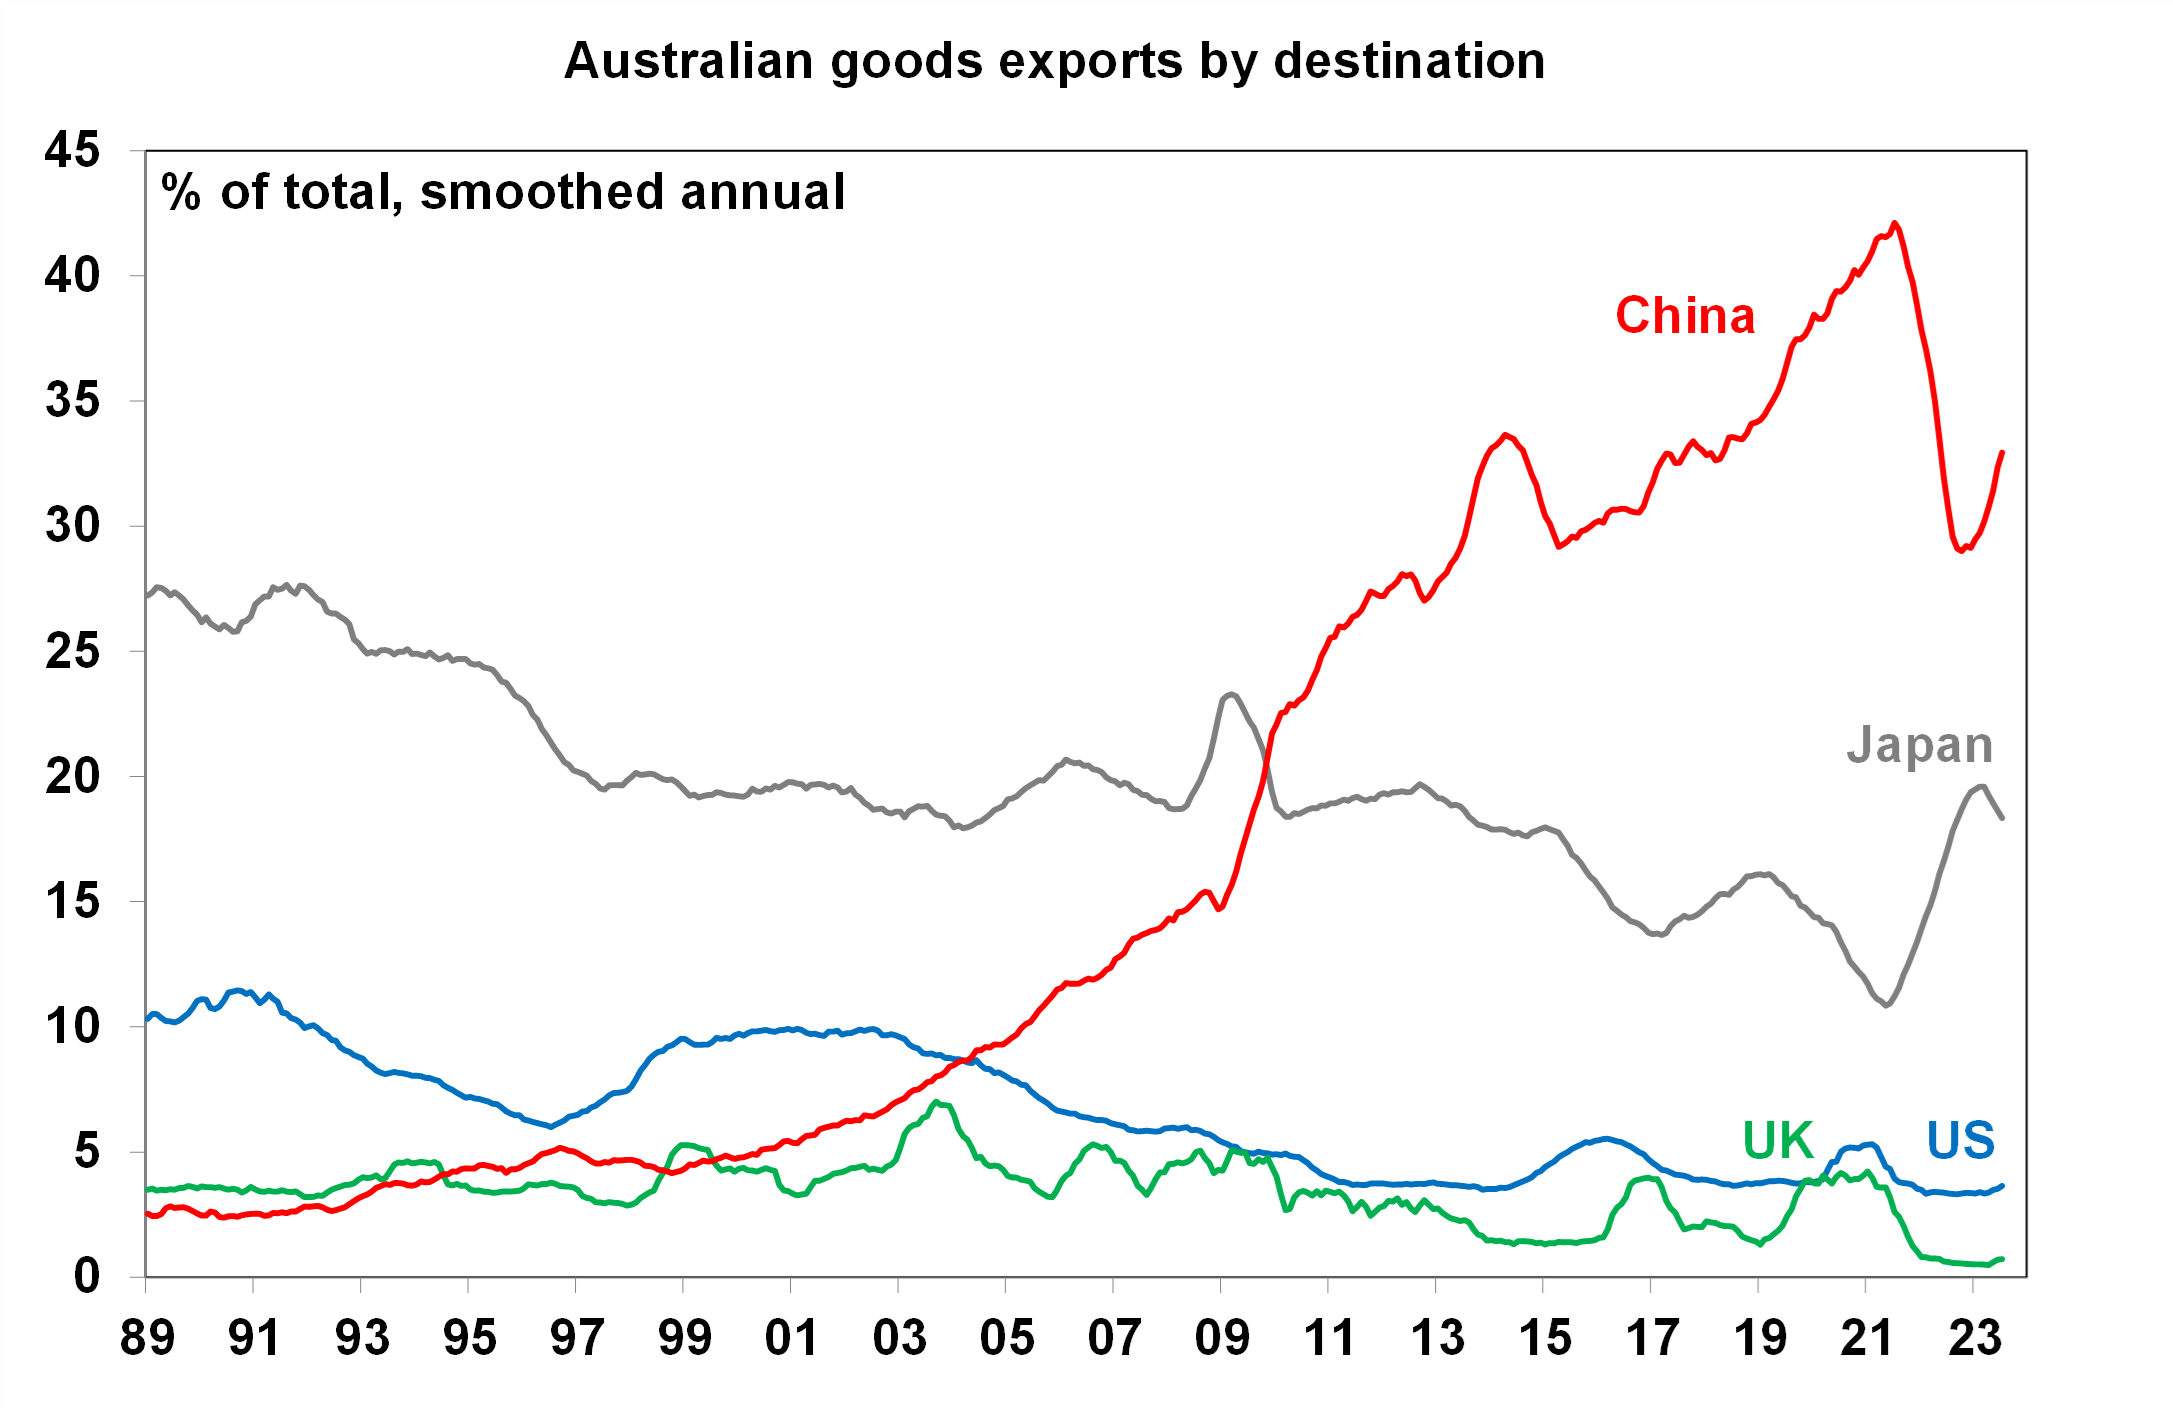
Source: ABS, AMP
Australian commodity exports
Commodity exports to China are the main link to the Chinese economy (see the chart below) and are worth over 5% of GDP to Australia in nominal terms.
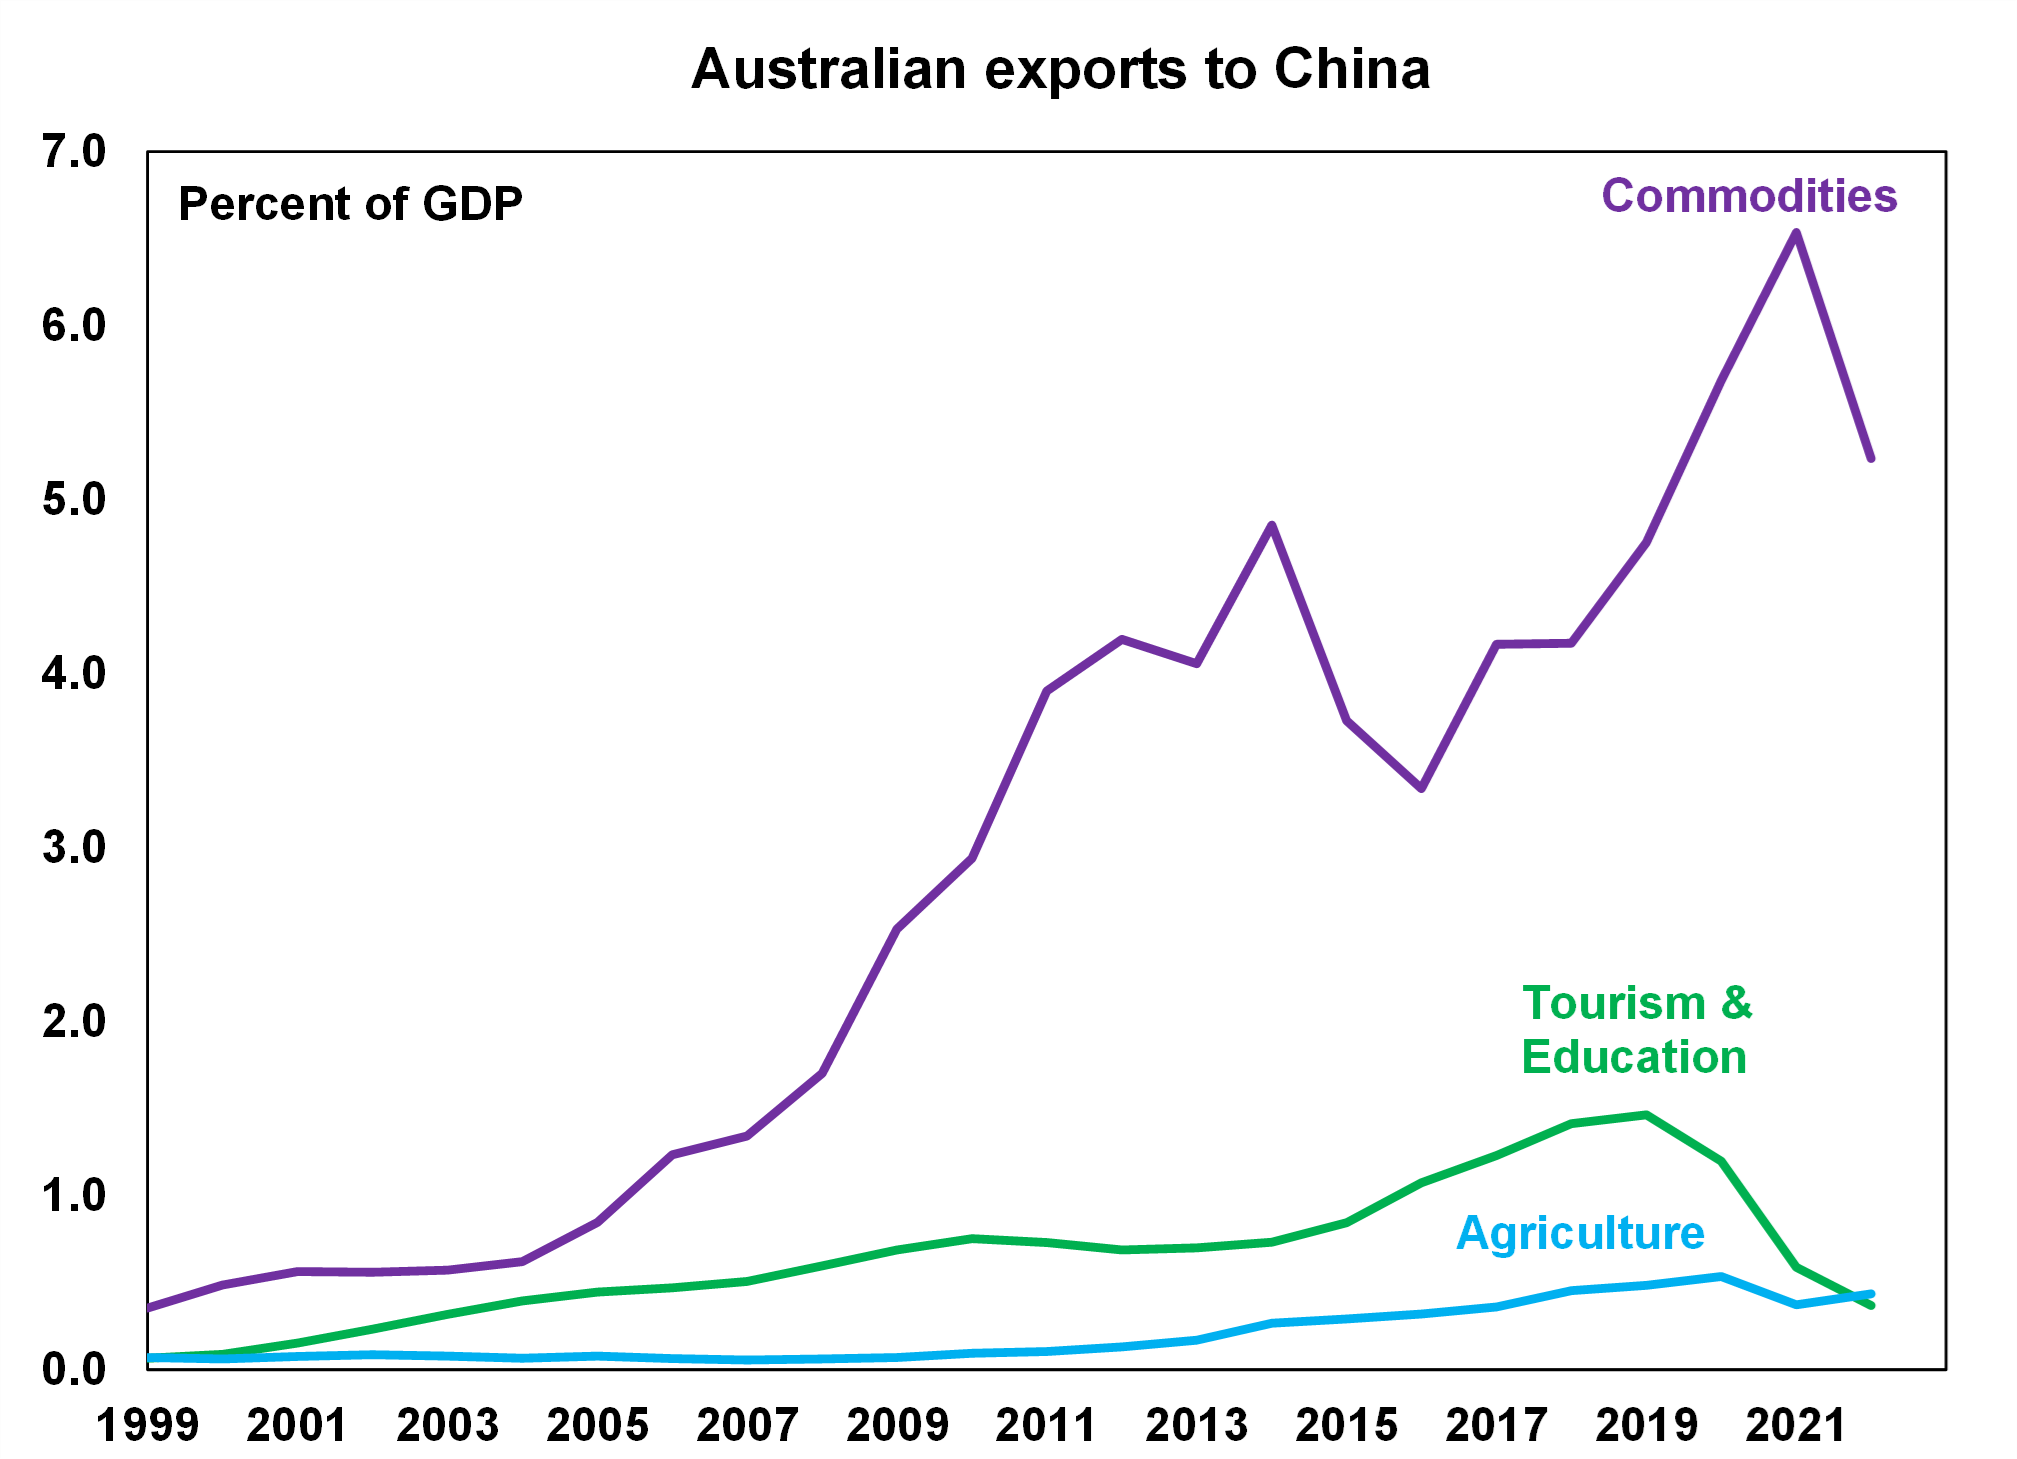
Source: ABS, AMP
The major commodities that Australia exports to China are iron ore (which is Australia’s single largest export, at around 22% of total exports which China uses to make steel for buildings, infrastructure and consumer products like electric vehicles), coal and Liquified Natural Gas (LNG). Australian commodity exports have benefitted from strong economic growth in China in the decade prior to the pandemic. The volume of iron ore exports peaked at 10% of GDP in 2020 and have declined to 8.5% of GDP. But, iron ore prices have remained high which has boosted the trade balance and helped to offset the decline in export volumes. China’s potential economic growth is expected to be soften over the next few years to 4% versus the 10% the world was used to in 2006-10 and growth in commodity-intensive sectors like construction and infrastructure will be under strain which is negative for iron ore demand. However, there may be some offset. China’s urbanisation rate has further to increase from its current level of 64%, as it is well below advanced economies which tend to be over 85%. Australia also has an advantage of being a high-quality producer of iron ore and is subject to less delays and strikes and closures compared to the other major iron ore producer, Brazil or even China’s own iron ore sector. Australia’s other major iron ore importers of Japan, South Korea and Taiwan may also be able to absorb some of the slack from lower Chinese demand. As well, China’s economy is much bigger than it was in 2006-10 when it was growing at 10%, so the pace of growth to generate the same level of commodities demand is equivalent to around 4% GDP growth now.
Revenue from commodity exports also have an important bearing on the Federal government’s budget revenue. The strength in commodity prices over the past year lifted corporate tax revenue and the stronger labour market which boosted payrolls tax receipts which has been one of the reasons that Australia’s 2022-23 budget outcomes are running well above estimates and we ended up with a budget surplus of 0.9% of GDP in 2022 23. Conservative Treasury estimates of commodity prices, which are running above projections also mean that there is upside risk to Federal budget projections. Better budget outcomes give the government room to lift spending (although the current high inflation period indicates that this would be unwise at the moment).
Chinese arrivals into Australia
Before the pandemic, Chinese arrivals were the top source of short-term arrivals into Australia, alongside New Zealand (see the chart below). Short-term arrivals (those coming for less than a year) are still around 30% below their pre-COVID levels but Chinese arrivals are still less than half of their pre-pandemic levels, so have much further to go to get back to normal.
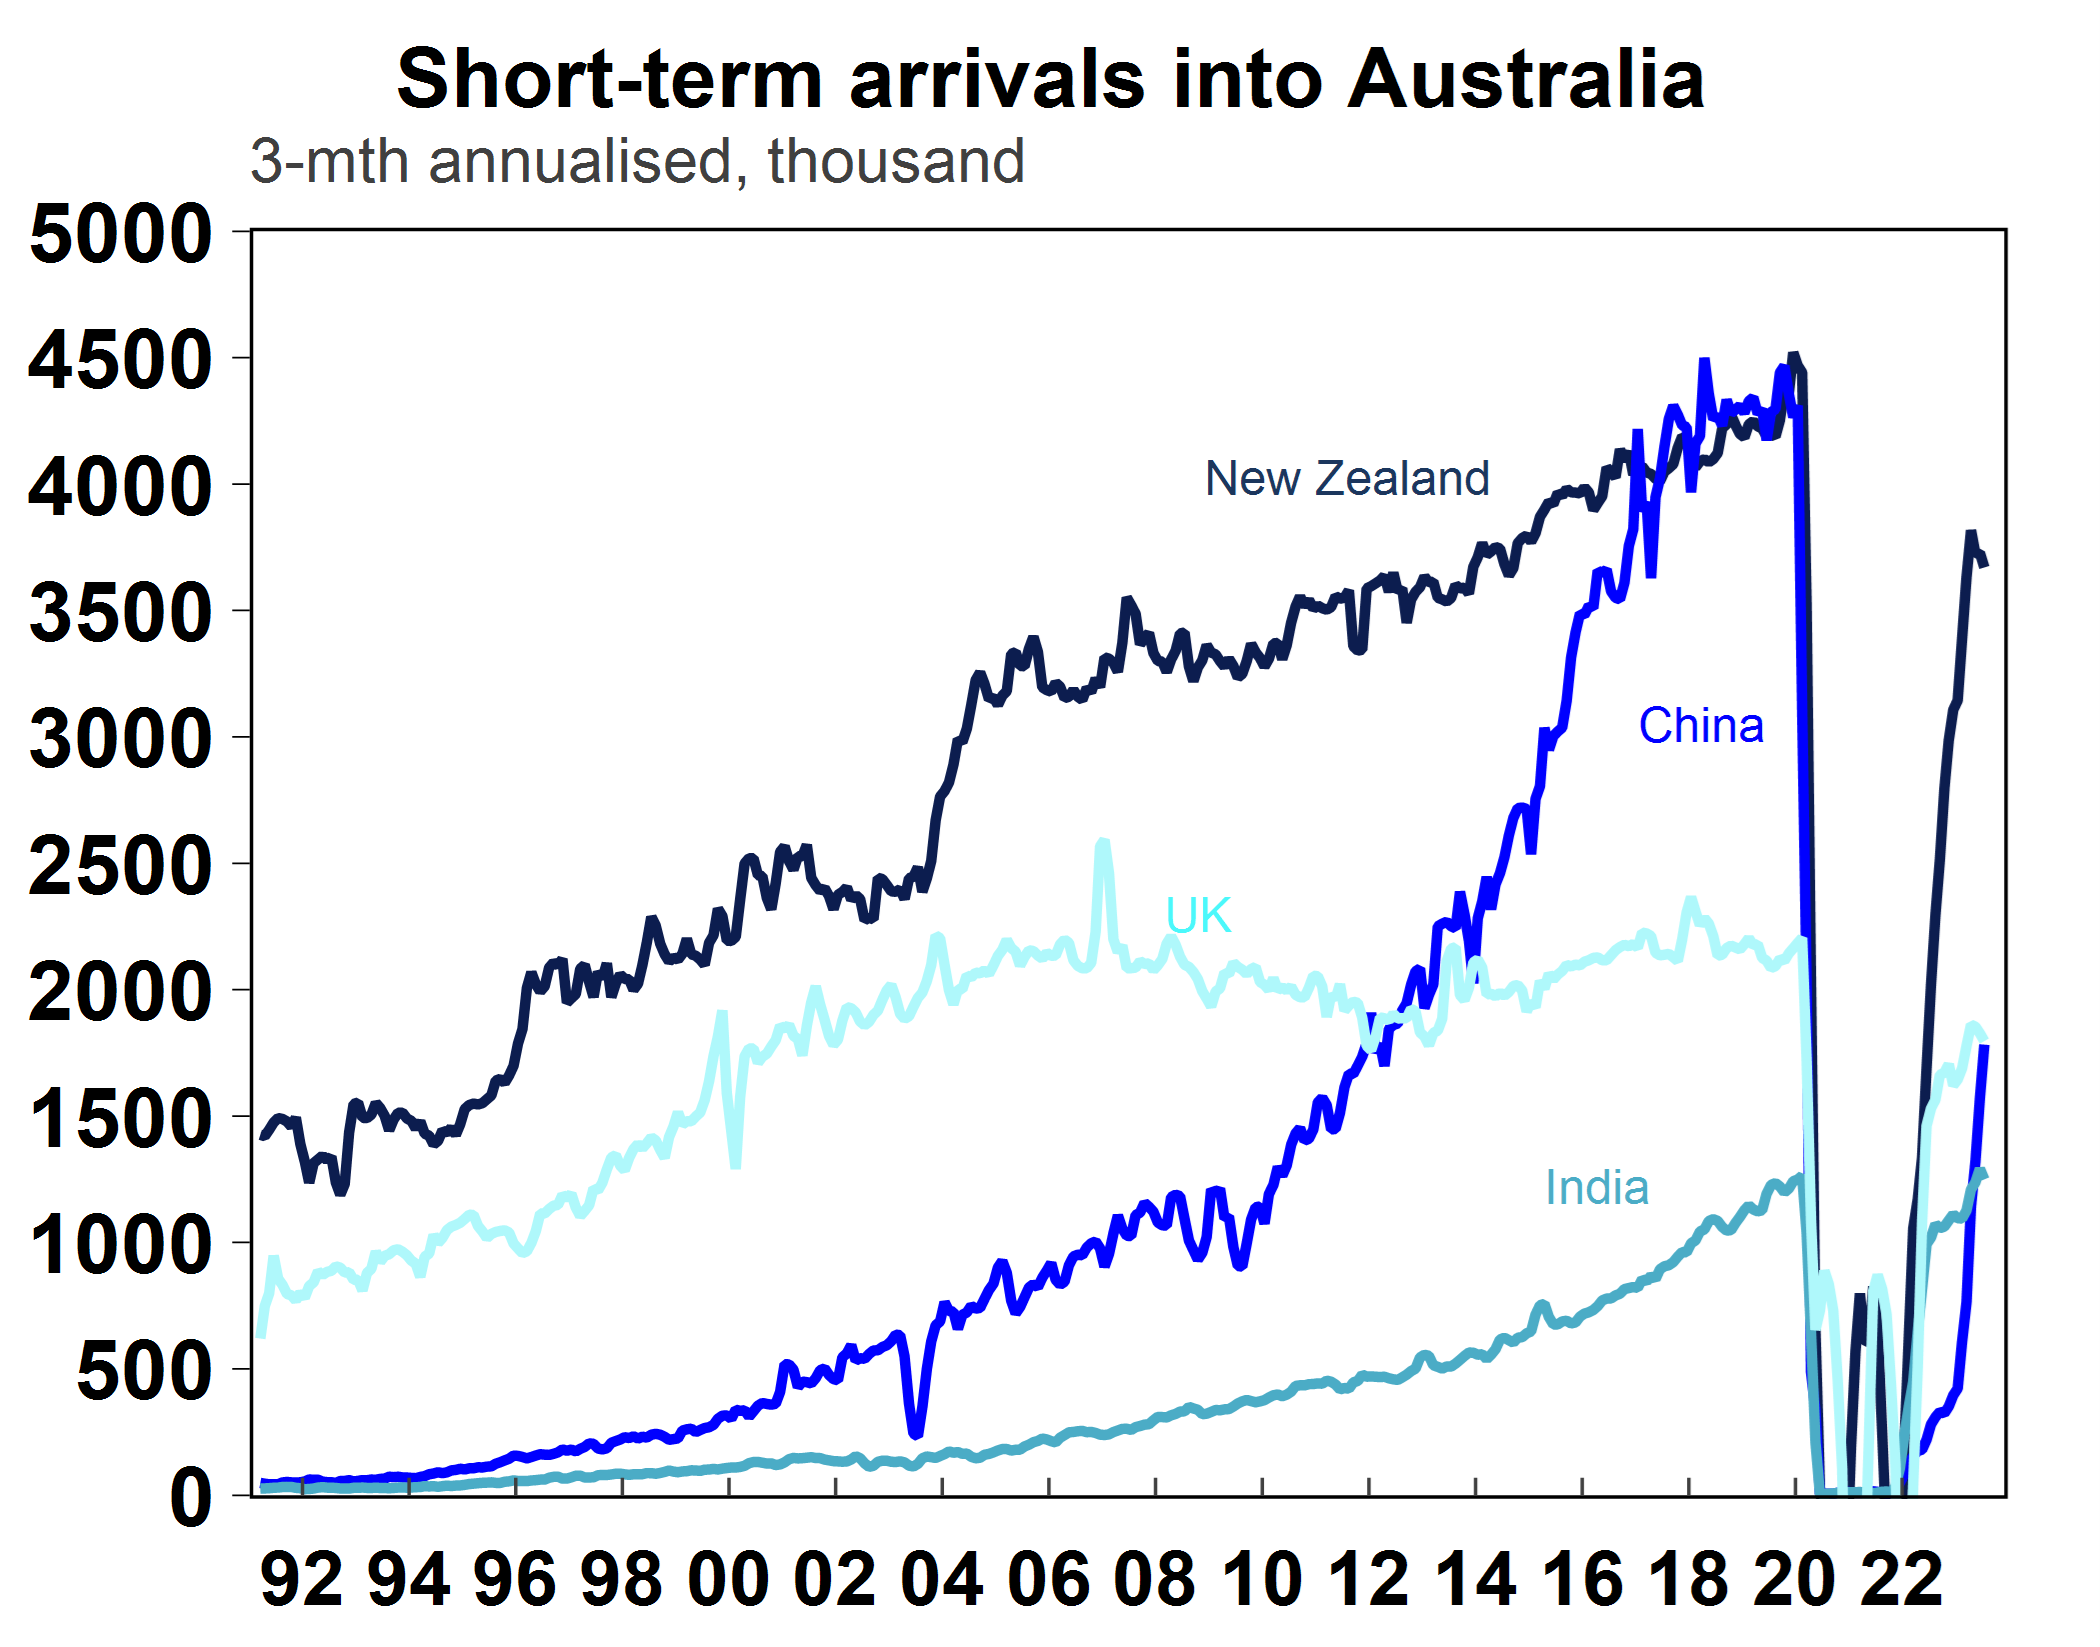
Source: Macrobond, AMP
Despite this short-fall of Chinese arrivals, the impact on tourism has not been disastrous, as employment in the tourism sector in areas like accommodation and food services, retail and arts and recreation have held up well over the past year. The lack of Chinese short-term arrivals has been offset by high holiday spending by Australians and a high level of permanent migration into Australia with current net overseas migration running around 500,000 or more – a record high.
Chinese students have been the major country group of education arrivals into Australia since 2005 (see the chart below). The pandemic has led to some drop-off in Chinese students, but the impact has not been as large compared to tourism which has helped to support the higher education sector.
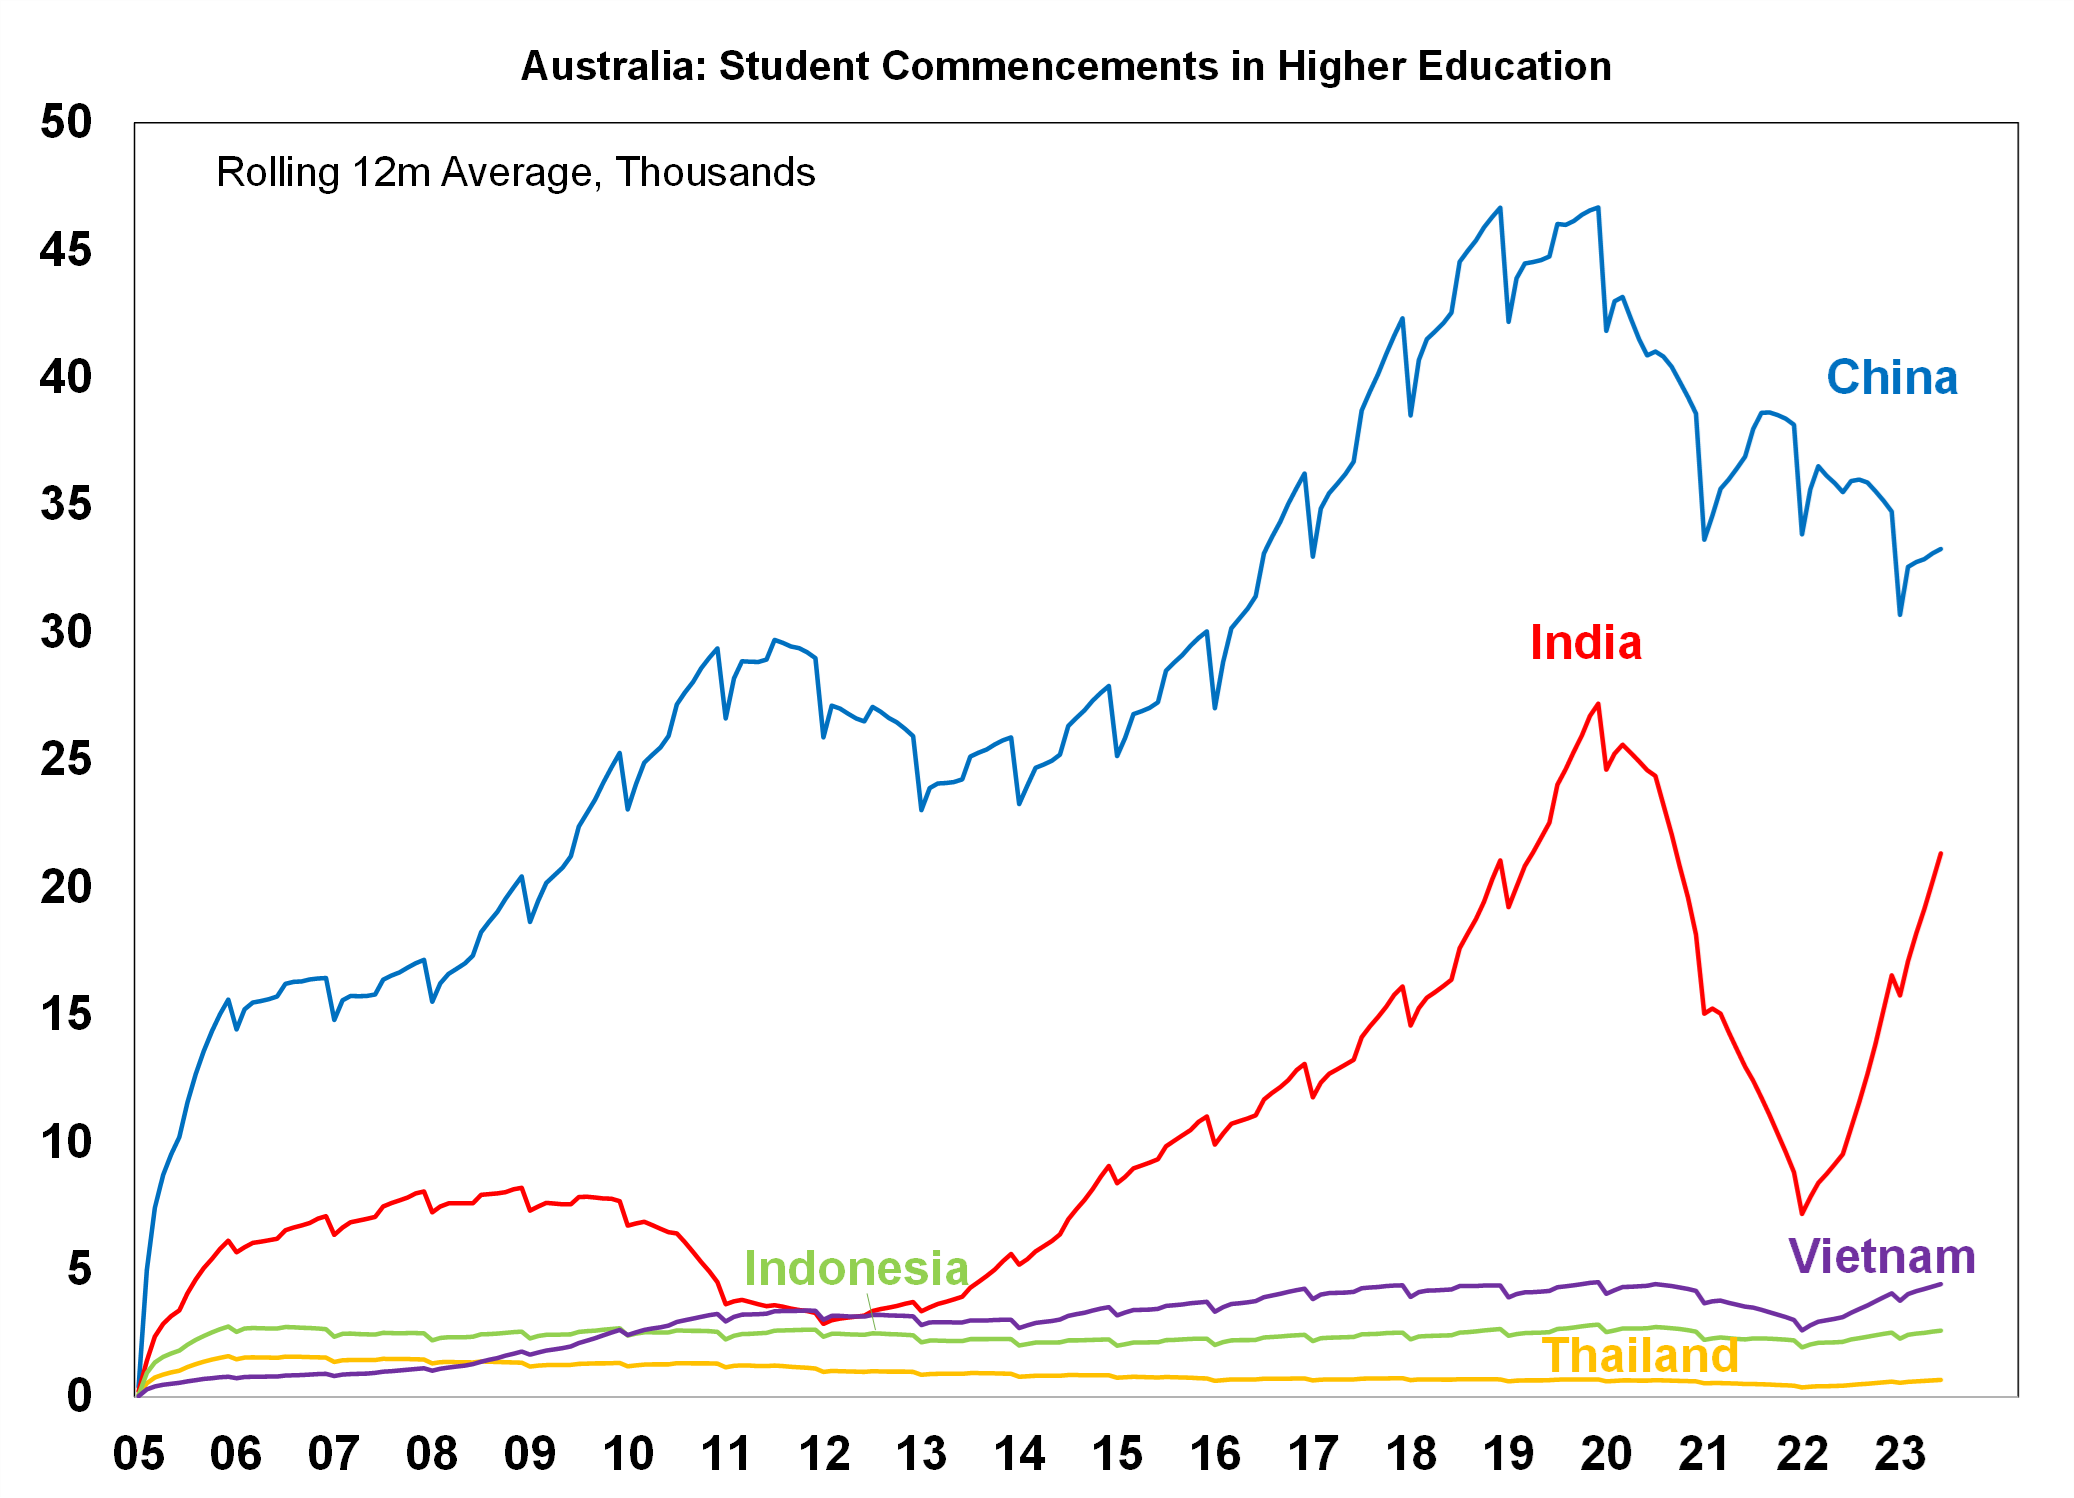
Source: Bloomberg, AMP
The outlook for China
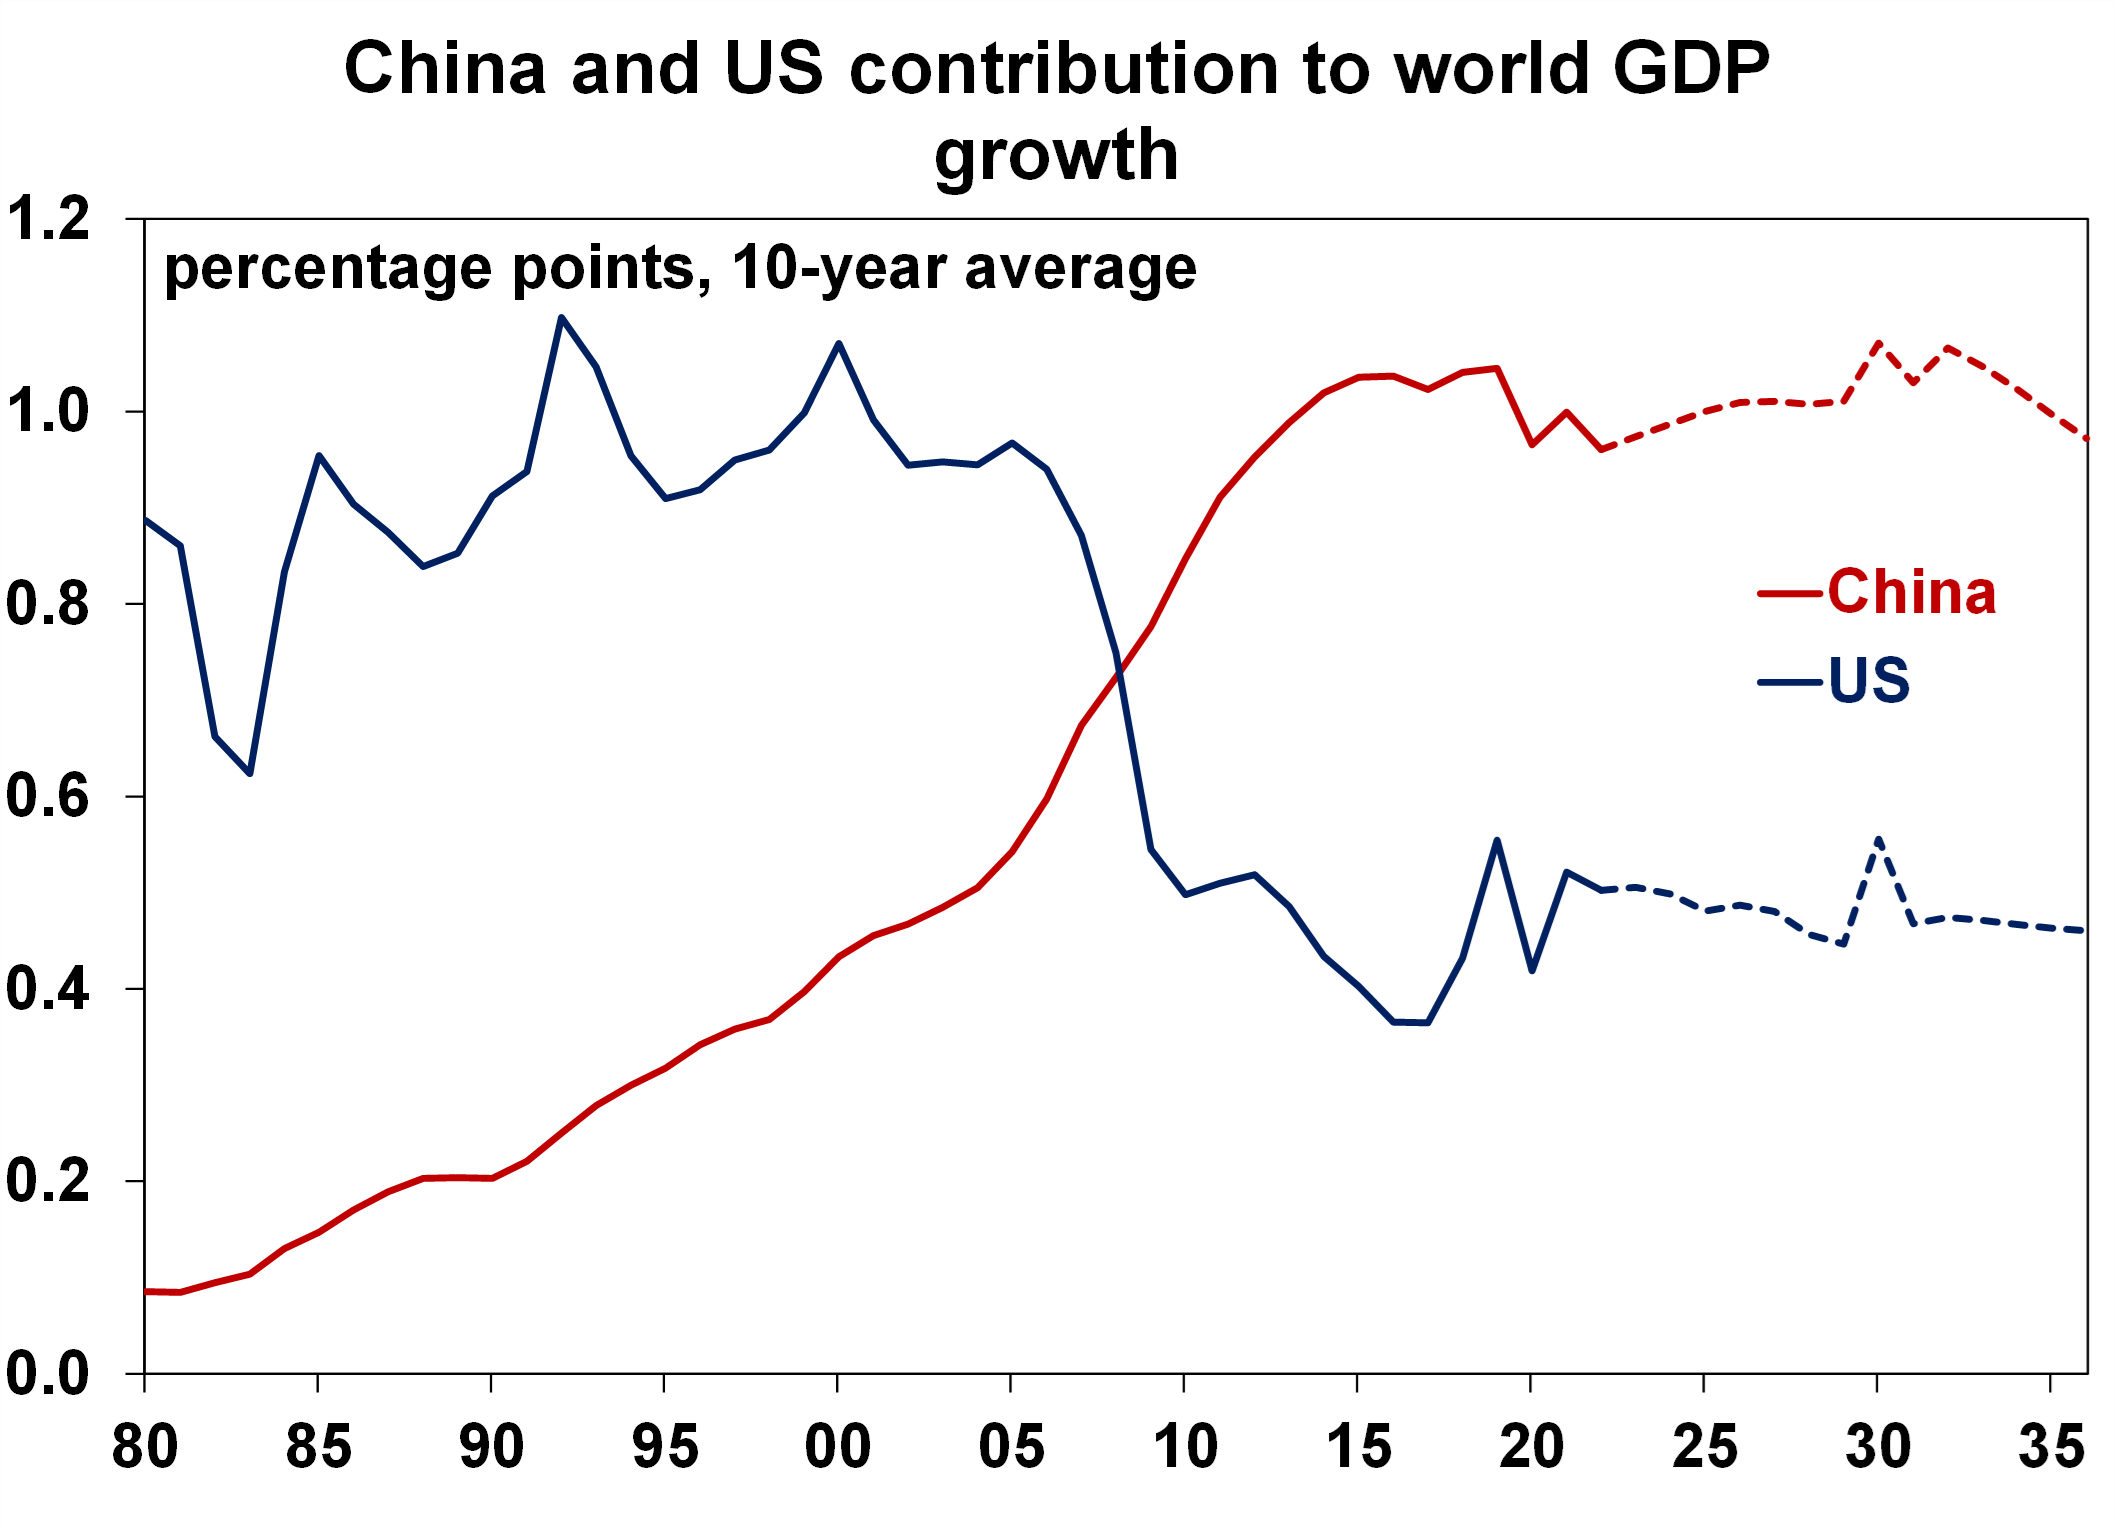
There are numerous long-term structural forces that will result in lower Chinese GDP growth over the next few years of around 4% now and 3% next decade. This is compared to the 10% rate the world grew accustomed to in 2006-10 due to high debt levels in China, an oversupply of property, an aging population and slowing productivity growth. This means that China will make a lower contribution to world GDP relative to its recent outcomes and this will result in lower potential world economic growth. The potential pace of global growth is around 3% or slightly above per annum but with lower contribution from China, this will slow to 2.5-2.7% per annum without another growth driver offsetting the decline from China. This means that other countries, including Australia will be impacted by slowing demand from China.
Source: Bloomberg, AMP
Implications for investors
From a financial market point of view, the Australian dollar is sensitive to outcomes in the Chinese economy. The 5% depreciation in the currency since early 2023 partly reflects concern about the Chinese economy. The impact on shares from softer Chinese growth has been mixed. Australian shares have been close to flat throughout 2023, underperforming global peers in the US and Europe, and reflect poorer earnings growth, an economy that is more sensitive to interest rate changes compared to most of our peers and some negative impact to resource companies from lower Chinese demand.
The flexibility in Australia’s economy to manage to offset the weakness in Chinese economic growth indicates that Australia may not be as tied to Chinese economic growth as is commonly accepted.

Oliver's Insights - seasonal patterns in shares
06 May 2024 | Blog This article looks at seasonal patterns in shares and whether its time to “sell in May and go away” along the lines of the old share market saying. Read more
Weekly market update 03-05-2024
03 May 2024 | Blog Fed less hawkish than feared; US stagflation or just getting back on track?; RBA to hold, with a tightening bias; Aust consumer remains weak; Aust budget preview. Read more
Econosights - positive supply shocks
02 May 2024 | Blog Post pandemic, the supply of labour has increased in many major economies, including the US and Australia, through elevated immigration and a lift in the participation rate to a record high. Read moreWhat you need to know
While every care has been taken in the preparation of this article, neither National Mutual Funds Management Ltd (ABN 32 006 787 720, AFSL 234652) (NMFM), AMP Limited ABN 49 079 354 519 nor any other member of the AMP Group (AMP) makes any representations or warranties as to the accuracy or completeness of any statement in it including, without limitation, any forecasts. Past performance is not a reliable indicator of future performance. This document has been prepared for the purpose of providing general information, without taking account of any particular investor’s objectives, financial situation or needs. An investor should, before making any investment decisions, consider the appropriateness of the information in this document, and seek professional advice, having regard to the investor’s objectives, financial situation and needs. This article is solely for the use of the party to whom it is provided and must not be provided to any other person or entity without the express written consent AMP. This article is not intended for distribution or use in any jurisdiction where it would be contrary to applicable laws, regulations or directives and does not constitute a recommendation, offer, solicitation or invitation to invest.
The information on this page was current on the date the page was published. For up-to-date information, we refer you to the relevant product disclosure statement, target market determination and product updates available at amp.com.au.