Key points
- The budget this year is expected to return to a surplus of $4bn thanks to a continuing revenue windfall.
- Key measures include cost-of-living support, more spending on aged care and a move to slow NDIS growth.
- Implications for inflation and hence the RBA are minimal.
- Despite savings measures structural budget deficits remain in the medium term as the revenue windfall fades.
AMP Head of Investment Strategy and Chief Economist Dr Shane Oliver and Deputy Chief Economist Diana Mousina explain what effects the Federal Budget could have on the Australian economy.
Introduction
This Budget yet again benefits from a huge revenue windfall allowing a surplus this year for the first time in 15 years and cost-of-living relief. At the same time, medium term deficits, while lower, remain leaving the budget vulnerable to anything that upsets the “rivers of gold” flowing to Canberra.
Key budget measures
Key measures, many of which were announced prior, include:
- $14.6bn over four years in cost-of-living support for mostly low to middle income households, including $3bn (shared with states) in one off energy bill relief for 5mn low-middle income households and 1mn small businesses, an additional $3.5bn to Medicare over 5 years to allow better access to GP’s through a lift in the bulk billing incentive, cheaper medicines, a boost to rent assistance, subsidies to move from gas to electric appliances, increased support for single parents costing $1.9bn over 5 years and a modest increase in Jobseeker with more for over 55s;
- increased spending on aged care partly flowing from a 15% pay rise for aged care workers which will cost $14.1bn over four years;
- a $20,000 instant asset write-off for small businesses;
- a ramp up in defence spending on missiles and submarines, offset by a reallocation of defence spending;
- some measures to help boost housing affordability – with tax changes to boost build-to-rent housing and wider access to the Home Guarantee Schemes;
- a lift in renewables investment through $2bn for the Hydrogen industry and incentives for developers to build “greener” houses;
- measures to support impact investing to tackle social problems;
- $498mn to crack down on vaping and reduce smoking.
Budget savings include:
- reform of the Petroleum Resource Rent Tax to raise $2.4bn over 4 yrs;
- extension of the GST compliance program, saving $3.8bn over 4 years;
- a 5% rise in tobacco excise raising $3.3bn;
- measures to slow NDIS growth to 8% pa from 13.8% currently;
- the 30% tax on super fund earnings where balances exceed $3mn;
- increasing the payment frequency of super and lifting compliance.
Economic assumptions
Changes to the Government’s forecasts have been modest with higher inflation and lower unemployment this financial year, but no changes to its forecasts for economic growth. It has revised up its wages forecasts for the next financial year and now sees the return of real wages growth in mid-2024. Unemployment is still seen as rising to 4.5% but doesn’t get there until mid-2025. We are a bit less optimistic on growth in the year ahead and hence see higher unemployment earlier. Either way Australia is set to enter a per capita recession. The Government now sees net immigration of 400,000 this year up from a forecast of 235,000 in October, taking population growth to 2% for the first time in 14 years, slowing to 315,000 in 2023-24. The Government revised up its medium-term iron ore price assumption but only to $US60/tonne. With the iron ore price now about $US105/tonne, it’s still a potential source of revenue upside.
Economic assumptions
| 2022-23 | 2023-24 | 2024-25 | 2025-26 | 2026-27 | ||
| Real GDP | Govt | 3.25 | 1.5 | 2.25 | 2.75 | 2.75 |
| %year | AMP | 3.0 | 1.3 | 2.5 | 2.5 | 2.5 |
| Inflation | Govt | 6 | 3.25 | 2.75 | 2.5 | 2.5 |
| % to June | AMP | 6.2 | 3.0 | 2.7 | 2.5 | 2.5 |
| Wages, | Govt | 3.75 | 4.0 | 3.25 | 3.25 | 3.5 |
| % to June | AMP | 3.7 | 3.5 | 3.2 | 3.25 | 3.5 |
| Unemp Rate | Govt | 3.5 | 4.25 | 4.5 | 4.5 | 4.25 |
| % June | AMP | 3.6 | 4.4 | 4.2 | 4.25 | 4.25 |
Source: Australian Treasury, AMP
Budget projections – fastest improvement since WW2
This Budget like all of those since 2020 has benefitted from huge revenue flows coming from a combination of higher personal tax collections due to stronger jobs and wages growth, higher commodity prices and higher non-mining profits than assumed. It looks like “rivers of gold” flowing to Canberra, but it’s really good luck flowing from conservative forecasts regarding jobs, wages, inflation and commodity prices. This windfall (see the line called “parameter changes” in the next table) is estimated to reduce the deficit this financial year by $42bn compared to last October’s forecast, with carry over to next year before slowing as unemployment rises. Some of the windfall has been spent (see the line called “new stimulus”) but 86% of it out to 2026-27 has been saved. As a result, the budget is now projected to be in surplus for this year – its first since 2007-08, a massive turnaround from the $99bn deficit projected less than 18 months ago and the fastest improvement as a share of GDP since the end of WW2 when the deficit went from 10.5% of GDP in 1944-45 to 0.8% in 1946-47. While there is net new stimulus going forward (mainly in 2024-25) due to the cost-of-living measures it turns negative by 2026-27 (as Budget savings kick in) and over the next four years is swamped by the revenue windfall resulting in lower budget deficits going forward.
Underlying cash budget balance projections
| 2022-23 | 2023-24 | 2024-25 | 2025-26 | 2026-27 | |
| Dec 2021 MYEFO, $bn | -98.9 | -84.5 | -57.5 | ||
| Oct 22-23 Budget, $bn | -36.9 | -44.0 | -51.3 | -49.6 | -53.9 |
| Parameter chgs, $bn | +42.1 | +42.2 | +21.7 | +15.5 | +25.0 |
| New stimulus, $bn | -1.1 | -12.0 | -5.4 | -2.5 | +0.5 |
| Projected budget,$bn | +4.2 | -13.9 | -35.1 | -36.6 | -28.5 |
| % GDP | +0.2 | -0.5 | -1.3 | -1.3 | -1.0 |
Source: Australian Treasury, AMP
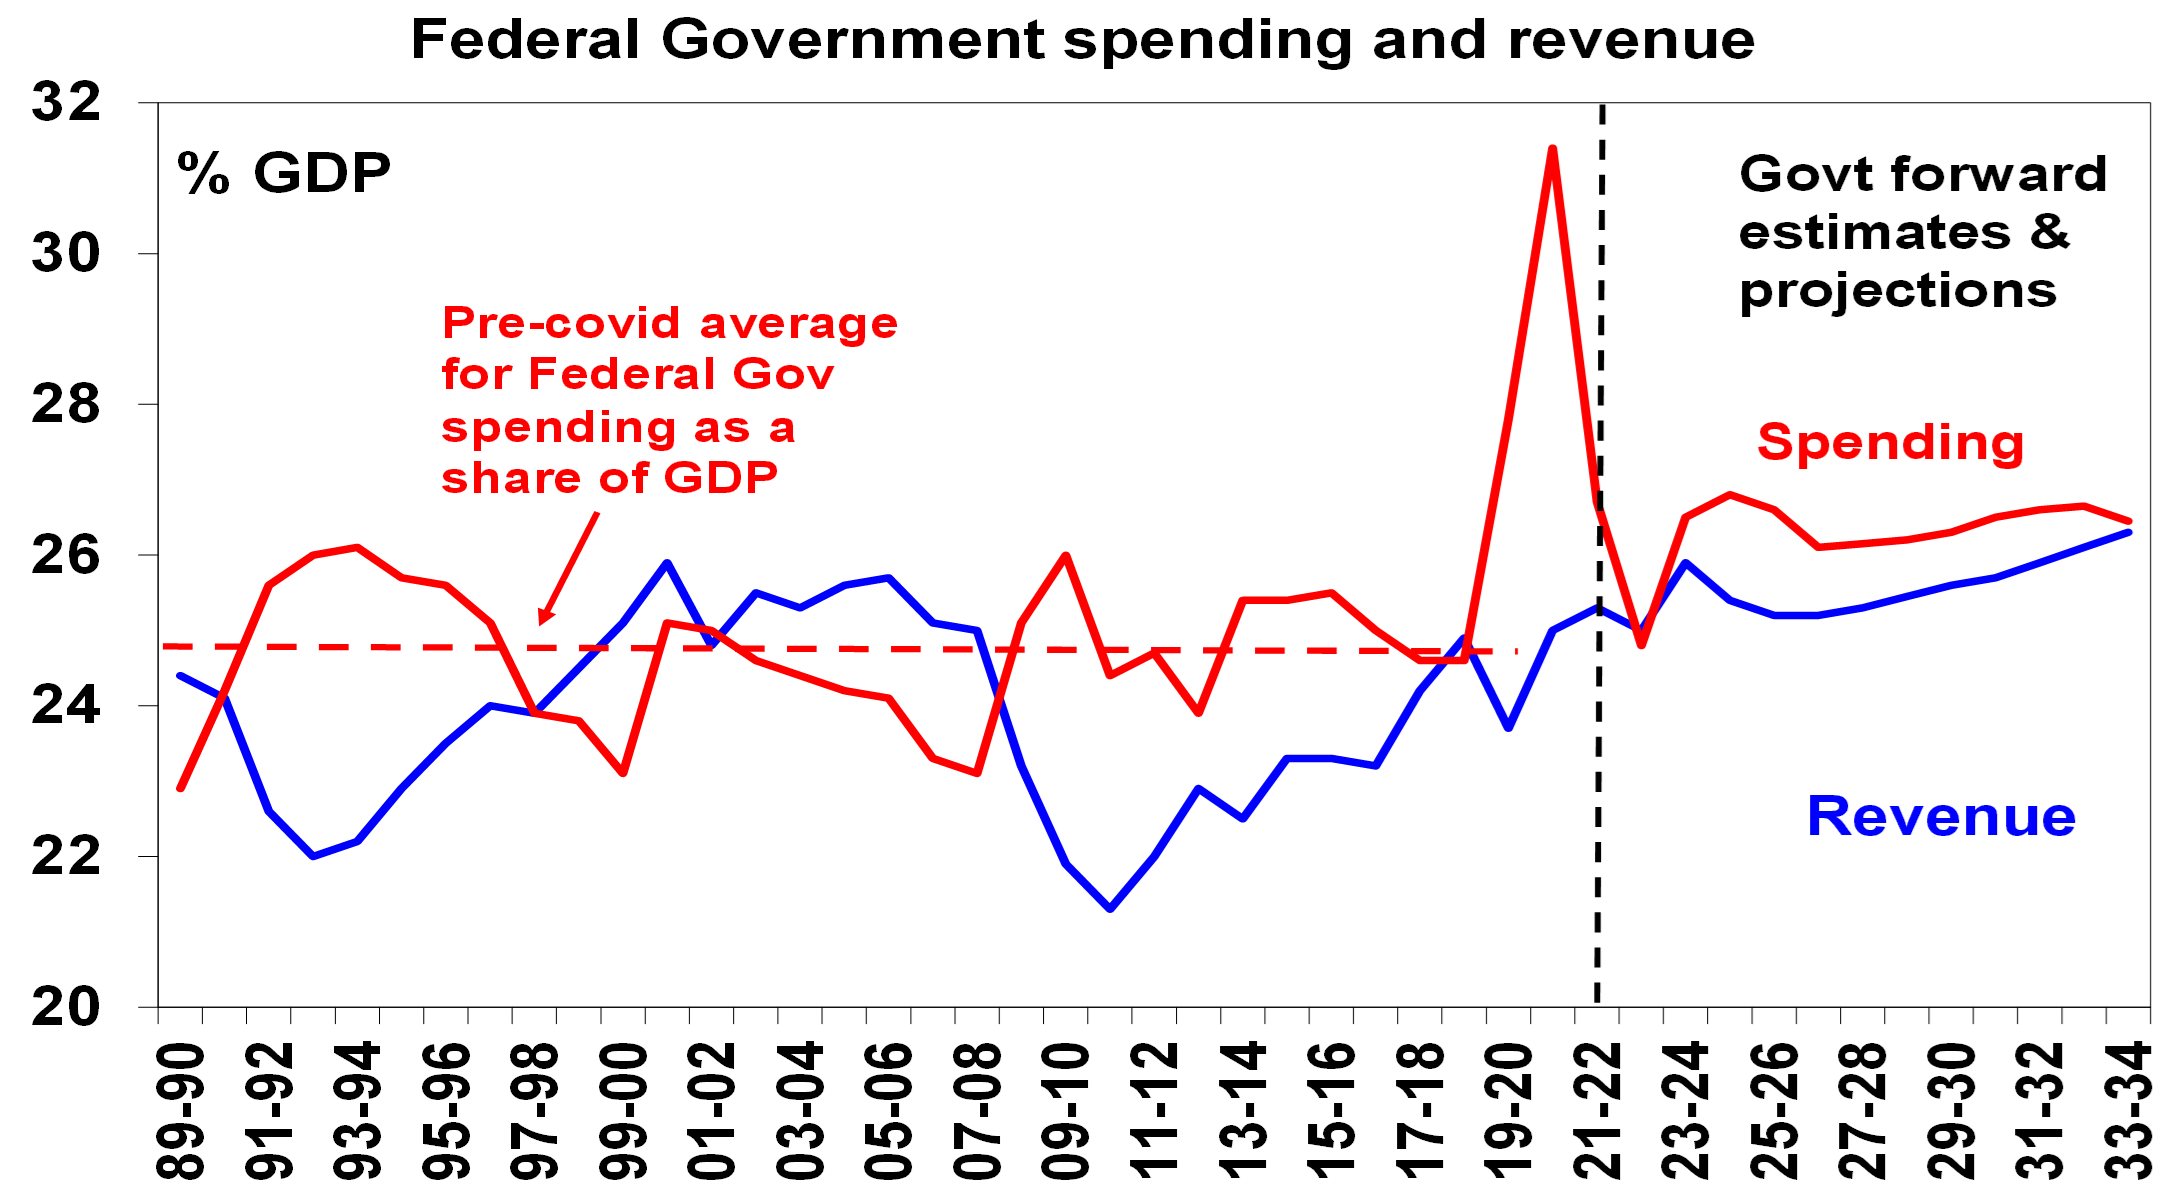
Projections for spending as a share of GDP remain above the pre-Covid average of 24.8% but are lower than previously with Budget measures restricting spending growth to 0.6%pa out to 2026-27. Revenue trends higher (partly due to tax measures in the Budget) as a share of GDP reaching its 1986-87 record of 26.2% in a decade.

Source: Australian Treasury, AMP
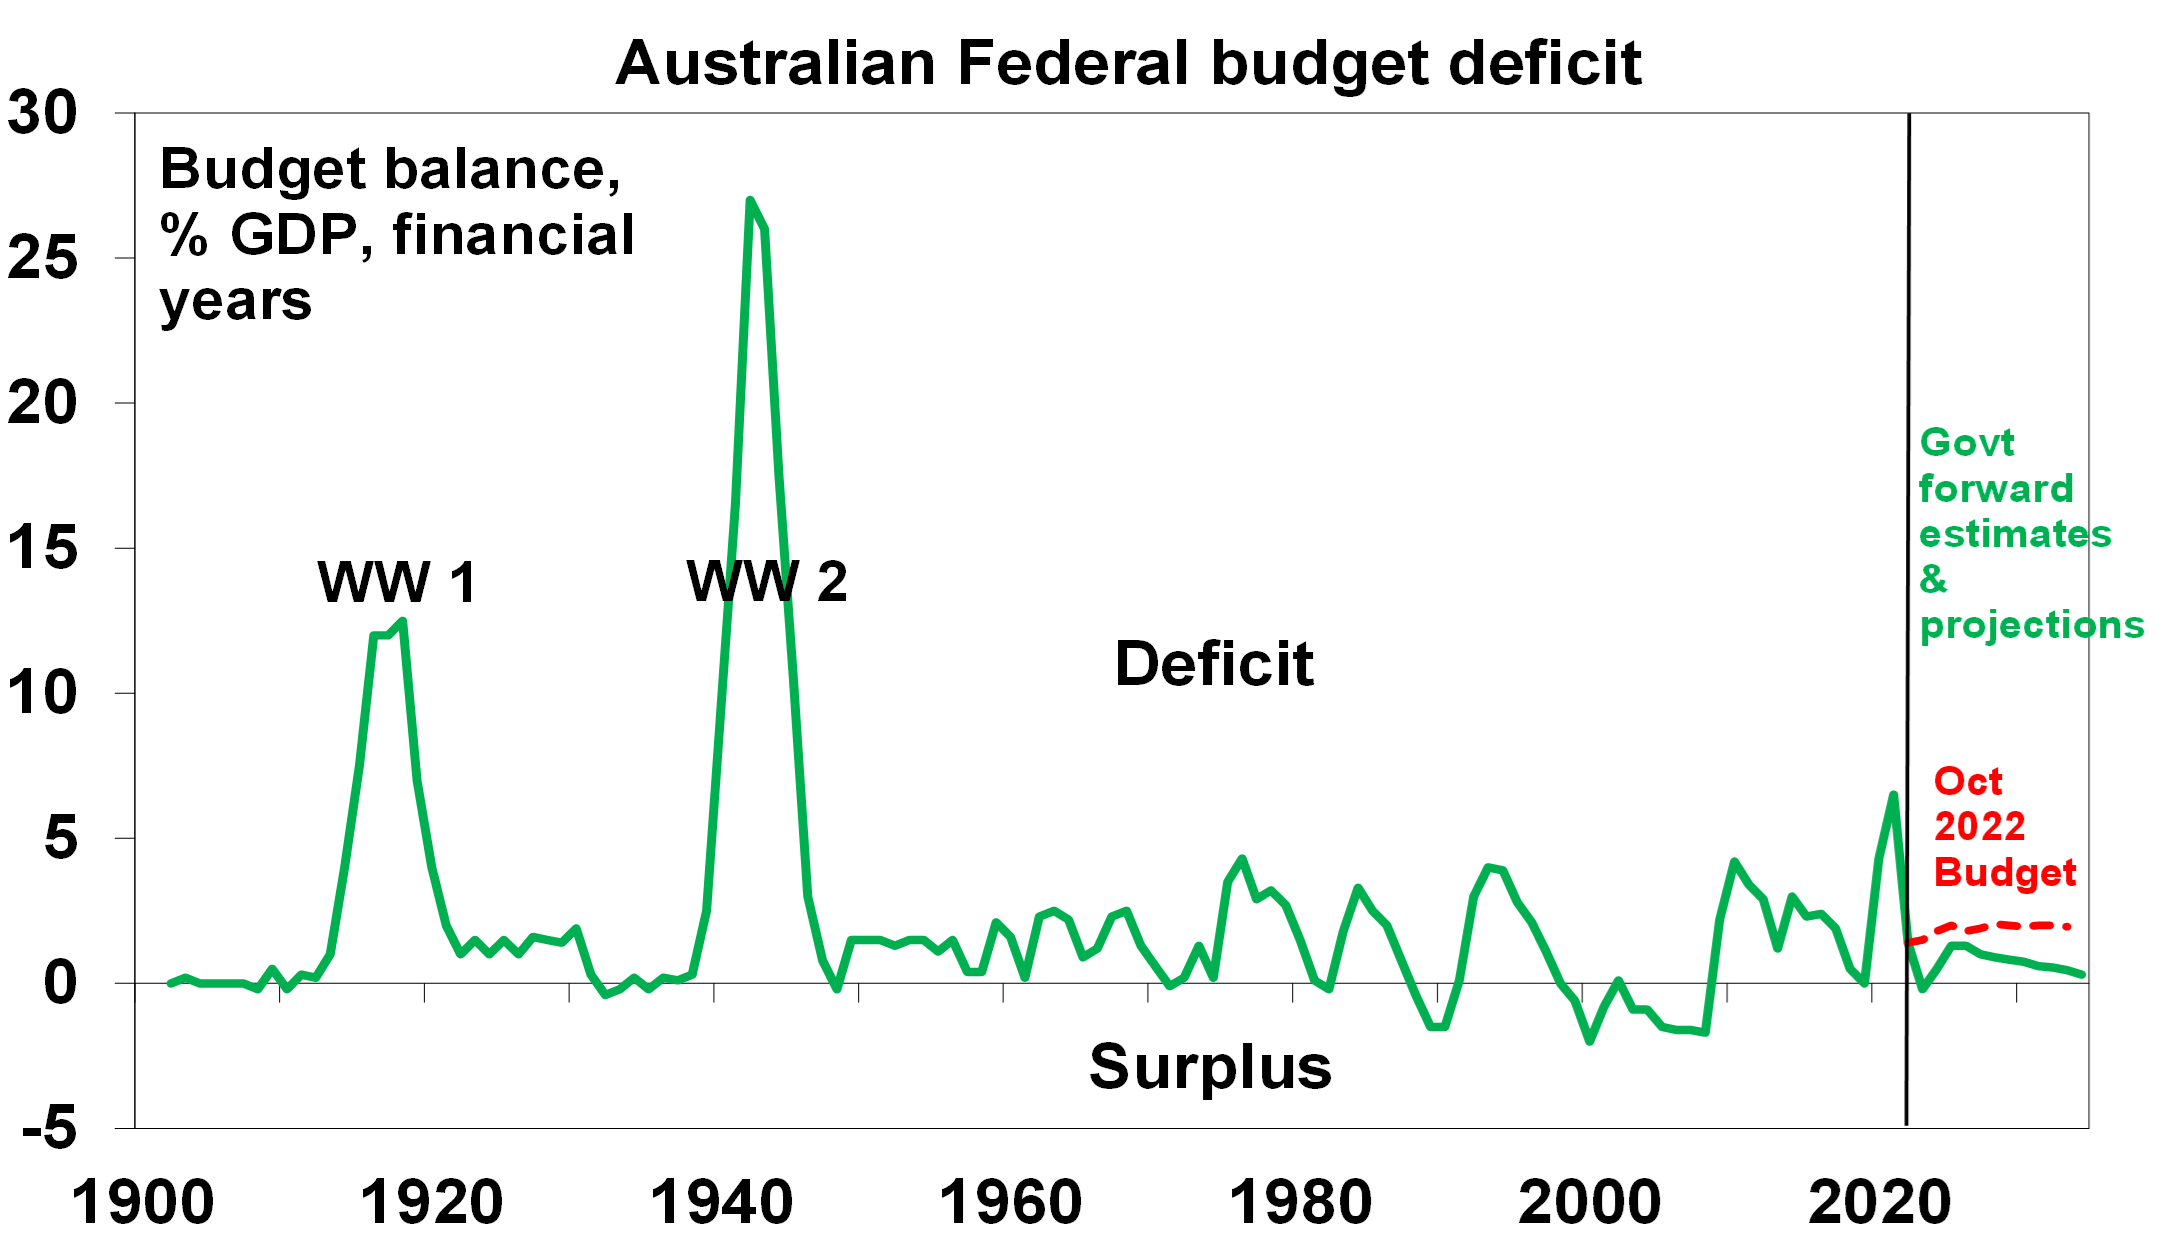
While the Budget has seen a rapid turnaround from deficit to surplus this year and has made better progress in reducing the medium term structural deficit, it still persists through the next decade only gradually falling.

Source: Australian Treasury, AMP
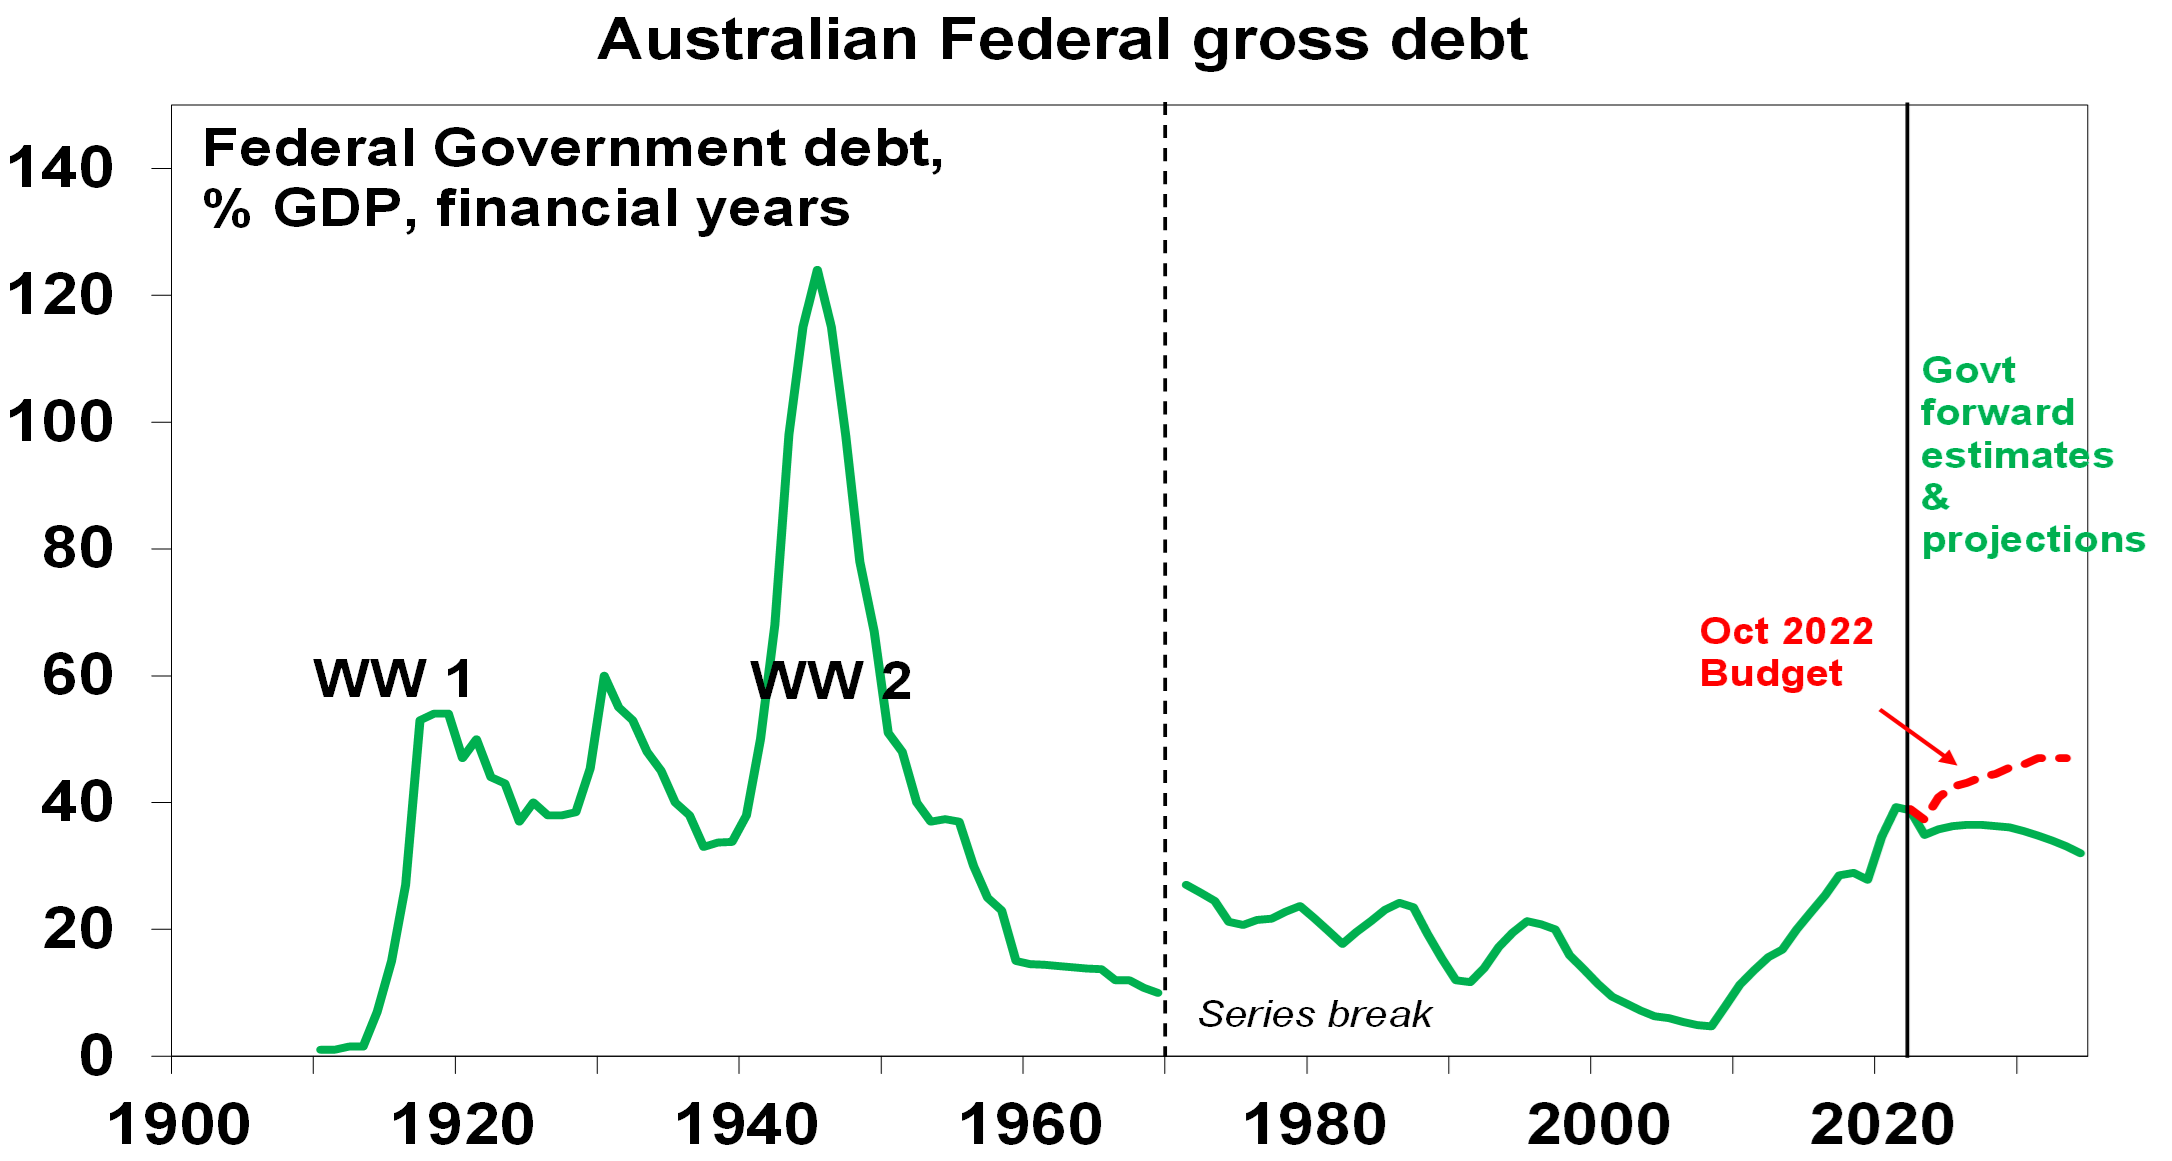
Thanks to lower deficits, gross public debt is now projected to be far lower as a share of GDP, with the $1trn level now pushed out two years to 2026.

Source: RBA, Australian Treasury, AMP
Assessment
Winners include: low and middle income households; pensioners; single parents; medicine users; GPs; aged care workers; low income renters; JobSeeker recipients; small businesses; the build to rent sector; skilled migrants; & the environment. Losers include: gas producers; vapers & smokers; some prospective NDIS recipients; consultants to the public sector; high balance super members; & travellers ($10 more to leave Aust).
The Budget has a lot commend it: the cost-of-living measures will help ease pressure on the most vulnerable and some (energy, medicine and rent relief) will lower measured inflation; the budget is now back in surplus for this financial year; by “saving” the bulk of the revenue upgrade budget deficits are lower and this cuts interest costs; the Government has slowed structural spending growth (eg in the NDIS) and raised extra revenue; and there is still scope for revenue surprise with commodity price assumptions.
However, the Budget has several weaknesses:
- While some of the cost-of-living measures will directly help lower measured inflation (by around 0.4%), the new fiscal stimulus next financial year of $12bn risks boosting demand and adding to inflation – but it’s hard to be adamant as overall the Budget is taking more out of the economy compared to the projections last October.
- While the medium-term structural budget deficits have been sharply reduced they are still large – despite this being the Budget in the political cycle to address this issue as next year’s budget will be in the run up to the next election. It’s a bit of a lost opportunity and leaves the budget vulnerable should economic conditions prove weaker than expected and doesn’t provide much hope for actually paying down debt to put money aside for a rainy day.
- In particular, after several years of upside surprise to revenue, the risk is that this reverses in the year ahead if the economy slows more.
- While the rise in Government spending as a share of GDP has been capped it’s still projected to settle at a level well above that seen pre pandemic thereby locking in a bigger government sector which risks further slowing productivity growth over the medium term.
- More broadly, there is not much new here to turnaround Australia’s deteriorating productivity performance. This is the key to growth in living standards but needs urgent reform in terms of tax reform, competition, the non-market services sector, industrial relations, education and training and energy generation. Fortunately, the Government is moving on the last two but not much on the rest.
- While the housing measures are welcome, they are unlikely to make much of a difference in the next few years to housing affordability with the supply shortfall intensifying with very high immigration levels.
Implications for the RBA
With the Budget overall taking more out of the economy than it’s putting back in compared to what was projected last October, its hard to see significant implications for the RBA but it will be wary of the boost to households from the cost-of-living measures which could boost spending.
Implications for Australian assets
Cash and term deposits – cash and bank deposit returns have improved substantially with RBA rate hikes but are still relatively low.
Bonds – budget deficits add to upwards pressure on bond yields, but at least they have been lowered near term so there should be no new pressure.
Shares – the Budget is a small positive for household spending but not enough to offset the negatives impacting the sector and overall there is not really a lot in it for the share market.
Property – the housing measures are unlikely to alter the property price outlook which is dominated by supply shortages and surging immigration versus the impact of rate hikes. We see roughly flat home prices this year.
The $A – the Budget is unlikely to change the direction for the $A.

Weekly market update 10-05-2024
10 May 2024 | Blog Fed less hawkish than feared; RBA holds; Aust consumer remains weak; slowing in CPI inflation, Aust budget preview. Read more
Oliver's Insights - seasonal patterns in shares
06 May 2024 | Blog This article looks at seasonal patterns in shares and whether its time to “sell in May and go away” along the lines of the old share market saying. Read more
Weekly market update 03-05-2024
03 May 2024 | Blog Fed less hawkish than feared; US stagflation or just getting back on track?; RBA to hold, with a tightening bias; Aust consumer remains weak; Aust budget preview. Read moreWhat you need to know
While every care has been taken in the preparation of this article, neither National Mutual Funds Management Ltd (ABN 32 006 787 720, AFSL 234652) (NMFM), AMP Limited ABN 49 079 354 519 nor any other member of the AMP Group (AMP) makes any representations or warranties as to the accuracy or completeness of any statement in it including, without limitation, any forecasts. Past performance is not a reliable indicator of future performance. This document has been prepared for the purpose of providing general information, without taking account of any particular investor’s objectives, financial situation or needs. An investor should, before making any investment decisions, consider the appropriateness of the information in this document, and seek professional advice, having regard to the investor’s objectives, financial situation and needs. This article is solely for the use of the party to whom it is provided and must not be provided to any other person or entity without the express written consent AMP. This article is not intended for distribution or use in any jurisdiction where it would be contrary to applicable laws, regulations or directives and does not constitute a recommendation, offer, solicitation or invitation to invest.
The information on this page was current on the date the page was published. For up-to-date information, we refer you to the relevant product disclosure statement, target market determination and product updates available at amp.com.au.
