


Econosights
Five long-term global trends and implications for markets
This Econosights looks at some longer-term structural trends in the economy and their impact on economic growth and investment markets.
8 min read

Key points
In the short-term, economic growth and investment markets are driven by central bank interest rates, government fiscal policy, population growth, productivity and the rate of participation in the labour force.
But, structural trends are also important in influencing long term economic outcomes, despite being slower moving.
We outline five major global trends that will influence economic growth and investment markets over coming years.
Introduction
This Econosights looks at some longer-term structural trends in the economy and their impact on economic growth and investment markets.
1. A decline in routine-based jobs
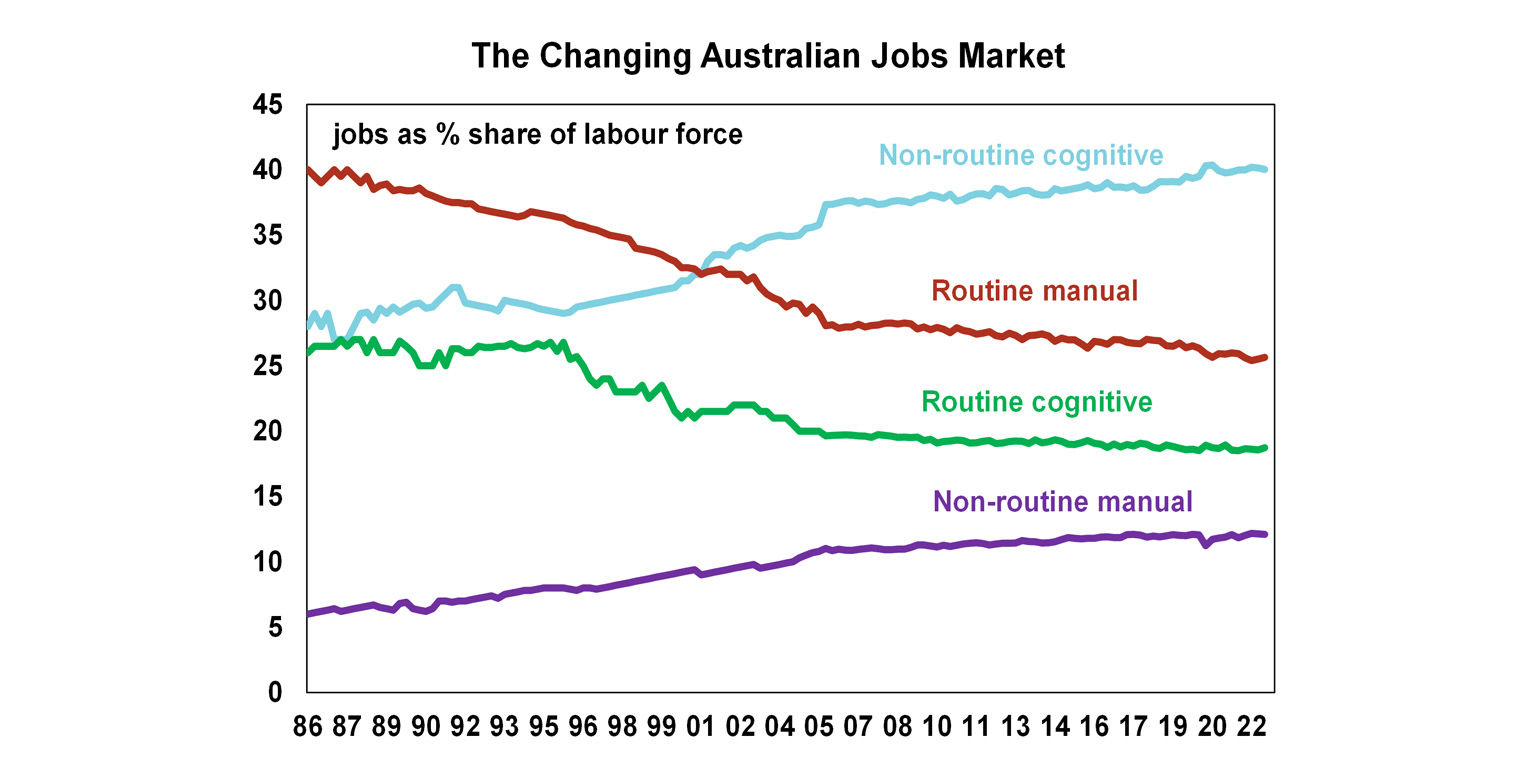
Fear of technology replacing jobs has been around for years, although concern around this risk appears to have waned in recent times, as impacts of the pandemic on labour markets has taken focus. New technology is constantly displacing some jobs, but it is also creating new ones in its place. The jobs most at risk are routine-based jobs, because this type of work can be replicated, learned and taught by machinery and automatic intelligence. In Australia, there has been a long-term decline in manual and cognitive routine based jobs. In the late 1980’s, routine manual jobs were 40% of the workforce and are now around 26% of the workforce while routine cognitive jobs were 26% of the workforce in the late 1980’s and are now worth 19% – see the chart below. Similar medium-term trends are evident across other developed countries. Non-routine jobs (either manual or cognitive) are less at risk of being displaced by technology because they are harder to replicate and often need a human element (for example in jobs related to health, childcare or teaching). Problems in recent years with self-driving cars also shows the difficulties associated with technology.
Middle-income households tend to be most susceptible to routine-based jobs so this trend will increase inequality and could put downward pressure on wages growth in the long-run. The OECD (in a report done in 2018) estimated that around 14% of jobs (in the OECD) are at high risk from automation, with large variations across countries (countries that are higher at risk include Slovakia, Slovenia, Greece and Spain while the countries at the lowest risk include Norway, Australia, Finland and Sweden). The workforces that are more at risk tend to have a lower-educated workforce, a weak tradeable services sector and have a low urbanisation rate. In Australia, around 7% of jobs are estimated to be at high risk of automation and in the US its slightly higher at 10%. The government has a role to play in ensuring that the transition to new types of employment for impacted employees is managed through training programs, appropriate university curriculum and ensuring that funding is targeting those areas at the highest at risk of job losses due to automation.
2. An ageing population and an increase in the “dependency ratio”
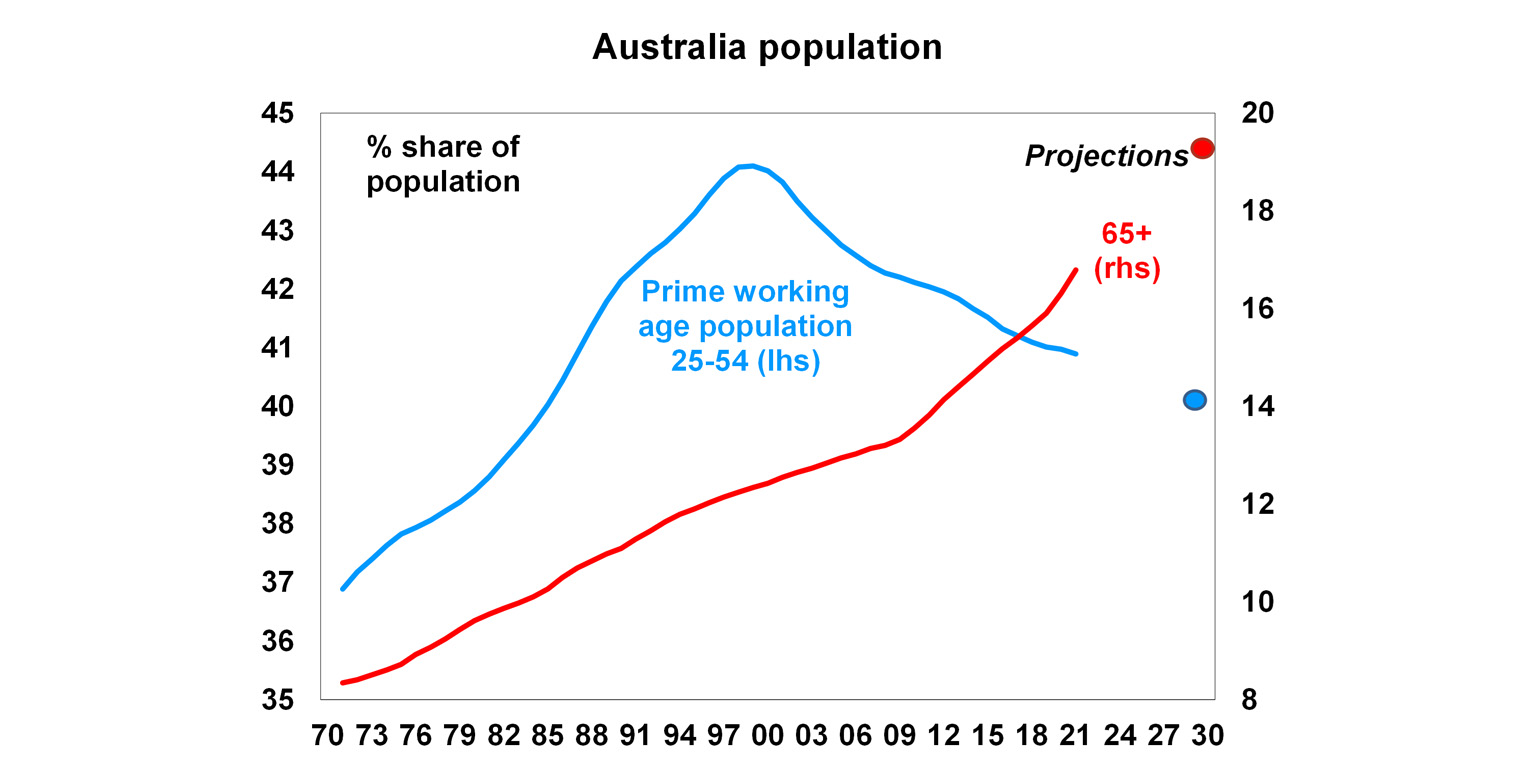
The global population, especially in major developed countries, is ageing which has been a long-term trend as the birth rate has declined. In Australia, the share of the prime working age population (those aged between 25-54) peaked at 44% of the population in 1999 and has been falling slowly since then, currently at around 41% and projected to be around 40% by the end of the decade. In contrast, the share of the population that is aged 65+ is expected to keep climbing to just under 20% by 2030, up from 17% now (see the chart below). An aging population will put upwards pressure on the “dependency ratio” (the sum of those aged under 15 and over 65 as a share of the whole population) which will detract from national savings (people who work increase savings while the very young and old drain savings) which is inflationary in the long-term.
3. A decline in business investment as a share of GDP but a lift in intellectual property as a share of investment
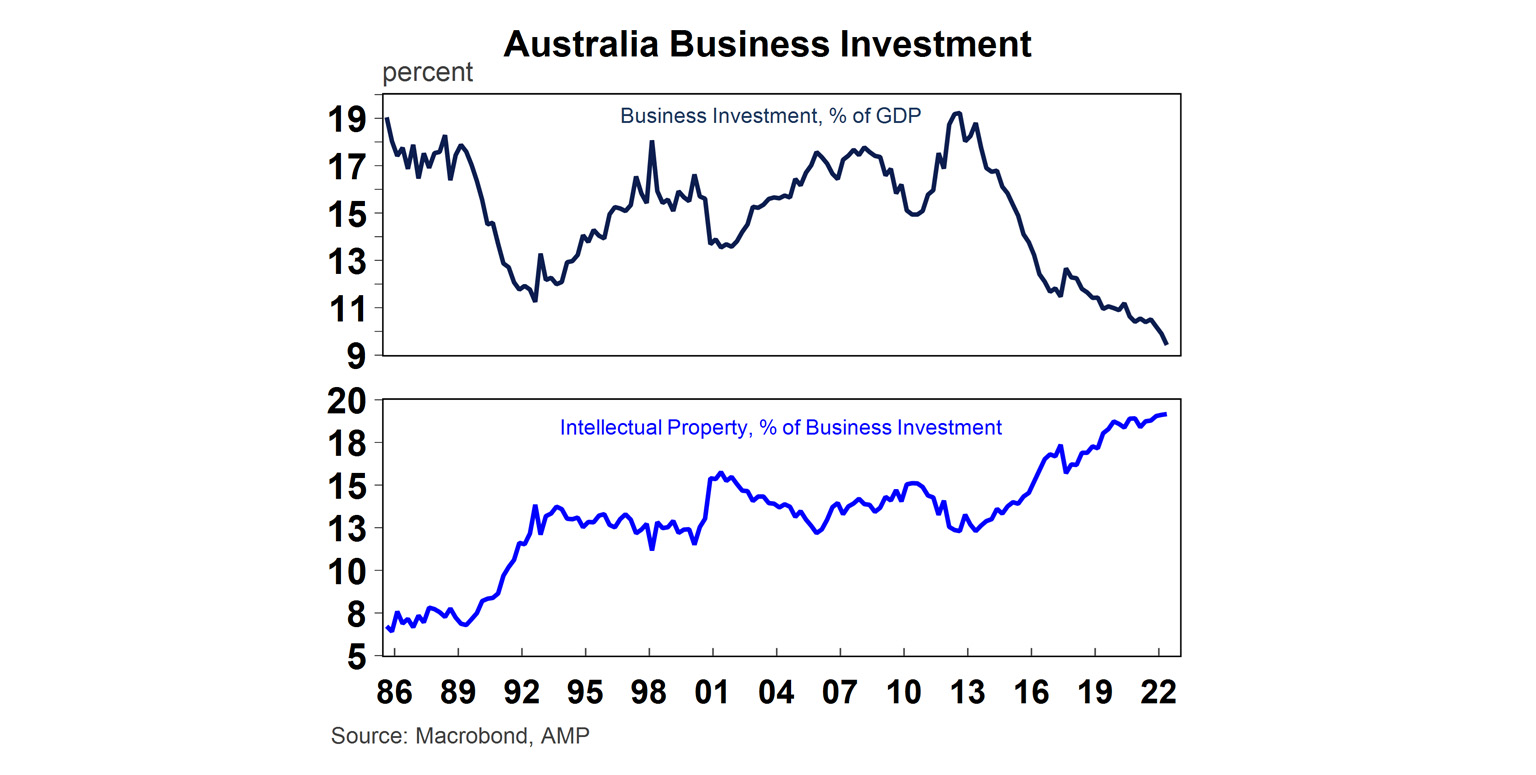
In many developed countries, private business investment is declining as a share of the economy, in place of a rising services sector which is less investment intensive. In Australia, business investment often goes through cycles because of the dominance of the mining sector (at its peak mining investment reached 11% of GDP). After the last mining investment boom (which ended in 2012 after business investment was 19% of GDP), investment has been on a gradual decline and is now 9.4% of GDP (see the chart below). While there may be ups and downs in the cycle from the mining investment contribution and the usual wear and tear associated with depreciation, private business investment is likely to decline further as a share of GDP because of the changing nature of business investment. The typically large-scale buildings and structures, machinery and equipment type of investment is being replaced with less “heavy” types of investment, like intellectual property with the rising importance of the tech sector in all industries. A less capital-intensive economy could weigh on long-run productivity growth, although the impact is probably marginal as intellectual property investment should still boost productivity growth.
4. A multi-polar world means more geopolitical risks
The US economy has been increasing in importance to the global economy since the end of the Second World War. The rising significance of the US economy to global trade, cultural influences, military presence and economic power has been increasingly consistent with a unipolar world, especially as the United Kingdom and the Eurozone have had challenging economic conditions in the past decade.
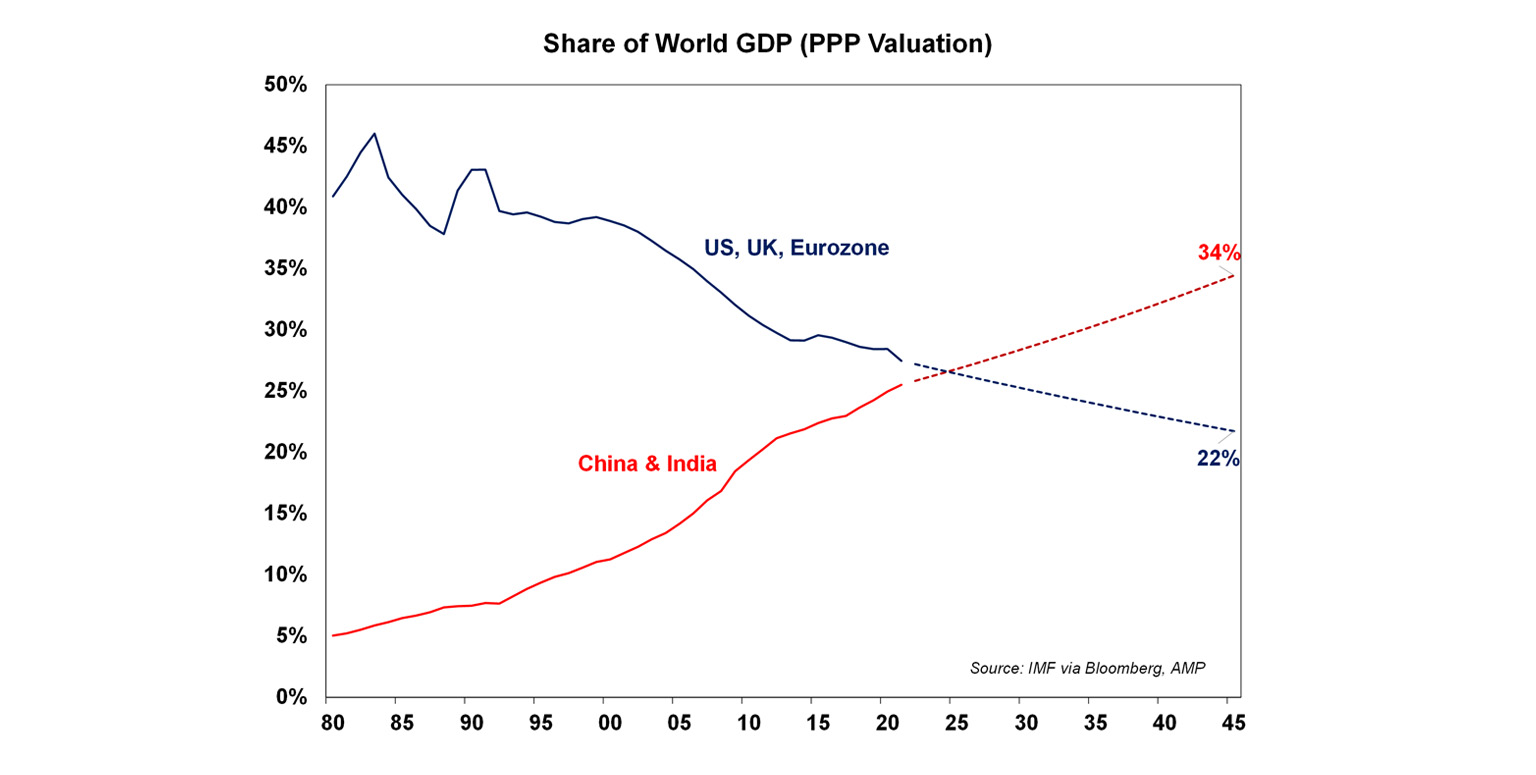
However, the balance of power has been shifting in recent years as the Chinese economy grows and becomes a larger share of the global economy (see the chart below). In purchasing power parity (PPP) terms (which adjusts individual country prices into a global comparison after accounting for exchange rates and purchasing power in each country which allows a better sense of living standard comparison) the Chinese economy is already the largest in the world (at 19% versus the US at 16%). If we also account for India then China and India make up 26% of the global economy compared to the US, UK and the Eurozone at 27% (in PPP terms). But we are currently at a crossroads, with China and India about to takeover as a larger share of the global. On our estimates China and India will be 34% of the global economy by 2045, versus 22% for the US, UK and Eurozone (if growth rates continue at its current pace). As a result, the global economy is increasingly moving towards a multi-polar world as the balance of power shifts away from the US. This shift in the balance of power will keep geopolitical tensions and risks high over coming years as the US and China compete for global control, particularly in the technological space. Investors should be prepared for periodic inflammations in geopolitical tensions and heightened risks of conflict or war, keeping volatility in sharemarkets high. Concerns over the growing Chinese economy are expected to again be a feature of both the Democratic and Republican party campaigns in the 2024 US Presidential election. However, in Australia, the relationship with China looks to be improving with a recent meeting between Australian PM Albanese and China’s President Xi Jinping seemingly the most positive in years.
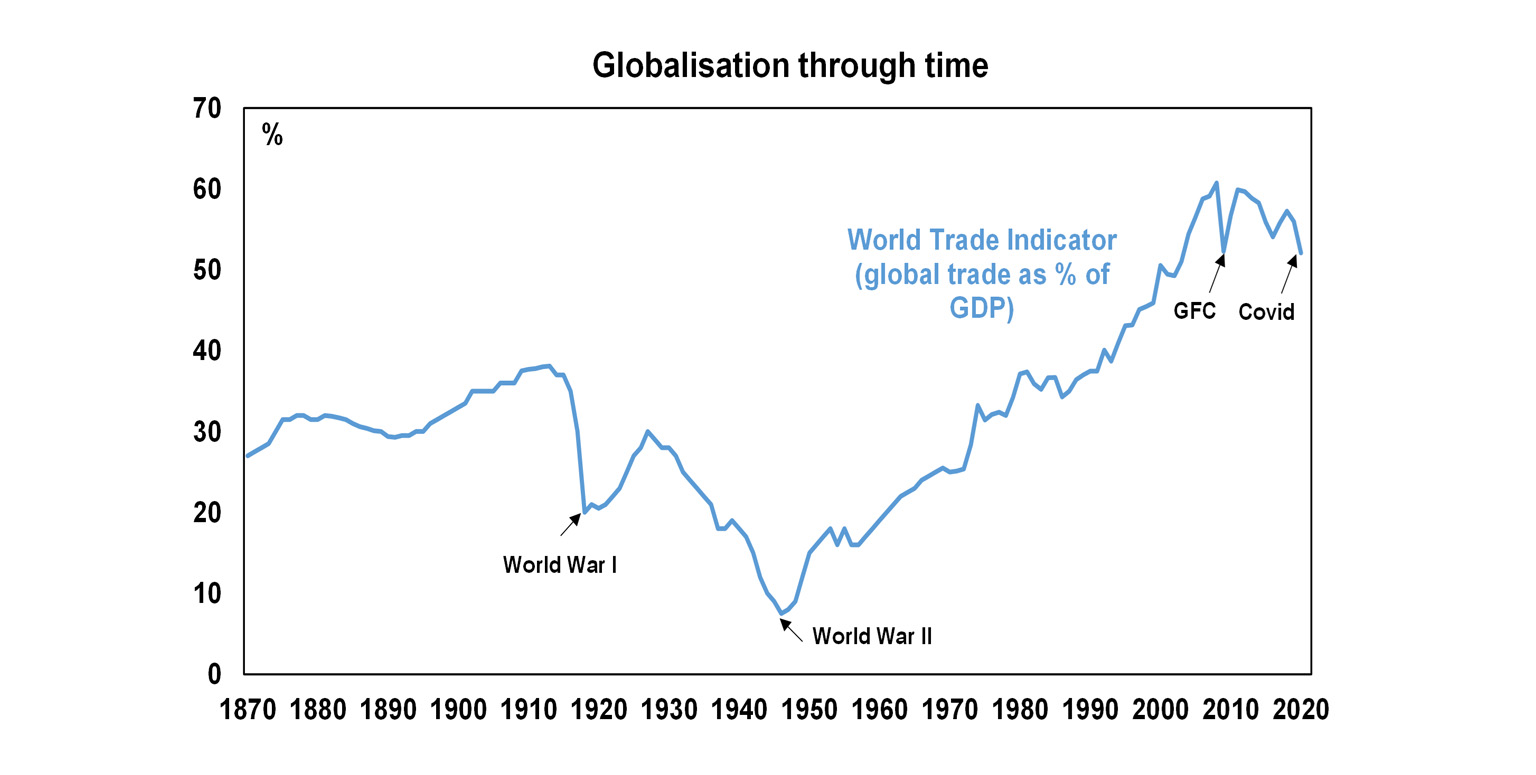
5. Peak globalisation is inflationary
Globalisation looked to be reaching a peak before Covid-19 broke out, with global trade (the sum of exports and imports) declining as a share of GDP since the Global Financial Crisis in 2008 (the chart below shows that global trade was 56% of GDP in 2019, below its peak of ~61% before the GFC), as countries decided to become more self-sufficient after seeing the contagion impacts of the GFC. Covid-19 dealt another blow to global trade as closed borders and transport delays led to a push towards bringing as much production onshore as possible, or at least to closer countries (“nearshoring” or “friendshoring”). Given that globalisation was disinflationary because production was transferred to countries to the most efficient producer (which most often ended up being the lowest-cost producer) some reversal in the globalisation trend will be more inflationary for the global economy.
You may also like
-

Weekly market update - 26-06-2026 The past week saw global shares fall with tech shares under renewed pressue on concerns about an AI bubble and valuations, with reports that a ship had been struck by a missile while moving through the Strait of Hormuz not helping and adding to concerns that the Strait’s reopening and the US/Iran peace deal was fragile. Partly reflecting the weak global lead along with lower commodity prices and profit taking in the banks the Australian share market also fell with a decline of around 0.9% for the week. While consumer and health shares rose this was more than offset by weakness in tech, resources, telcos and financials. -

Oliver's insights - Teflon share markets Over the last 18 months investment markets have faced a string of threats. Many of these have involved the US and President Trump’s policies - tariffs, a US/China trade war, Trump’s attacks on NATO allies, Trump’s attacks on the Fed, and the War with Iran and the associated oil supply shock. Even Trump’s erratic policy making itself would normally be seen as a concern. -

Weekly market update 19-06-2026 The deal provided a boost for global share markets with US shares up 0.9% for the holiday shortened week to Thursday with a more hawkish Fed limiting the gains and US futures falling 0.2% on Friday due to a delay to the start of US/Iran talks towards a permanent deal.
Important information
Any advice and information is provided by AWM Services Pty Ltd ABN 15 139 353 496, AFSL No. 366121 (AWM Services) and is general in nature. It hasn’t taken your financial or personal circumstances into account. Taxation issues are complex. You should seek professional advice before deciding to act on any information in this article.
It’s important to consider your particular circumstances and read the relevant Product Disclosure Statement, Target Market Determination or Terms and Conditions, available from AMP at amp.com.au, or by calling 131 267, before deciding what’s right for you. The super coaching session is a super health check and is provided by AWM Services and is general advice only. It does not consider your personal circumstances.
You can read our Financial Services Guide online for information about our services, including the fees and other benefits that AMP companies and their representatives may receive in relation to products and services provided to you. You can also ask us for a hardcopy. All information on this website is subject to change without notice. AWM Services is part of the AMP group.