





Weekly market update
Investment markets and key developments
US and Asian shares fell sharply as Democrat midterm wins fuelled concerns about tighter AI regulation and a tech bubble. In contrast, Australian shares gained around 0.8%, supported by lower AI exposure, a less hawkish RBA and gains across tech, consumer and property stocks.
12 min read

Investment markets and key developments
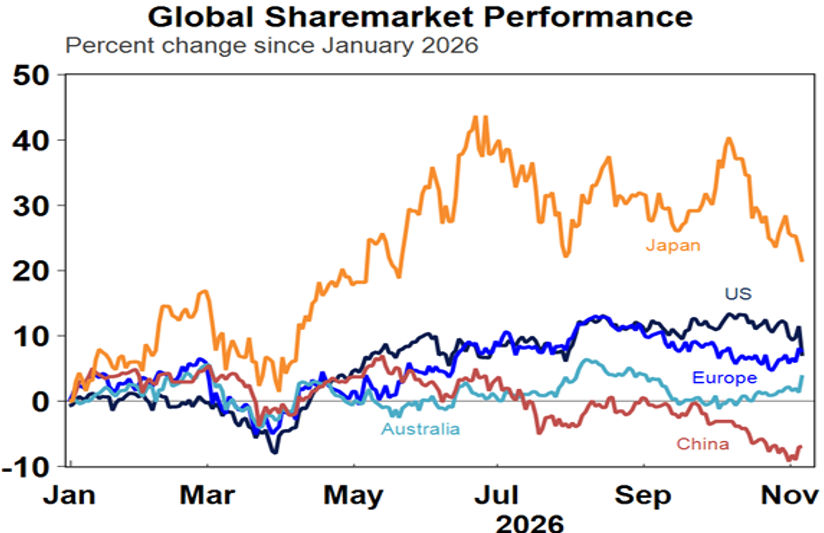
US shares fell sharply over the last week as the Democrat wins in the midterm elections renewed fears about tighter regulation of AI adding to worries about an AI bubble and leading to a sharp rout in AI related tech shares leaving the US share market on track for 2.7% fall. This also dragged Japanese and other Asian share markets down sharply. Eurozone shares managed a small rise though. Australian shares also rose managing a gain of around 0.8% helped by its relatively low exposure to AI related shares and less hawkishness from the RBA after its latest rate hike. While energy shares fell on the back of lower oil prices this was offset on the ASX 200 by gains in tech, consumer and property shares.
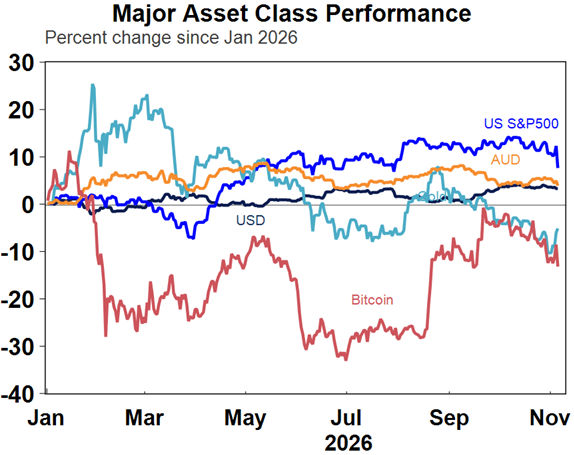
While gold and iron ore rose over the last week, Bitcoin fell along with metal prices. The $A fell on the back of the risk off trade but the $US also fell slightly.
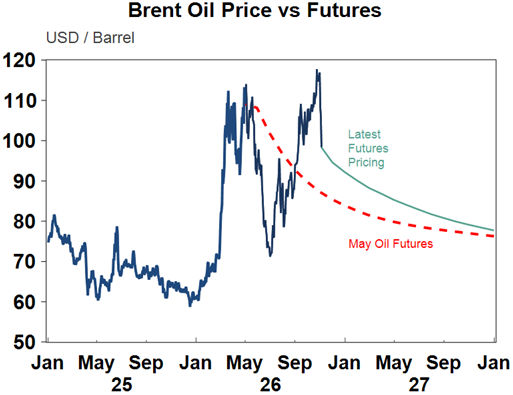
Oil prices plunged on hopes that the move to a Democrat Congress will help bring an end to the Iran War with Republicans seeing that as a cause of their midterm losses. The risk around this remains high though as Trump could still decide to ramp up the attacks again.
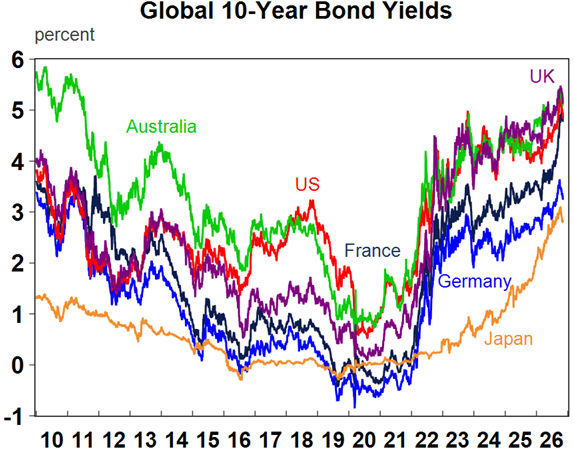
Bond yields fell further again over the last week on hopes that US political gridlock will stop the blowout in the US budget deficit and on safe haven demand. The longer term risks for bond yields remain on the upside though thanks to a combination of: the oil shock; expectations for more central bank rate hikes; stronger US economic data adding to concerns that maybe the neutral short term rate has moved up; worries about big budget deficits in the US, UK, France, Brazil and elsewhere; corporate borrowing to fund data centre investment; and a rising trend in Japanese bond yields leading to a reversal of the so-called carry trade.
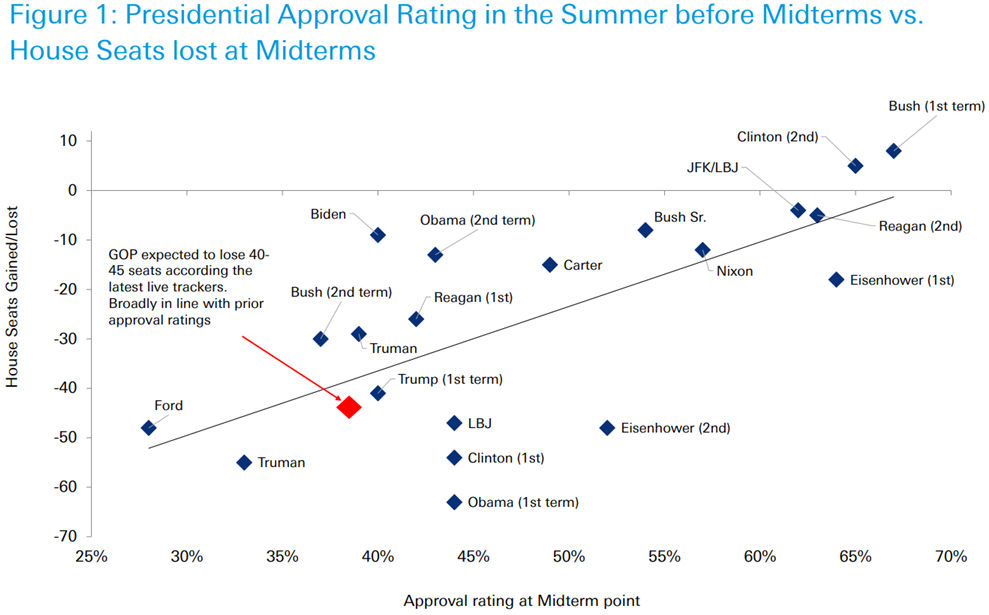
The US midterms saw a resounding rebuke of Trump’s policies, with a blue wave seeing Democrats retake control of both the House and the Senate and various governorships in red states. Naturally though Trump tried to deflect - arguing if “I was on [the ballot] we would have won in a landslide” ironically ignoring the fact that he had asked people to assume he was on the ballot. Maybe they did! But, as always “it’s the economy stupid”. Trump won in 2024 largely because of “cost of living” pressures turned people against the Democrats, but his crazy tariff and War policies made them even worse causing those who swung to him then to swinging back to the Democrats. Of course, this wasn’t helped by things like the ICE raids (turning Hispanics and other immigrant groups against him), the Epstein files and perceptions of graft and corruption. Of course, there is a danger in reading too much into it in terms of what it means for the 2028 elections as given Trump’s low approval rating the seat gains by the Democrats are consistent with the experience in past midterm elections. See the next chart from Deutsche Bank. Both Clinton and Obama lost far more House seats in their first term midterm elections and then went on to win a second term two years later.
However, the blue wave does have significant implications particularly given Trump’s sensitive character and the unusual nature of the Trump Administration. In particular:
- Congress will now be a check on Trump’s actions at least domestically and in particular there are now likely to be significant inquiries into his actions including a possible attempt at impeachment. Democrat control off the Senate also means Fed independence will be protected. At a high level this once again highlights that US governance and democracy remains strong – a slide into strong man dictatorship is not going to happen as voters won’t permit it.
- More regulation around tech and AI – particularly putting some brake on data centres in states where Democrats won the governorship (Texas, Ohio, Iowa & Georgia) and in states where referenda to restrict data centres were won. Trump can veto excessive regulation coming out of Congress but the states may matter more.
- A return to brinkmanship over raising the debt ceiling (necessary by around June quarter next year and funding the US Government (which currently expires on 11th December) – in some ways this may be a good thing if it leads to a smaller budget deficit. Trump may attempt to get resolution and to raise defence spending in the lame duck session of the current Congress but that’s unlikely to happen. Similarly hopes for lower budget deficits may prove in vain as Democrats may try to increase some social benefits that Trump may find hard to veto, but he is likely to veto any attempted tax hikes. So, the fall in bond yields since the midterms may not be justified.
- Trump moving into being a lame (or angrier) duck President could see him become more aggressive in foreign policy by in particular recommencing the war on Iran and returning to the tariff war. So far markets seem relaxed about this, with oil prices down sharply on hopes Congress will bring an end to the Iran War, VP Vance blaming the War for the election loss, the clear voter pushback against the War including from Republicans and Trump saying he has no immediate plans to ramp up fighting. And both tariffs and the War are self-evidently not popular so Republicans may cut him adrift if he pushes heavily down this path again. That said he could still have a go just to prove who’s in charge – so another spike in tariffs and/or oil prices remains a high risk.
- Fears that tax hikes and bigger government are on the way particularly if a Democrat wins the 2028 presidential election. However, the risks on this front are overstated. Sure, the numbers of DSA (Democrat Socialists) in Congress will increase but most of the wins owed to moderate centre left Democrats, suggesting the US has not lurched to Bernie Sanders’s style democratic socialism. The failure of the Proposition 40 5% billionaire wealth tax proposal in California also supports this view although not strongly as one reason for opposing it was that it wasn’t national (so risked a loss of billionaires out of California) so it could still get up nationally.
Normally US shares rally once the midterms are out of the way due to the removal of a source of uncertainty. However, there may be more uncertainty this time around given the risk for the AI trade from the Democrat wins and its high weight in the US share market along with Trump’s unpredictability and the risk he could go rogue on, eg, Iran for a while now that the election is out of the way.
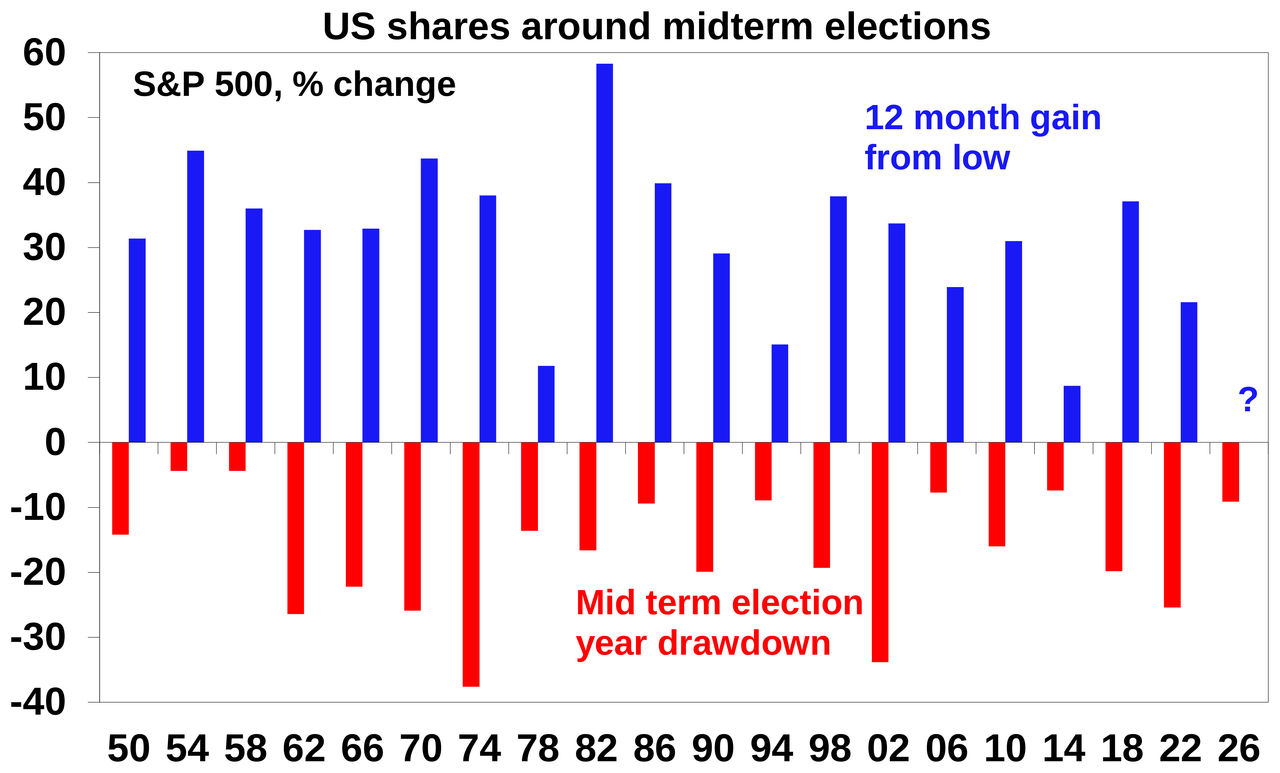
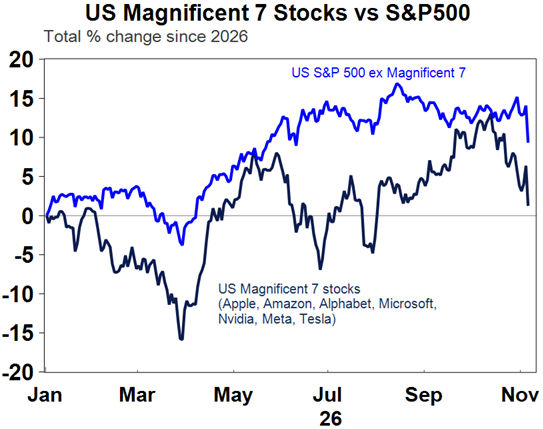
However, the risk of a further correction in shares remains high and maybe we are now starting to see this unfold with US shares now down 6% from their October high. The threats from high and sticky inflation, ongoing central bank rate hikes, excessive public debt driving rising bond yields, the risk of another spike in oil prices, AI bubble and data centre worries, and slowing growth and rising rates in Australia remain. A rotation from tech to non-tech was providing some support for US shares but even non-tech shares came under pressure in the last week. While the VIX “fear index” is up its too early to say that the correction in shares is over particularly given the long list of worries and this leaves US, global and Australian shares vulnerable. However, at this stage strong US earnings growth (even outside tech) and no indications of a US recession suggest that the pull back is more likely a correction rather than a new bear market.
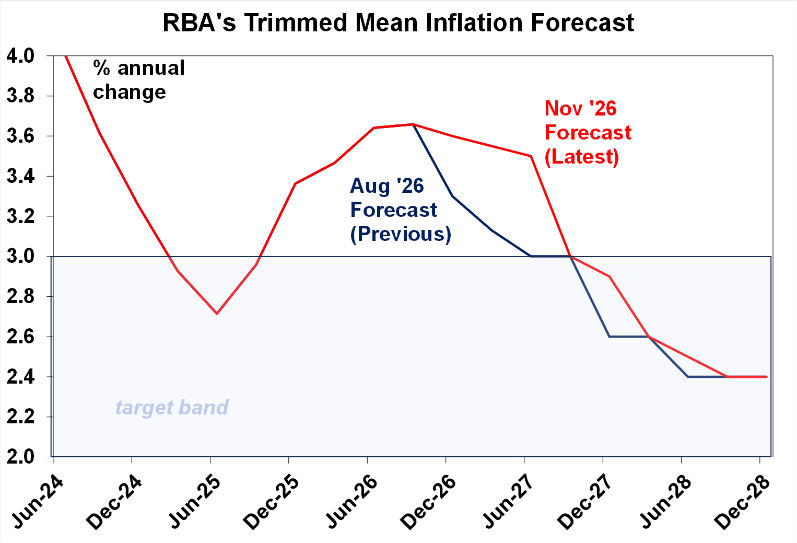
In Australia the RBA provided no real surprises with a fifth rate hike taking the cash rate to an 18 year high of 4.85%. The reasons were simple – inflation is too high and broad based, capacity pressures remain and higher fuel prices look to be bleeding through into other prices and inflation expectations look to be rising. Government spending cuts could have provided a fairer alternative but in their absence the RBA had to hike to cool demand and to reinforce its commitment to the inflation target. The bad news is that inflation is likely to have increased further in October and is now expected to remain higher for longer and so despite a rising risk of recession and much higher unemployment the risk of another rate hike remains high. The good newsthough is that there are increasing signs that rate hikes are working to slow spending – with very low levels of confidence, weakening underlying household spending and warnings from retailers of falling retail sales, falling home prices and rising unemployment – which will slow inflation. And consistent with this the RBA softened its tightening bias by dropping a reference to raising rates again if needed, three board members voted for a pause and Governor Bullock implied that after five hikes it’s a good point to “take stock” suggesting the RBA will pause in December.
Our view is that while the risk of another rate hike is high, there is now increasing evidence that rate hikes are working to slow demand which will slow inflation and so we expect the RBA to leave rates on hold for an extended period, ahead of eventually being able to start cutting rates but not until late next year.
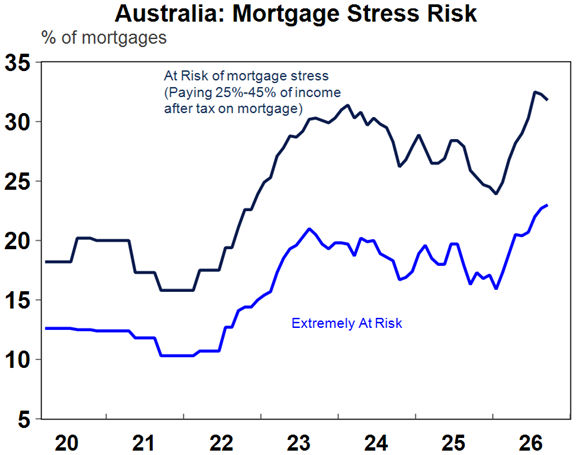
Understandably, following the latest rate hikes there is now much concern about mortgage stress and how big it is. Here’s a survey-based measure from Roy Morgan suggesting just over 30% of mortgages are at risk of stress with over 20% extremely at risk. It exaggerates the reality as the definitions are rather vague and it’s based on the Standard Variable Rate which is way above actual mortgage rates. And I have been hearing about high levels of mortgage stress on and off for the last 20 years now and yet the proportion of loans behind in their payments has stayed relatively low. But on this chart mortgage stress is already above where it was at the end of the last rate hiking cycle in 2023, the trend is clearly up and with rates pushing levels last seen 18 years ago but with higher debt to income ratios today a further significant rise in mortgage stress is likely.
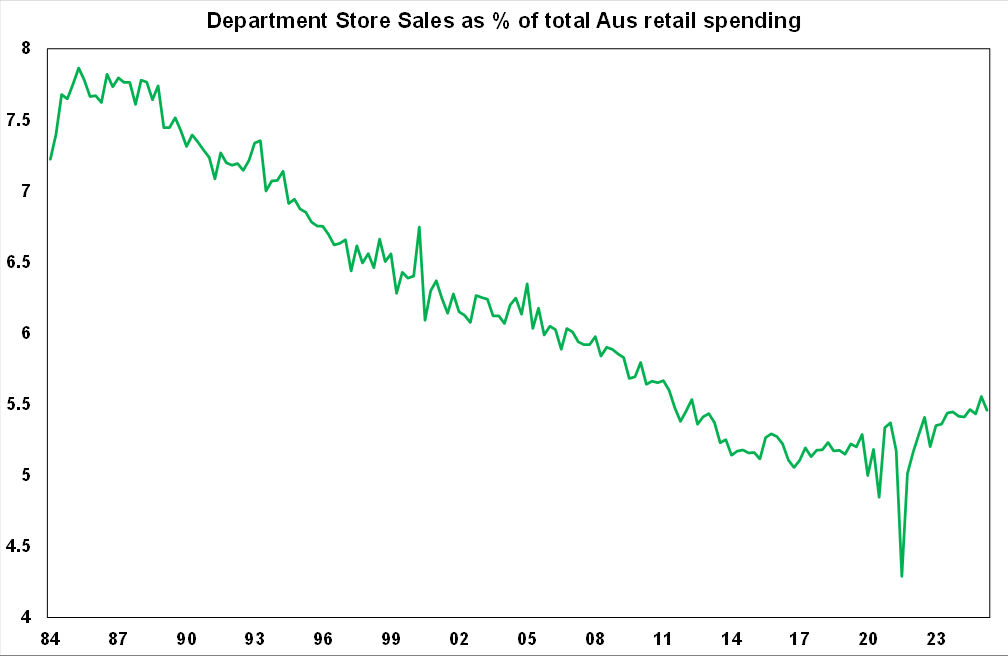
The threat from rising mortgage stress for the economy has been highlighted in recent weeks by various retailers warning that consumer spending is weakening. The move into voluntary administration by David Jones partly reflects this but more broadly reflects years of decline with DJ’s failure to adapt to changing shopping habits around online spending and the rise of specialist brands with lower costs.
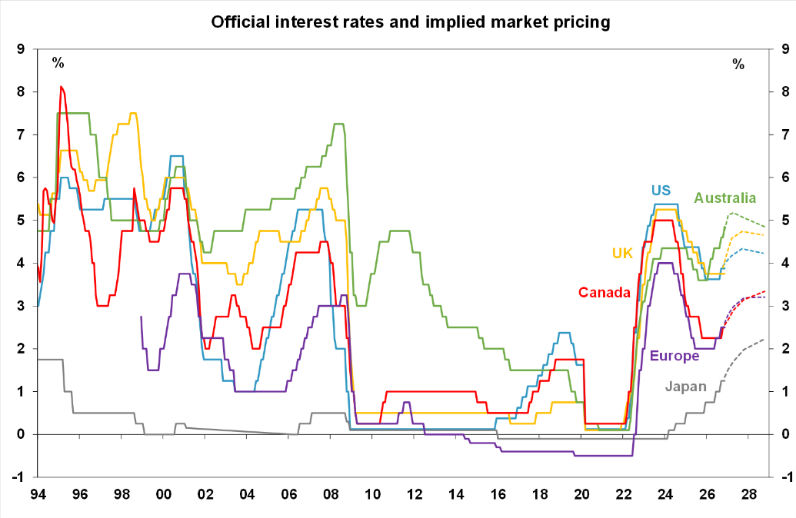
To be sure the RBA has been more aggressive in raising rates this cycle than other central banks…
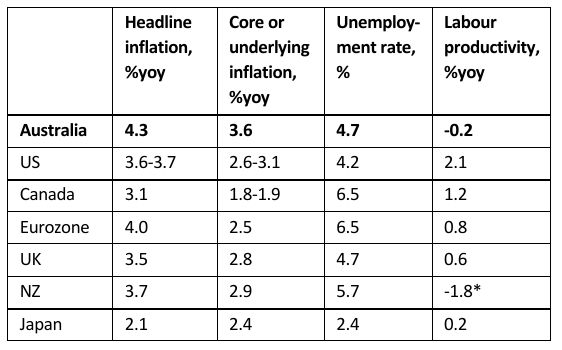
…but this reflects a combination of worse inflation compared to other major countries, lower unemployment versus some countries and poorer productivity growth, particularly compared to the US.
Australia does not compare well on inflation
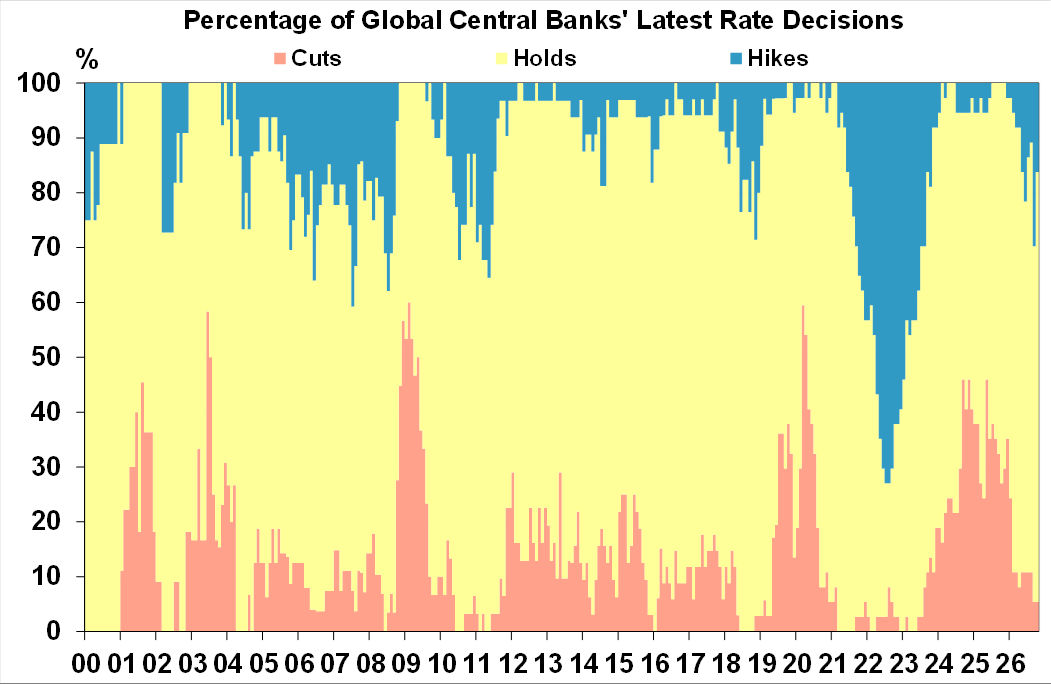
The Bank of England joined the hiking cycle in the last week raising its policy rate by 0.25% to 4% and signalled another hike unless oil prices fall. As can be seen in the next chart the global cycle has clearly moved back to rate hikes but its nowhere near as aggressive as in 2022 as inflation is not as high and rates are not starting from zero.
Major global economic events and implications
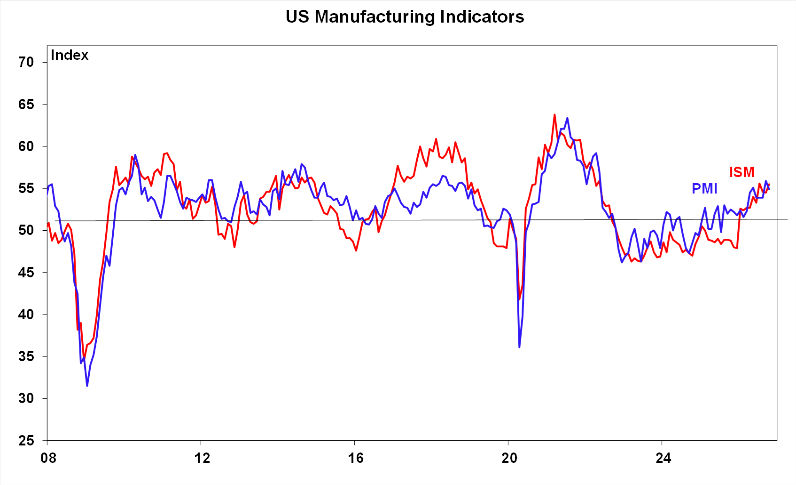
US economic data was a mostly strong. The ISM conditions indicators averaged around strong levels with strong orders and solid employment readings. This is similar to the US PMIs. But price pressures remain elevated.
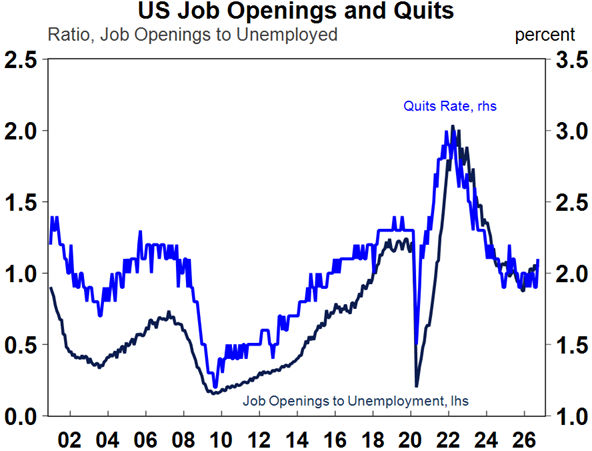
US labour market indicators were solid or showed signs of improvement with job openings, quits and hiring up in September, the ADP private jobs survey suggesting strong jobs growth for October and jobless claims remaining low. What’s more US productivity growth remained strong, up 2.1%yoy leaving unit labour costs up 2.4%yoy and not a significant source of inflationary pressure.
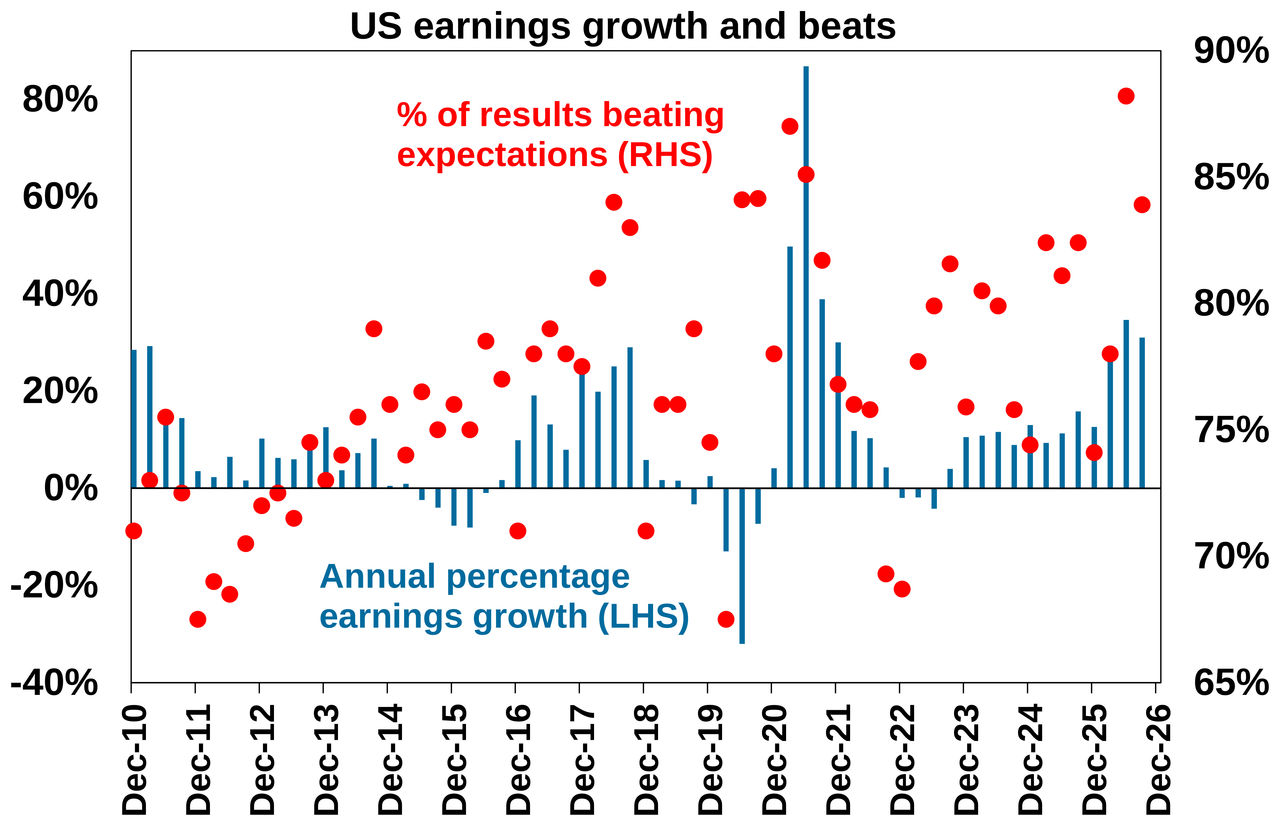
The US September quarter earnings reporting season is now nearly 90% done with 84% beating expectations and earnings growth now running around 31%yoy, up from 26%yoy at the start of the reporting season. Earnings growth is concentrated in tech (+48%yoy) and energy (+151%yoy) but the rest of the market is still seeing earnings up a solid 12%yoy. However, while strong the concern has been around tech earnings with some misses (eg, Amazon, Alphabet) and ongoing worries about excessive capex with has resulted in a decline in tech sector price to earnings multiples. In fact, while most of the market has seen earnings surprise on the upside tech earnings in aggregate are coming in a bit weaker than expected.
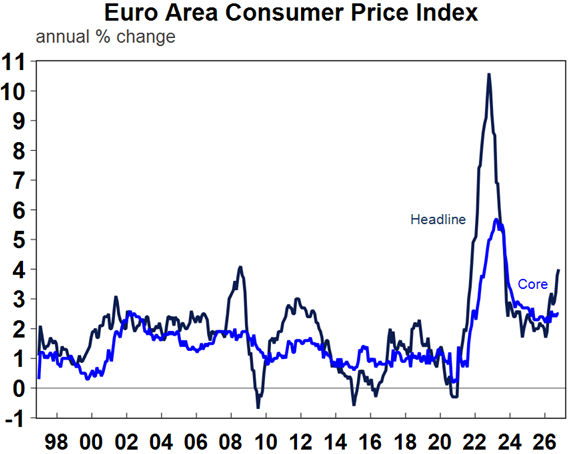
Eurozone inflation rose in October to 4% with core inflation unchanged at 2.5%. This likely leaves the ECB on track to hike again next month, but it doesn’t have to be aggressive in hiking.
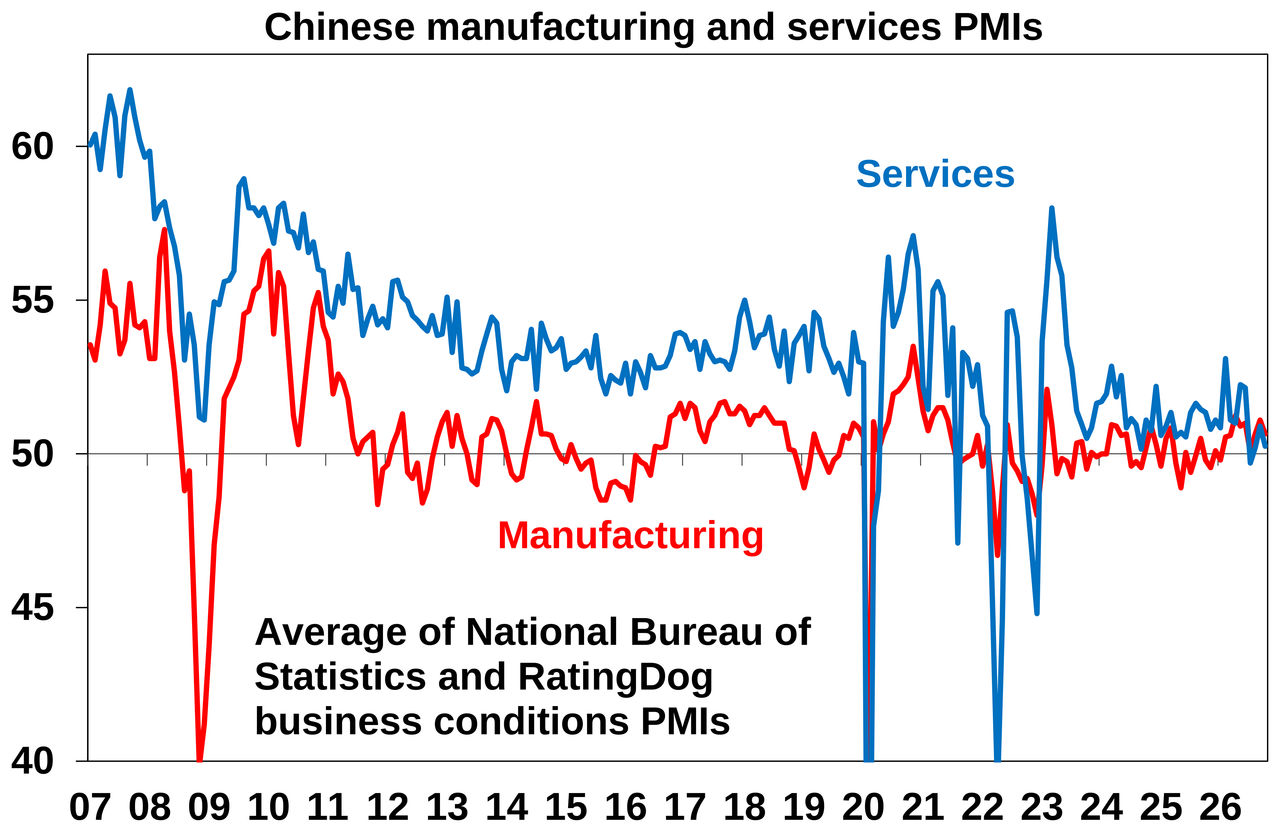
Chinese business conditions PMI’s fell slightly in October, but remain in the same range they have been in for the last few years, so there is little to get excited about here.
Unemployment rose in New Zealand to 5.7%, which could potentially further delay its next rate hike.
Australian economic events and implications
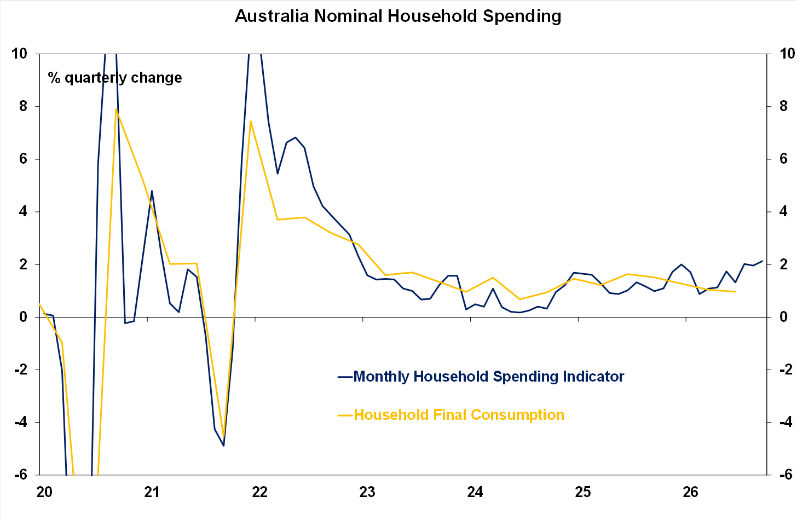
Australian household spending rose a stronger than expected 0.6%mom in September, but was mainly driven by higher fuel prices (with fuel volumes down), transport and spending on sporting and entertainment events and more visits to the GP due to flu all of which look like temporary boosts.
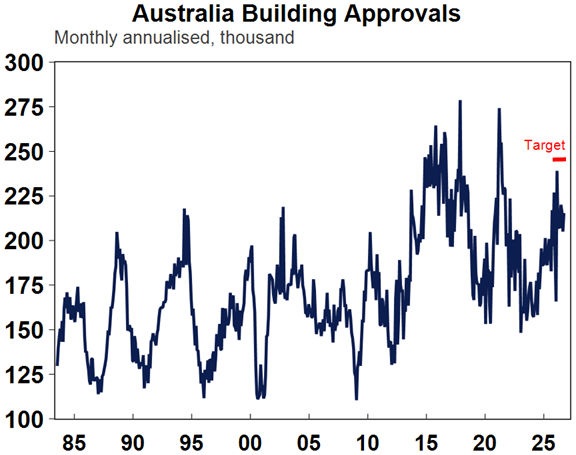
Building approvals rose 5% in September driven by volatile unit approvals. They are running around 212,000 on an annualised basis but this is still way below the Housing Accord target for 240,000 homes a year (with completions a lot lower still) and in any case approvals look to be rolling over with the rise in interest rates likely to drive a fall.
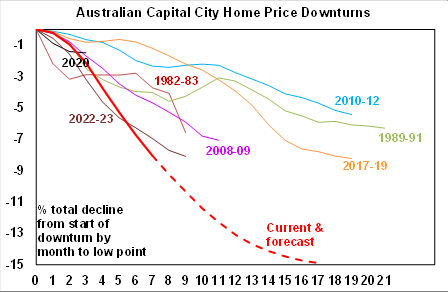
Australian home prices are continuing to fall with more to go. Australian home prices fell another 1.2% in October and are now down nearly 7%. The slump is expected to continue out to the September quarter next year as rate hikes, tax hikes on investors and poor confidence continue to weigh on demand and as distressed sales start to rise in response to rate hikes and the deteriorating jobs market. This is already the fastest slump in the last 46 years and will soon become the deepest with a 15% top to bottom fall likely. A deeper fall is possible but would require a recession and much higher unemployment, which is not our base case. The slump in home prices will knock around 1.5% off consumer spending as it leaves homeowners feeling poorer.
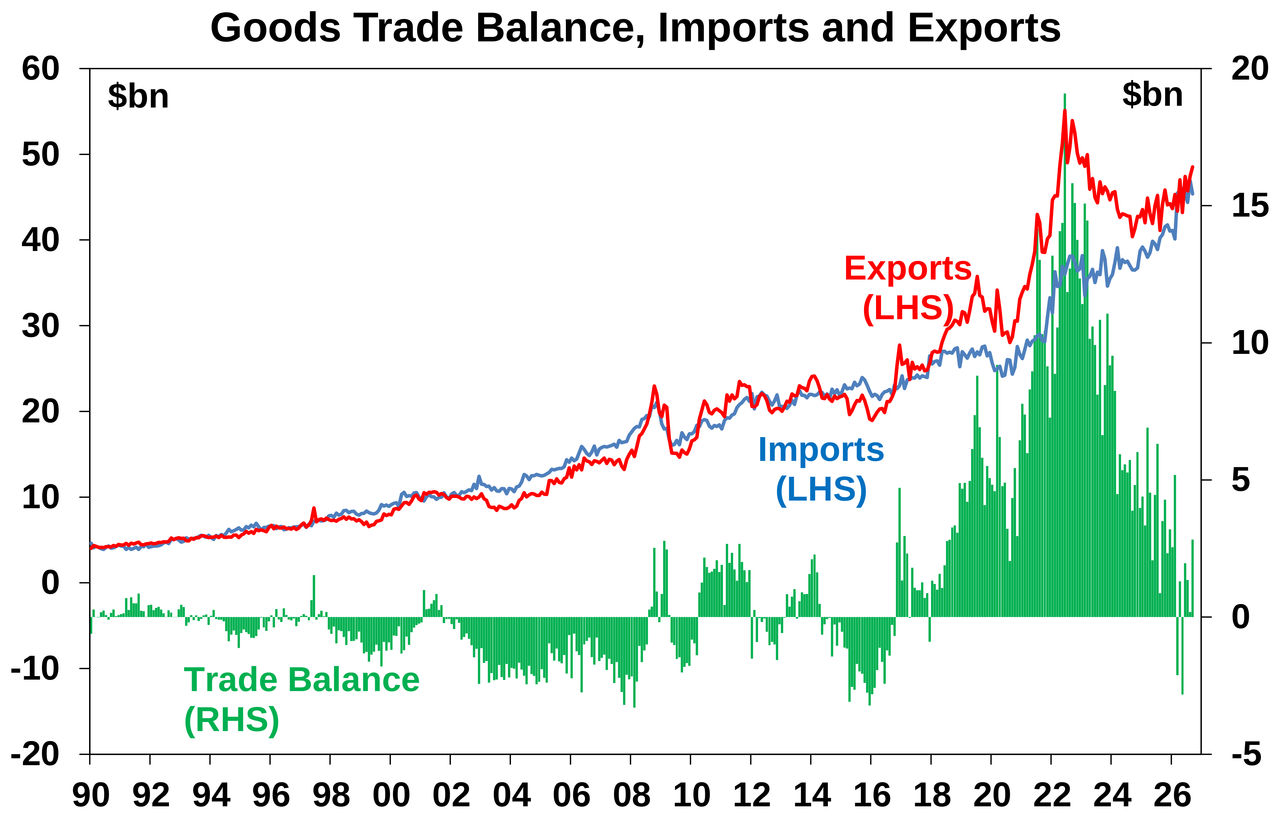
Australia’s trade balance improved in September to $2.8Bn with strong growth in iron ore and gas exports and a fall in imports although data centre related imports remained high. Trade looks like being a neutral contributor to September quarter GDP growth.
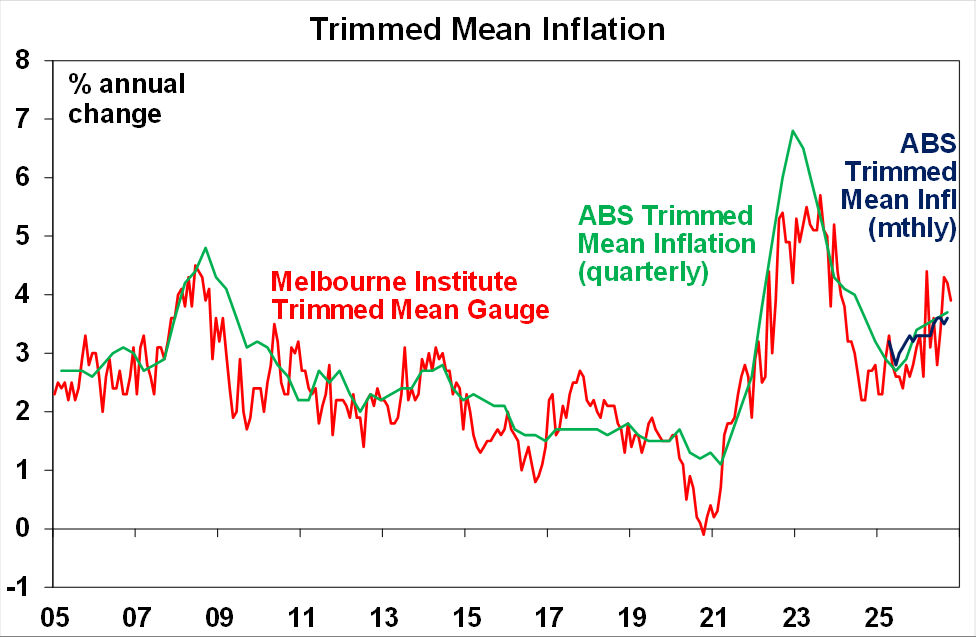
The Melbourne Institute’s Inflation Gauge remained too high in October. It rose 0.5%mom or 4.9%yoy pointing to a further rise in headline CPI inflation thanks to another rise in fuel prices and while the trimmed mean inflation rate was flat in the month its still up 3.9%yoy.
What to watch over the next week?
In the US, the focus will be on October CPI inflation data (Tuesday) which is expected to show a 0.3%mom rise in the headline CPI and core inflation at 0.2%mom. The annual rate won’t be published because no CPI data was collected in October last year. Existing home sales for October (Thursday) are expected to fall.
Chinese inflation data for October (Monday) is expected to show a fall back to 0.8%yoy but with core inflation unchanged at 1%yoy. Trade data (Tuesday) is expected to show continued strength in export and import growth.
In Australia, the Westpac/MI consumer confidence and NAB business conditions surveys (Tuesday) are expected to have weakened further partly reflecting ongoing rate hikes. Housing finance data for the September quarter (Wednesday) is likely to show a further fall of around 5% reflecting the property market slump.
Outlook for investment markets
Global and Australian share markets are at risk of a correction given the oil shock, the risk of further increases in bond yields and stretched valuations, sticky inflation and central bank rate hikes, uncertainty associated with what the blue wave from the midterm elections will bring and worries about AI. However, returns should still be okay for a while yet thanks to continuing economic growth with recession likely to be avoided, albeit it’s a rising risk in Australia, and strong global profit growth and likely rate cuts next year.
Bonds are likely to see subdued returns.
Unlisted commercial property returns are likely to be solid helped by strong demand for industrial property associated with data centres. Higher bond yields are a constraint.
Australian home prices are expected to fall around 15% top to bottom, of which they have already done 6.7%, out to the September quarter next year as a result of RBA rate hikes, reduced investor demand flowing from the winding back of negative gearing and the capital gains tax discount and poor confidence. Rising distressed sales risk also becoming a drag.
Cash and bank deposits are expected to provide returns around 4-5%.
The $A is likely to rise reflecting the wider interest rate differential to the US, although Fed hikes may limit this. Fair value for the $A is around $US0.72.


You may also like
-

Are higher interest rates working in Australia Higher interest rates are impacting Australian households, spending, housing, investment and the broader economy as the RBA works to bring inflation under control. This Econosights report explores how interest rate rises flow through the Australian economy, including the impact on mortgage repayments, consumer spending, household savings, asset prices, business investment, unemployment and the Australian dollar, and considers whether monetary policy is working as intended to ease inflation. -

Oliver's insights - House Price Slump Australian home prices continue to slide and look likely to see a 15% fall. The home price slump will weigh on economic growth via negative wealth effects, but it’s not significant enough yet for the RBA to shift gears toward cutting rates given high inflation is the more pressing problem. But it likely will be by the second half next year. -

Weekly market update - 23-10-2026 It was another rocky week across markets. For most of 2026, the narrative has been that investors have benefitted from strong earnings and AI investment. But now, rising oil prices, rising bond yields and central bank rate hikes are making the outlook more fragile.
Important information
Any advice and information is provided by AWM Services Pty Ltd ABN 15 139 353 496, AFSL No. 366121 (AWM Services) and is general in nature. It hasn’t taken your financial or personal circumstances into account. Taxation issues are complex. You should seek professional advice before deciding to act on any information in this article.
It’s important to consider your particular circumstances and read the relevant Product Disclosure Statement, Target Market Determination or Terms and Conditions, available from AMP at amp.com.au, or by calling 131 267, before deciding what’s right for you. The super coaching session is a super health check and is provided by AWM Services and is general advice only. It does not consider your personal circumstances.
You can read our Financial Services Guide online for information about our services, including the fees and other benefits that AMP companies and their representatives may receive in relation to products and services provided to you. You can also ask us for a hardcopy. All information on this website is subject to change without notice. AWM Services is part of the AMP group.