


Weekly market update
Investment markets and key developments
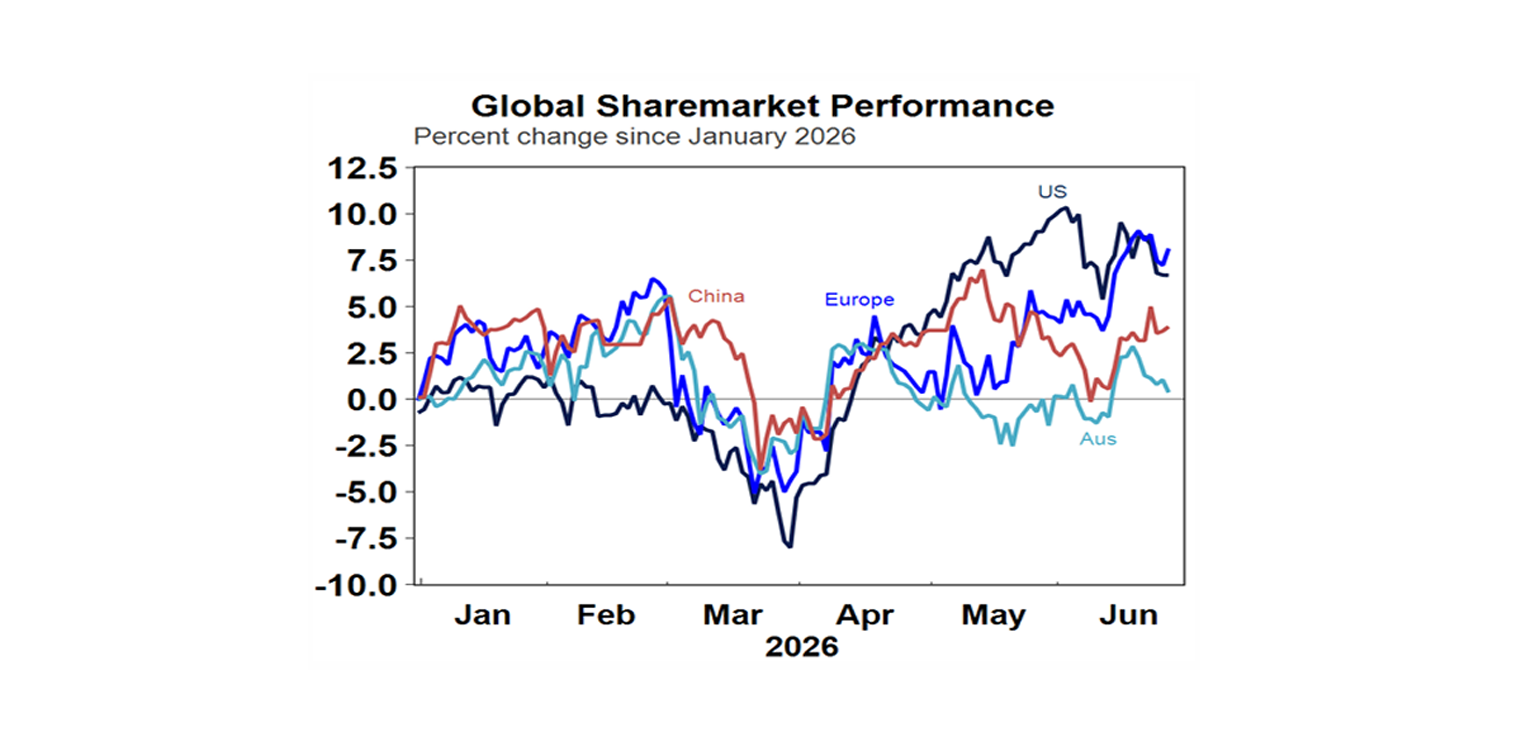
The past week saw global shares fall with tech shares under renewed pressue on concerns about an AI bubble and valuations, with reports that a ship had been struck by a missile while moving through the Strait of Hormuz not helping and adding to concerns that the Strait’s reopening and the US/Iran peace deal was fragile. Partly reflecting the weak global lead along with lower commodity prices and profit taking in the banks the Australian share market also fell with a decline of around 0.9% for the week. While consumer and health shares rose this was more than offset by weakness in tech, resources, telcos and financials.
12 min read

The past week saw global shares fall with tech shares under renewed pressue on concerns about an AI bubble and valuations. Reports that a ship had been struck by a missile while moving through the Strait of Hormuz didn’t help and along with subsequent US strikes on Iran in retaliation adds to concerns that the Strait’s reopening and the US/Iran peace deal remains fragile. For the week US shares fell 2%, Eurozone shares fell 1.3%, Japanese shares fell 2.7% and Chinese shares fell 1.5%. So far the weakness in US shares looks rotational from tech to non-tech with the equal weighted S&P reaching a new high. But partly reflecting the weak global lead along with lower commodity prices Australian shares also fell with a decline of 0.7% for the week. While consumer and health shares rose on the ASX 200 this was more than offset by weakness in tech, resources and telcos.
Bond yields fell as the fall in the oil price reduced concerns about inflation. But prices for metals, iron ore, gold and Bitcoin also fell not helped by a further break higher in the US dollar, partly due to expectations for the Fed to raise interest rates this year. This also weighed on the $A which fell below $US0.69.
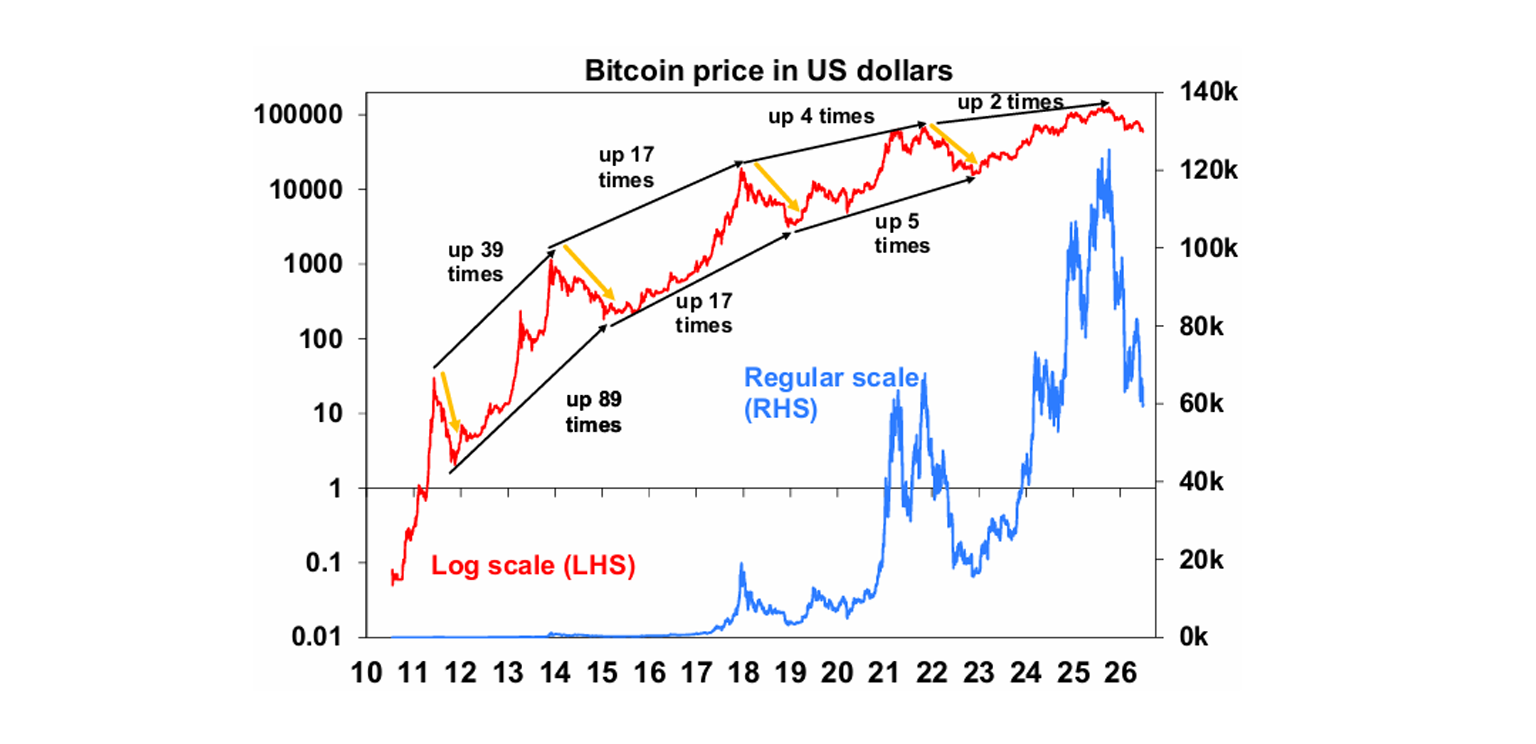
Bitcoin and gold are getting hit by expectations for Fed rate hikes - which will raise the opportunity cost of holding them - and the rising $US - as they are both priced in US dollars and benefit from being seen as a hedge against a falling US dollar. With the rise of AI and associated trades, Bitcoin and crypto have also lost some of their gloss and excitement value lately as they are no longer seen as new.
From its high in October last year Bitcoin has fallen around 53% but because it has historically gone through roughly an 80% fall every four years – see the orange arrows in the next chart - many worry that it’s in another crypto winter with potentially more to come. Consistent with this its now showing signs of breaking below its February and early June lows which were providing technical support. Of course, if it’s able to bottom here then it may be seen as very positive potentially breaking out of the four-year cycle as it matures.
Despite a rocky start and ongoing uncertainty highlighted by Iran attempting to reassert its control of the Strait, reports indicated the US/Iran talks towards a permanent peace deal were going well. This has contributed to a further fall in oil prices to now being only a few dollars above where they were before the War started.
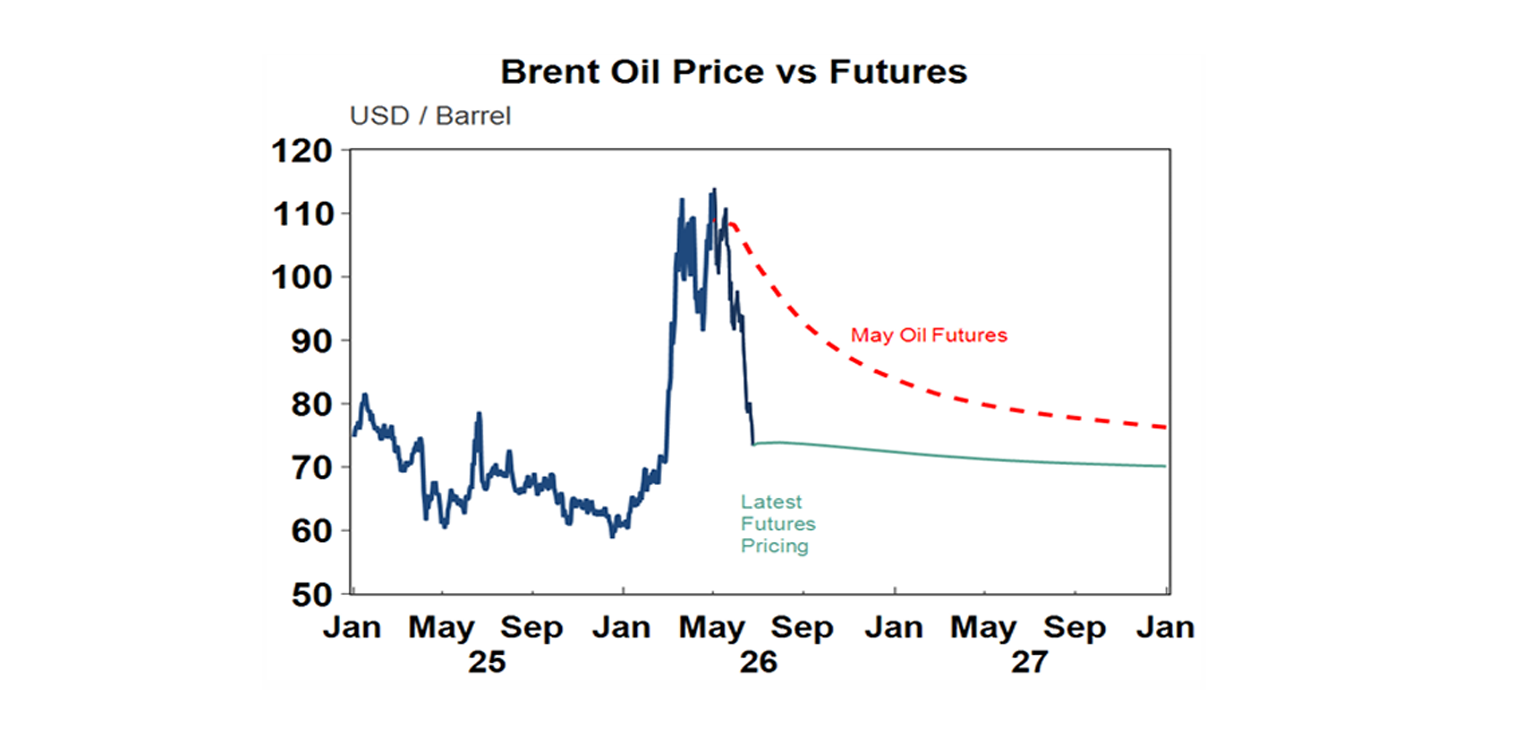
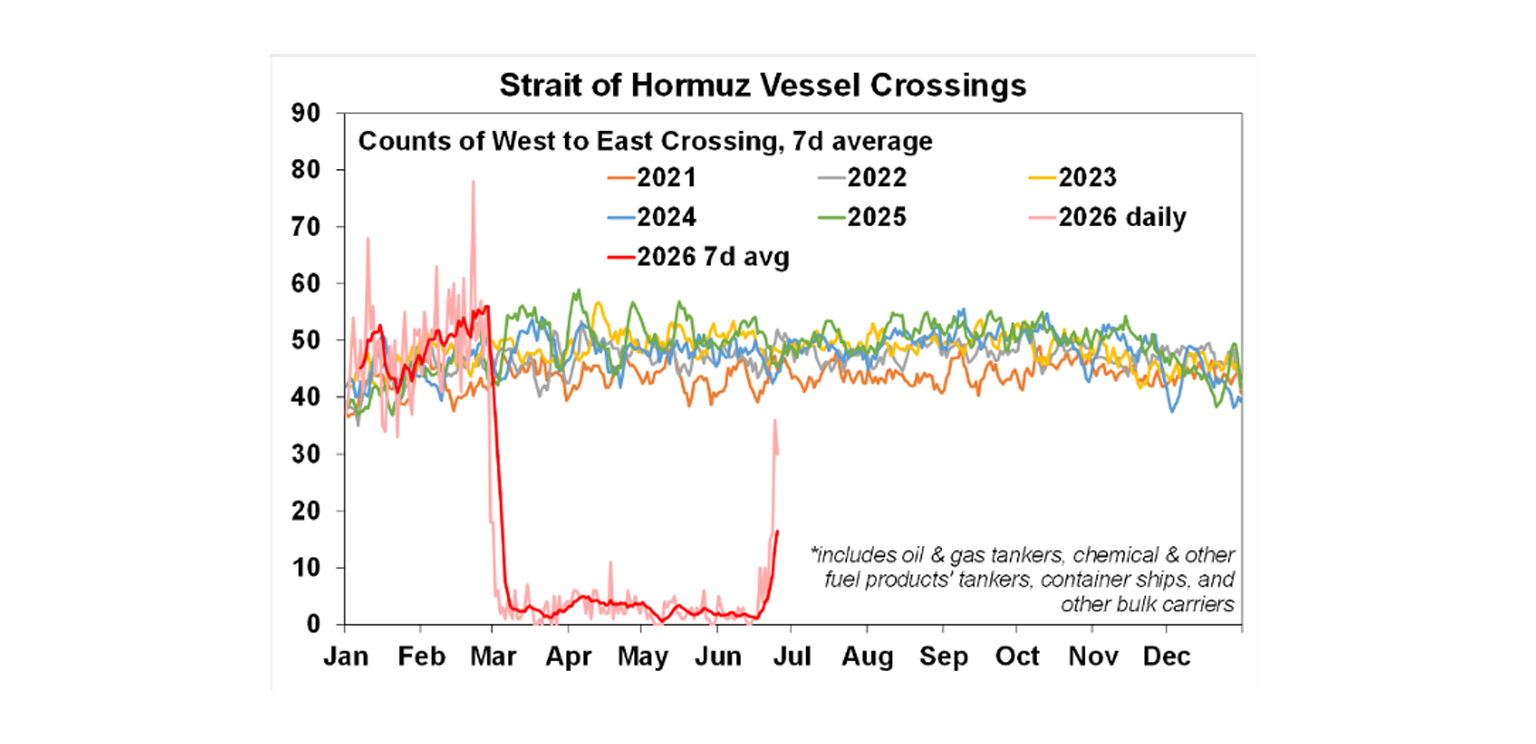
This has been supported by a pick-up in the flow of ships through the Strait of Hormuz – but it still looks very fragile posing a risk to share markets. Issues around Iran’s nuclear program, tolling through the Strait and fighting in southern Lebanon between Israel and Hezbollah may be difficult to resolve so it could still all flare up again. This has been highlighted in the last week with Iran trying to reassert its control over the Strait with an attack on a ship and the US retaliating with strikes on Iranian targets. But even if the cease fire hobbles on it could all flare up again once the US mid-terms are out of the way and political pressure on Trump recedes perhaps freeing him up to redress what looks to be a cave in to Iran. So, having fallen rapidly the decline in oil prices could soon stall out reflecting these uncertainties and as it will take a while for things to return to normal anyway. And this is what oil futures are implying.
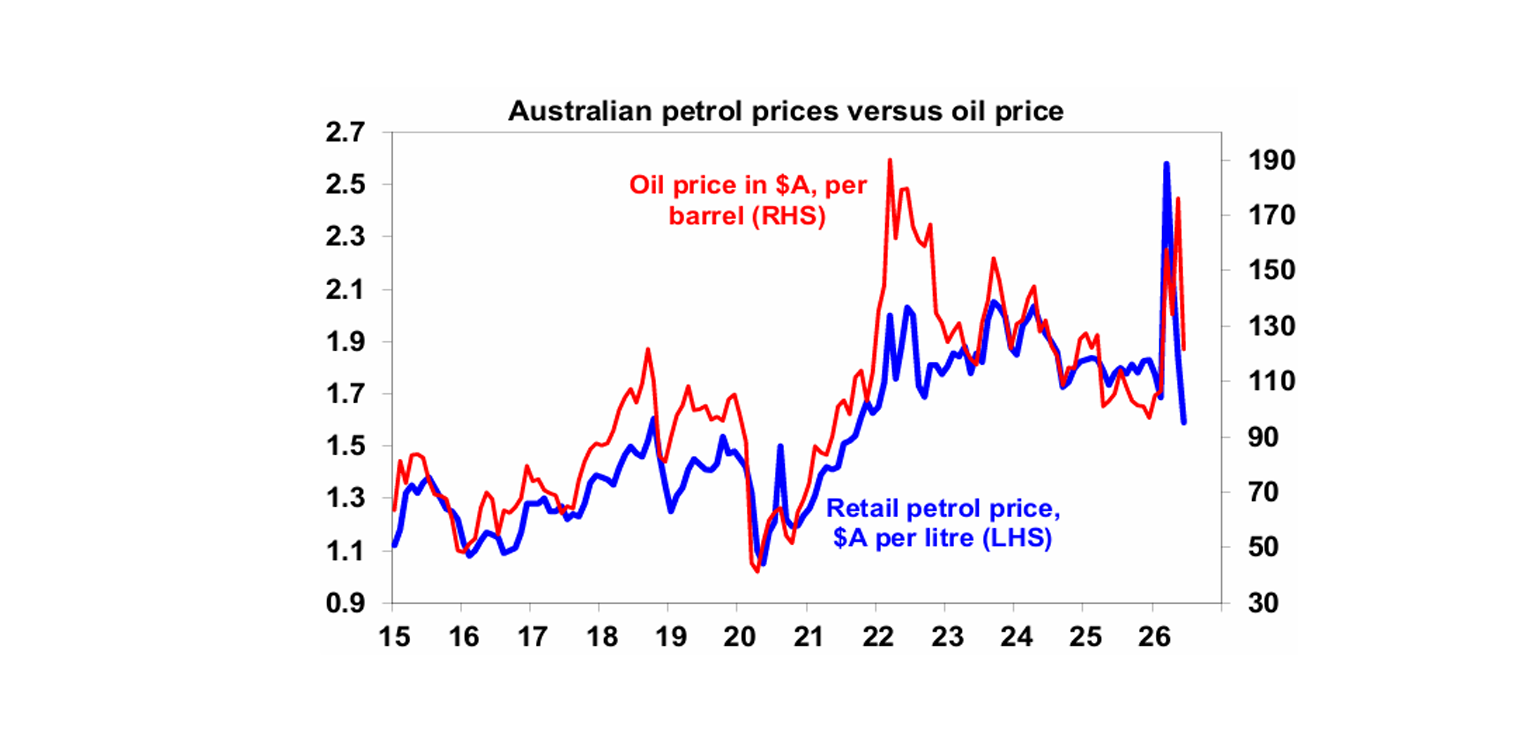
Oil price falls will partly offset the wind back of the fuel tax cuts in Australia. The Government has announced that its 32 cents/litre fuel tax cut will be reduced to 16 cents a litre from 1 July and after 2 August it’s scheduled to end. From current average capital city petrol prices of around $1.58 cents/litre this implies a rise to $1.74 on 1st July and then to $1.90 on 2nd August. However, current petrol prices are about 11 cents a litre below where they were just before the War started and the lagged flow through of the fall in oil prices over the last two weeks implies a drag of around 10 cents a litre. So, the net effect is that at current oil prices petrol prices could settle around $1.65 a litre next month and around $1.80 from 2nd August even with the phased removal of the fuel tax cuts. This is basically in the range they were in for the two years before the War.
There was mixed news from Australian inflation for May. The good news was that headline inflation fell further to 4%yoy with lower fuel and travel prices. The bad news was that trimmed mean inflation rose both in monthly terms...
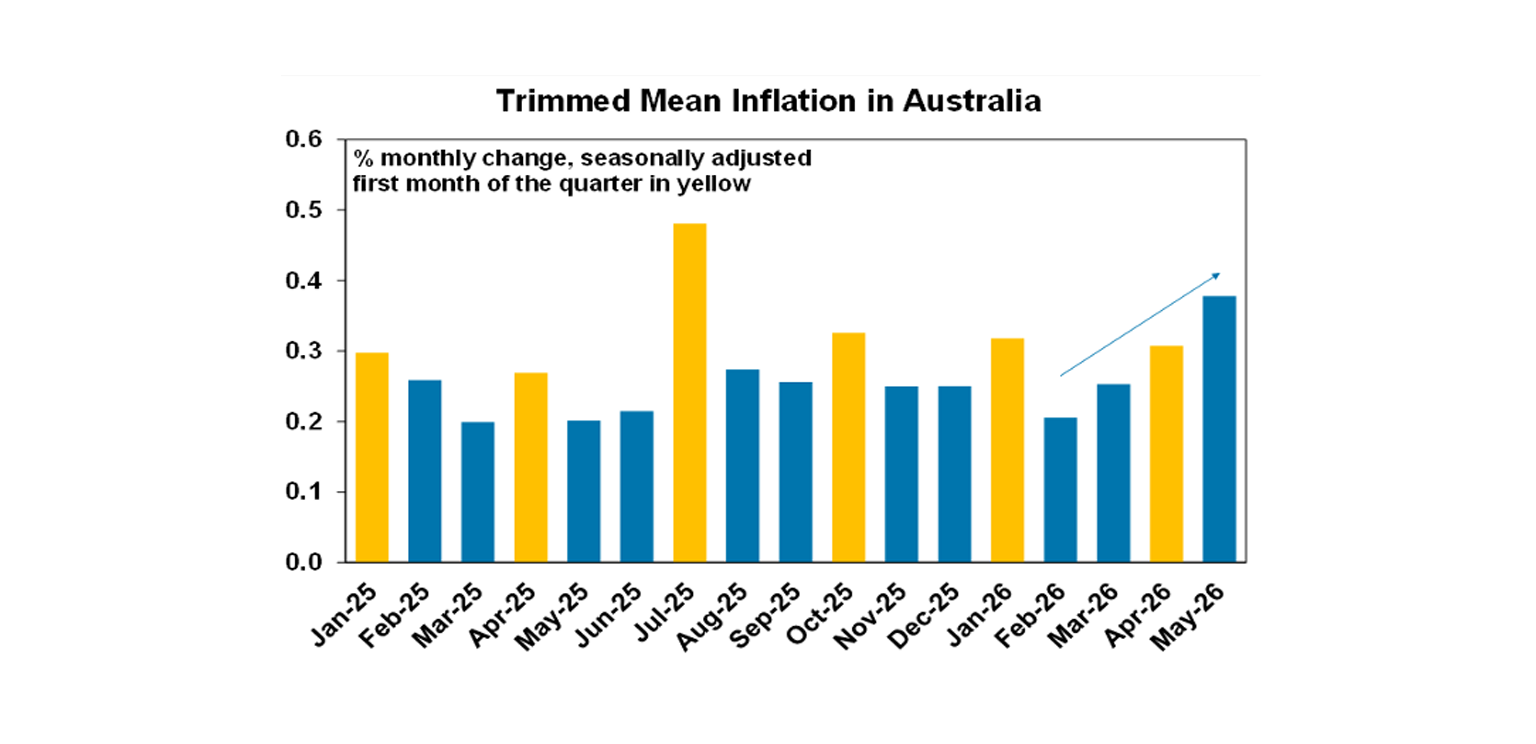
…and in year-on-year terms to 3.6%yoy.
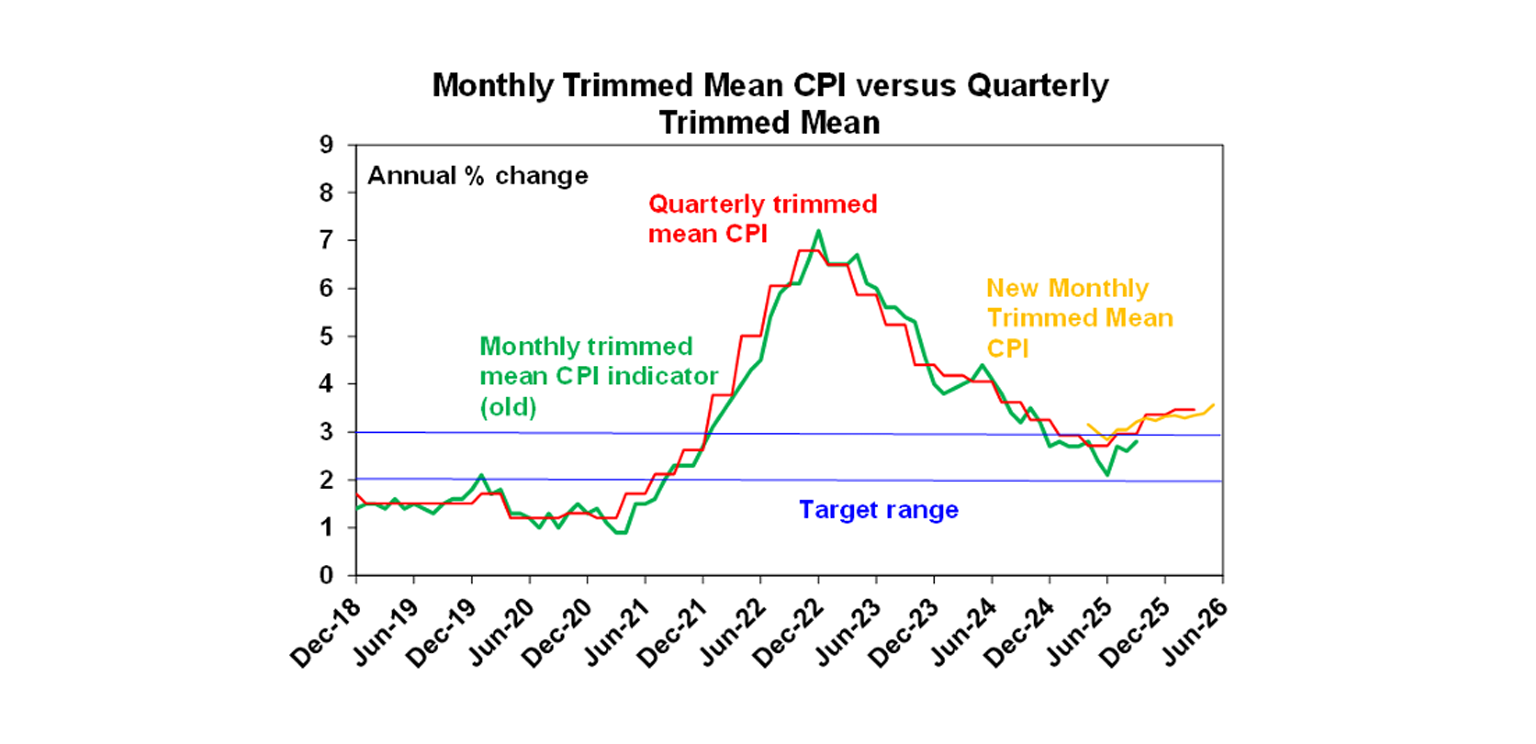
In particular, rent and new dwelling inflation accelerated, and food price inflation is high along with services. We are now back to having more CPI items with inflation above 3%yoy than below 2%yoy. Our assessment is that trimmed mean inflation is on track to have increased roughly in line with the RBA’s forecast for 3.8%yoy this quarter.

With the trend remaining up in trimmed mean inflation, second round impacts of the oil supply shock still feeding through and the acceleration in minimum and award wages likely to add to costs and prices, at the same time that May data for jobs and household spending indicate that the economy is still holding up well we remain of the view that the RBA will raise the cash rate again with the next hike in August. As RBA Deputy Governor Hauser observed after the May CPI release “we still have work to do to reduce inflation here in Australia, which remains far too high.” That said the risks to June quarter trimmed mean inflation are slightly on the downside to the 3.8%yoy forecast and along with evidence that rate hikes are working to cool property prices means that an August hike is not a certainty. We would put the probability at 60%, which is well above the money market’s 20%.
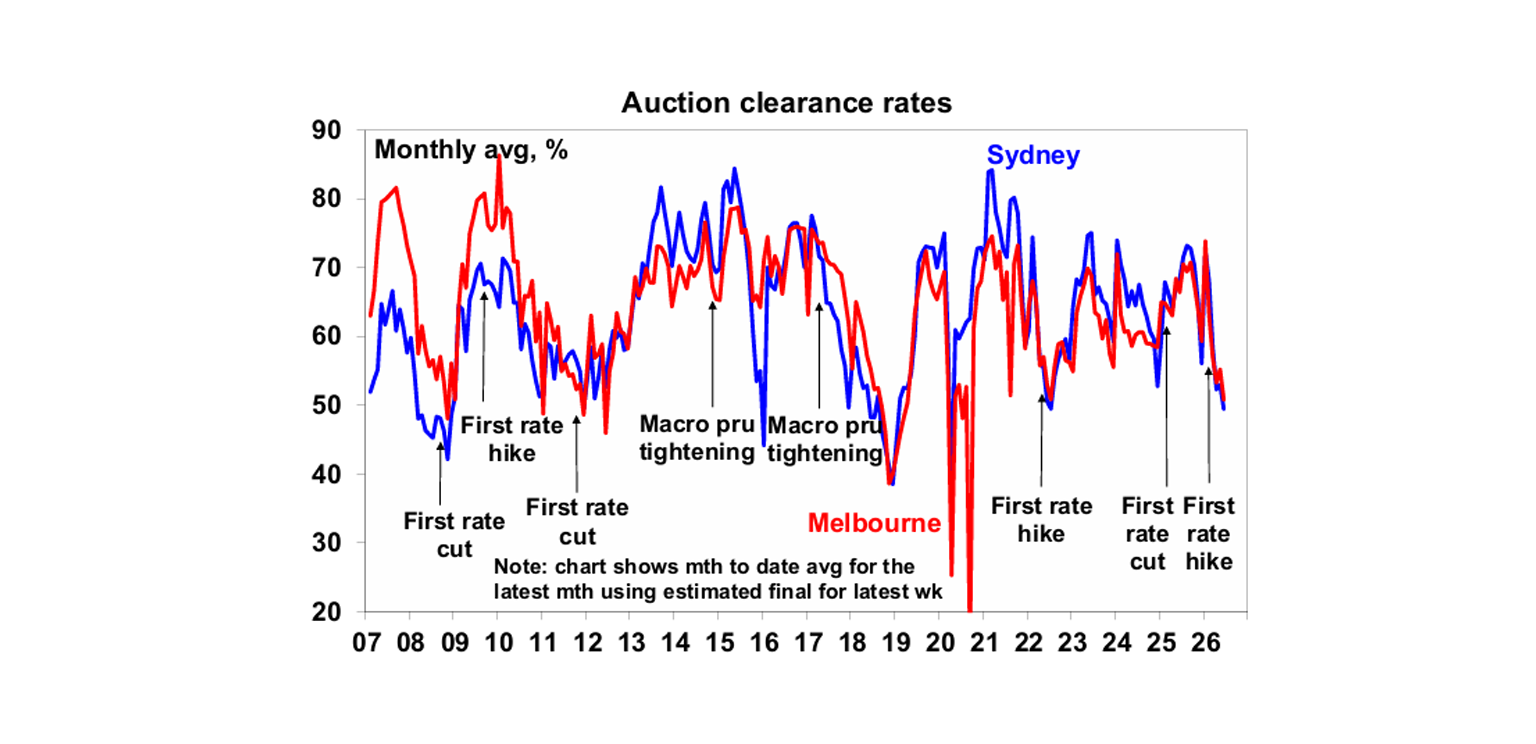
The past week has seen much excitement about the “shock, horror” plunge in auction clearance rates to 47% - with debate as to whether its a crash, a correction or not even that. Looking at the next chart it’s hard to get too excited – well at least not yet! Clearance rates started to fall last year as the RBA rate cycle went from cuts to hikes at a time when affordability was poor and it’s continued this year as rates rose, buyer confidence fell and then the Budget announced tax hikes on property investors. But so far, the fall has just taken clearances to the low end of their normal range, ie we have been here lots of times before in the last 20 years.
It’s basically the same story with home prices.
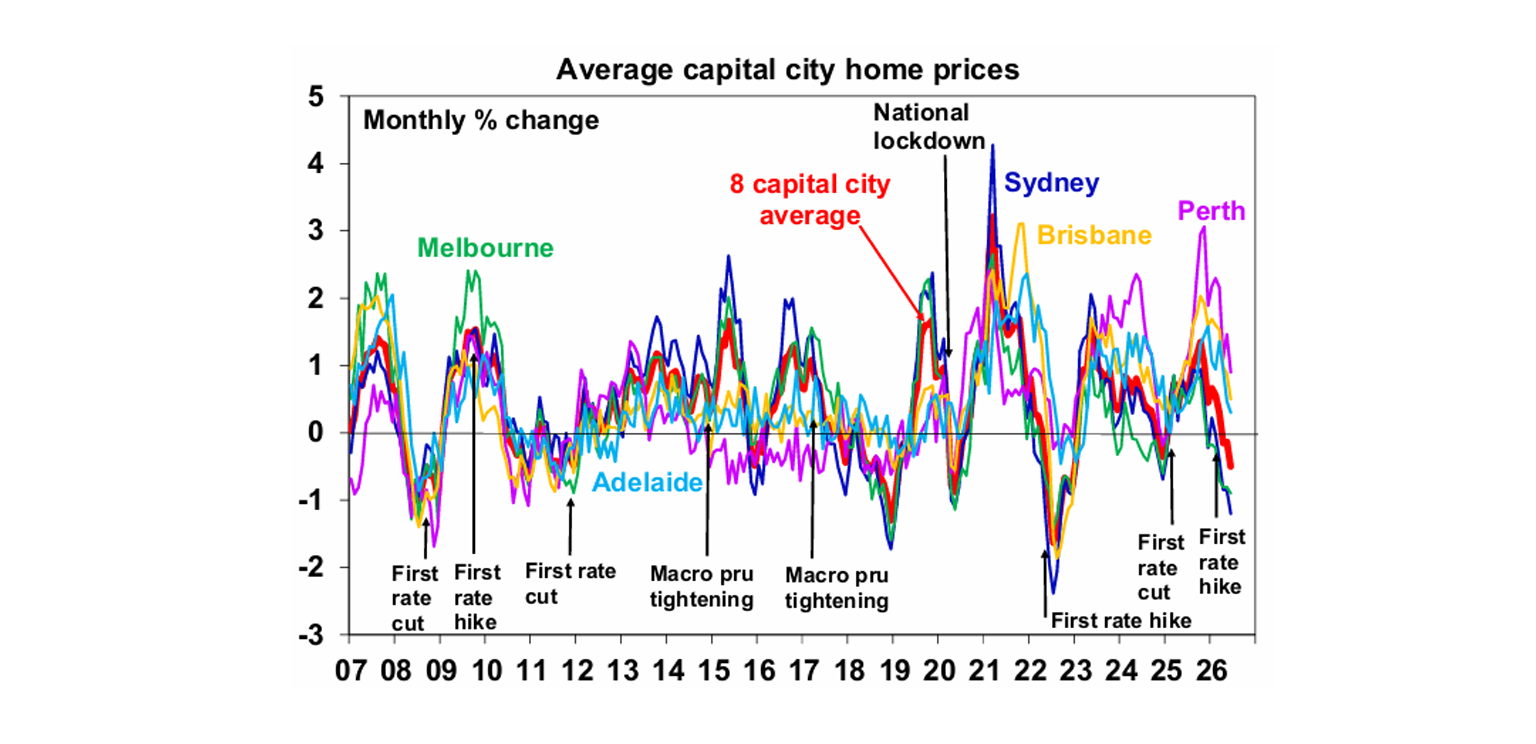
So far it really just looks like a regular cyclical correction in the property market after a strong period. Nothing extreme here. Whether it meets a definition of a correction is semantics as there is no real agreed definition of one for the property market – but it kind of looks like one. But of course, its early days yet and higher rates and the tax changes are likely to impact for a while yet so it will likely still get worse. Since the Budget we have been forecasting a 5% fall in property prices. This would be consistent with property price pull backs since the early 1980s – which have ranged from around 2% top to bottom to just over 8% for the average capital city. Of course, it could be worse as there is uncertainty around how investors will react to the tax changes and how other buyers will react to withdrawal of investors and of course a sharp rise in unemployment could be a major problem. FOMO could give rise to FONGO! Against this though, next year we expect the RBA to start cutting rates again which should start to support the property market.
Much has been written in remembrance of former Fed Chair Alan Greenspan who passed away in the last week at the age of 100, but two of his comments stand out. First that “if I unduly seem clear to you, you must have misunderstood what I said”. His successor Ben Bernanke then ushered in an era of central bank transparency, but interestingly that looks to have peaked with new Fed Chair Kevin Warsh seeking to wind back Fed comms and any guidance. Maybe transparency has already also peaked in relation to the RBA. Second was his 1996 comment about “irrational exuberance” in share markets. Of course, the then bull market raged for another four years.
Elvis Presley was not really one to promote his political and social views. Asked about war protestors just before his Madison Square Garden concerts he said, “I’d just as soon keep my own personal views about that to myself…I’m just an entertainer and I’d rather not say.” But some of his songs did provide a clear statement – notably If I Can Dream which was inspired by the assassination of Martin Luther King and In the Ghetto. Another seemed completely innocuous as the title song of a rom com where Elvis falls in love with a nun and tries to encourage her to ditch her “habit” but the lyrics to Change of Habit provided a strong statement against putting people down “just because their different or from the wrong side of town.” Of course, a lot of his songs were also frivolous like Spinout. These Josh Wildfire remixes are worth checking out too.
Major global economic events and implications
Developed country business conditions PMIs for June improved slightly with orders and employment up slightly. Input and output prices edged down but remain elevated.
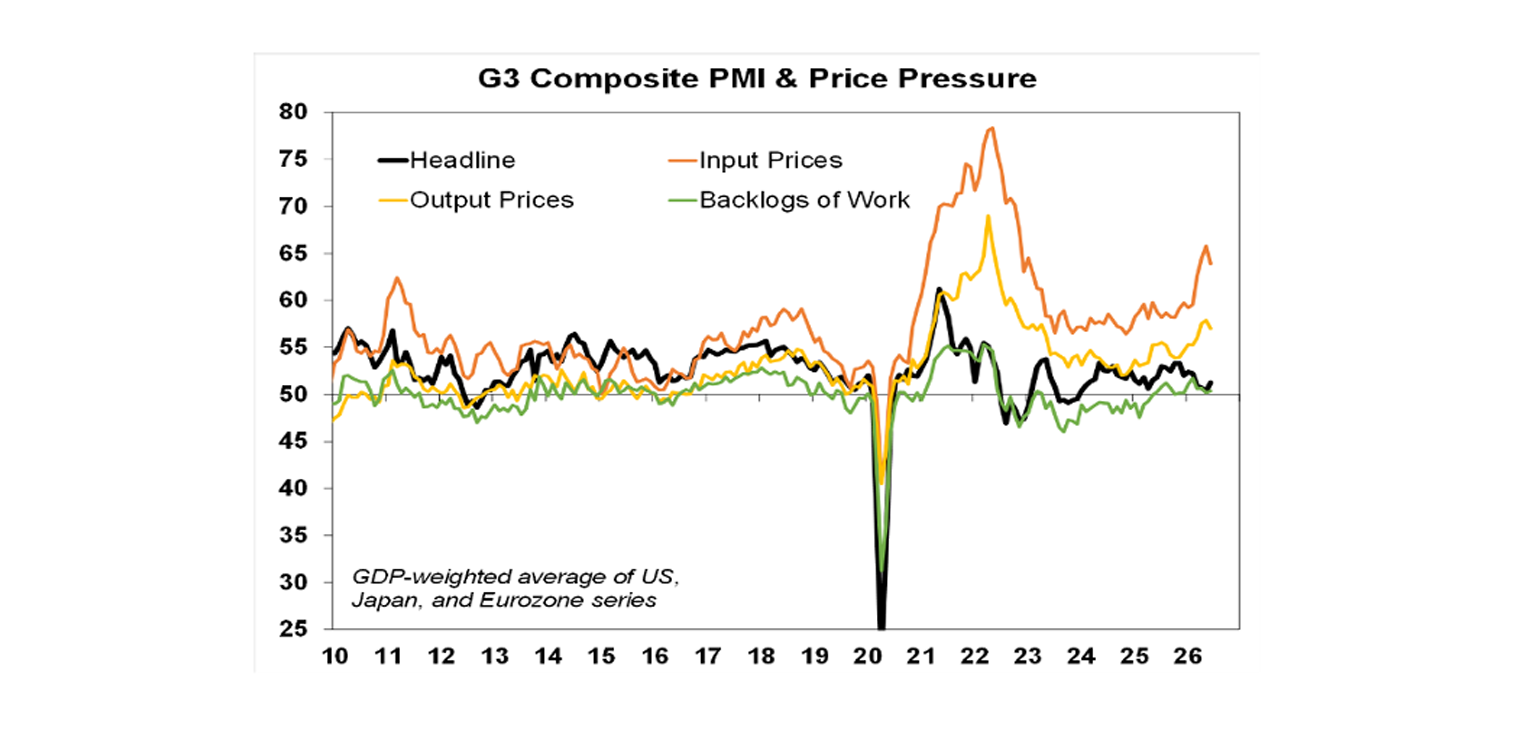
It’s a similar story in the US but with conditions being a stronger, particularly in manufacturing. And the US price indicators remain elevated.
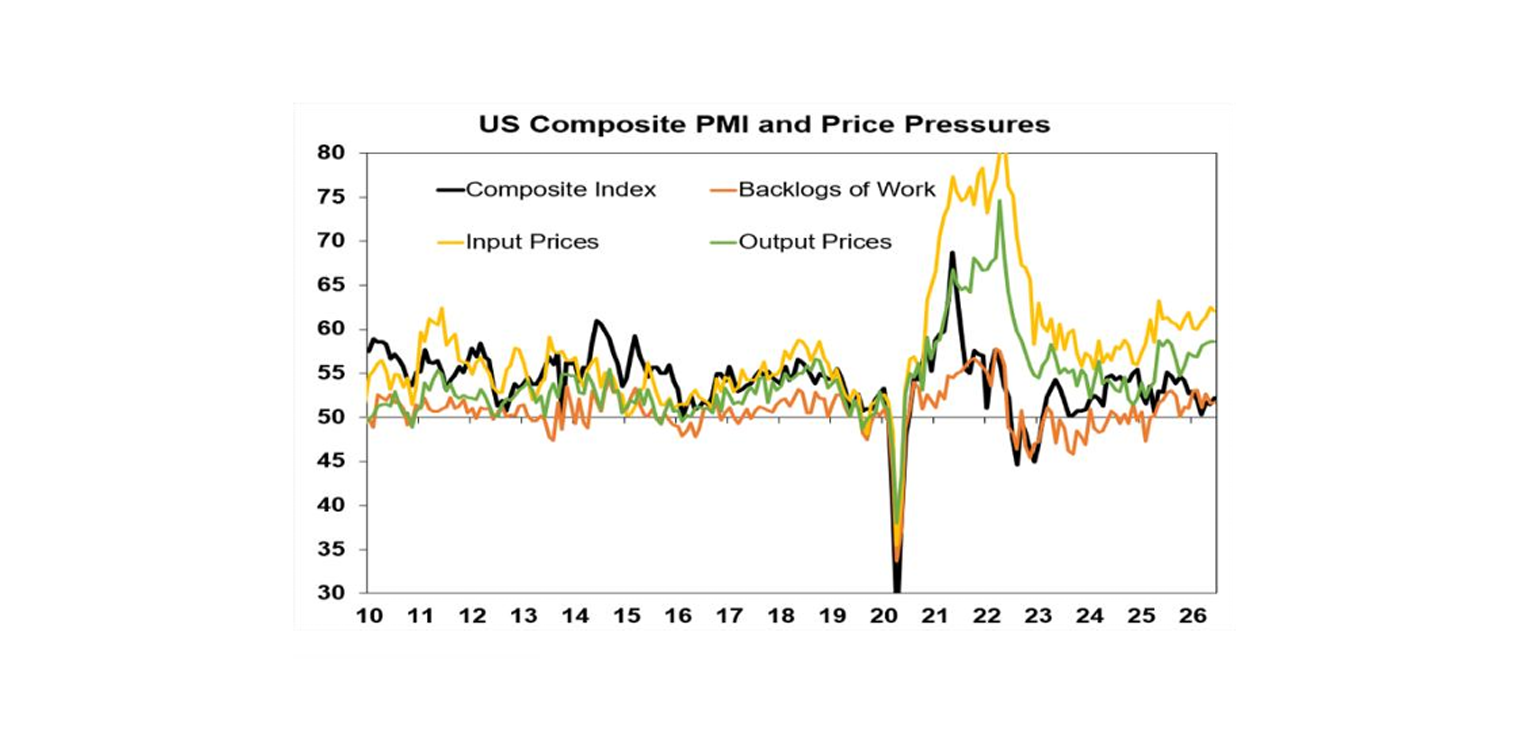
Other US data was mostly solid with March quarter GDP growth revised up to 2.1% annualised, solid gains in personal income and spending in May, continued strength in underlying capital goods orders and shipments largely reflecting the data centre boom and still low jobless claims. But new home sales were weak along with mortgage applications consistent with other housing related indicators on the back of high mortgage rates and poor affordability. Interestingly Congress passed a bill to try and improve housing affordability – by curbing large institutional investors from owning single-family homes, making it easier to build pre-fab homes and removing local barriers to home building – but Trump cancelled plans to sign it after a spat with Senate Republicans! It still likely to be signed once he calms down. Core private final consumption deflator inflation rose further to 3.4%yoy. While it was fractionally below market expectations it maintains pressure on the Fed to raise hike rates this year.
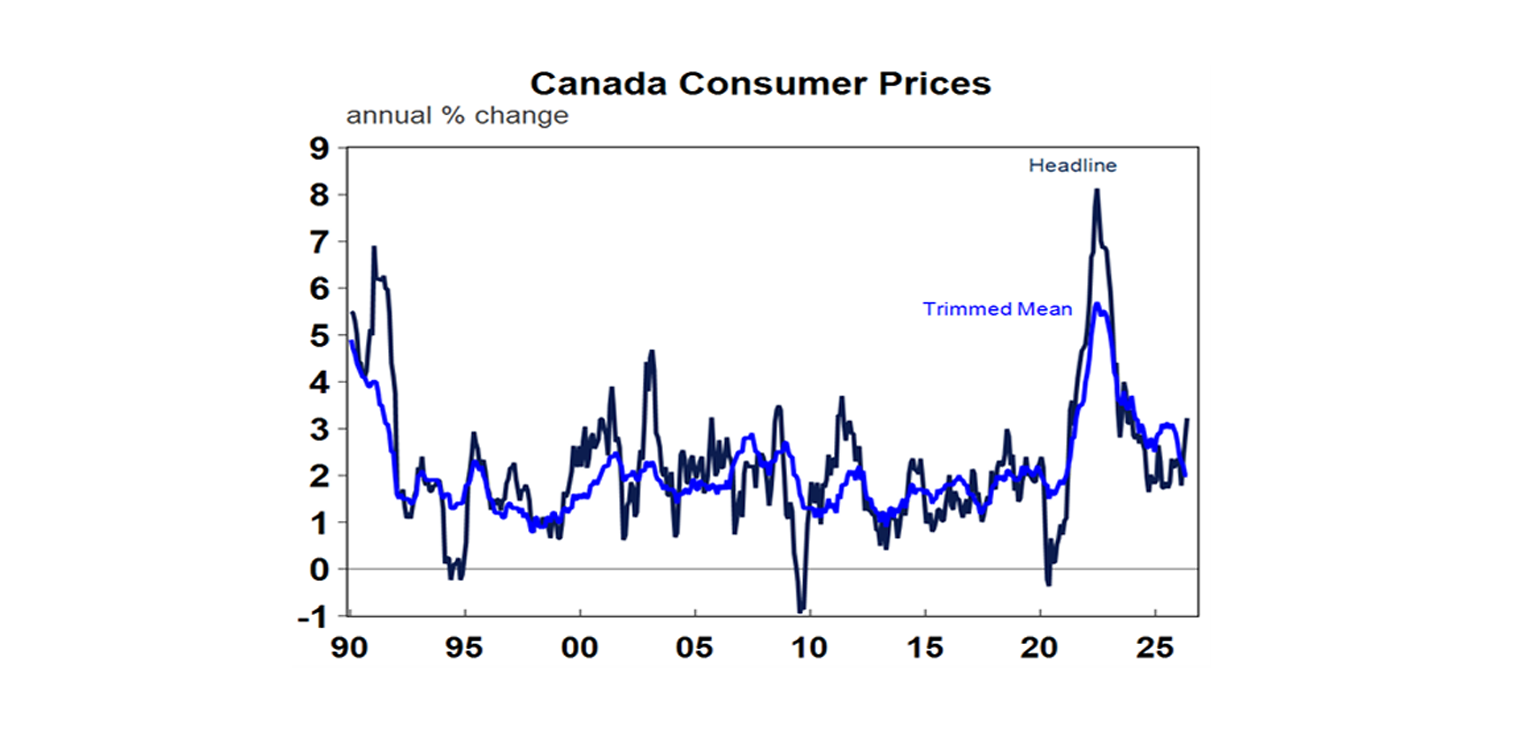
Canadian inflation rose to 3.2%yoy in May with higher energy costs but the underlying median and trimmed mean measures remained at 2.1%yoy and 2%yoy respectively. This means that there is no pressure on the Bank of Canada to hike rates just yet but the risks for rates are still on the upside given the flow through of second round impacts from the oil supply shortage. The money market sees a 60% chance of a hike by year end.
The latest change of PM in the UK with Keir Starmer resigning and likely to be replaced by Andy Burnham is unlikely to change things much. The UK has been economically and politically unstable since Brexit – with now 7 PMs in 10 years. Labour’s ability to hike tax taxes and spend on new programs is limited by already high tax and spending shares of GDP as its ability to borrow and spend is limited by a high budget deficit (three times that in Australia as a share of GDP) and high public debt (double that of Australia as a share of GDP).
Australian economic events and implications
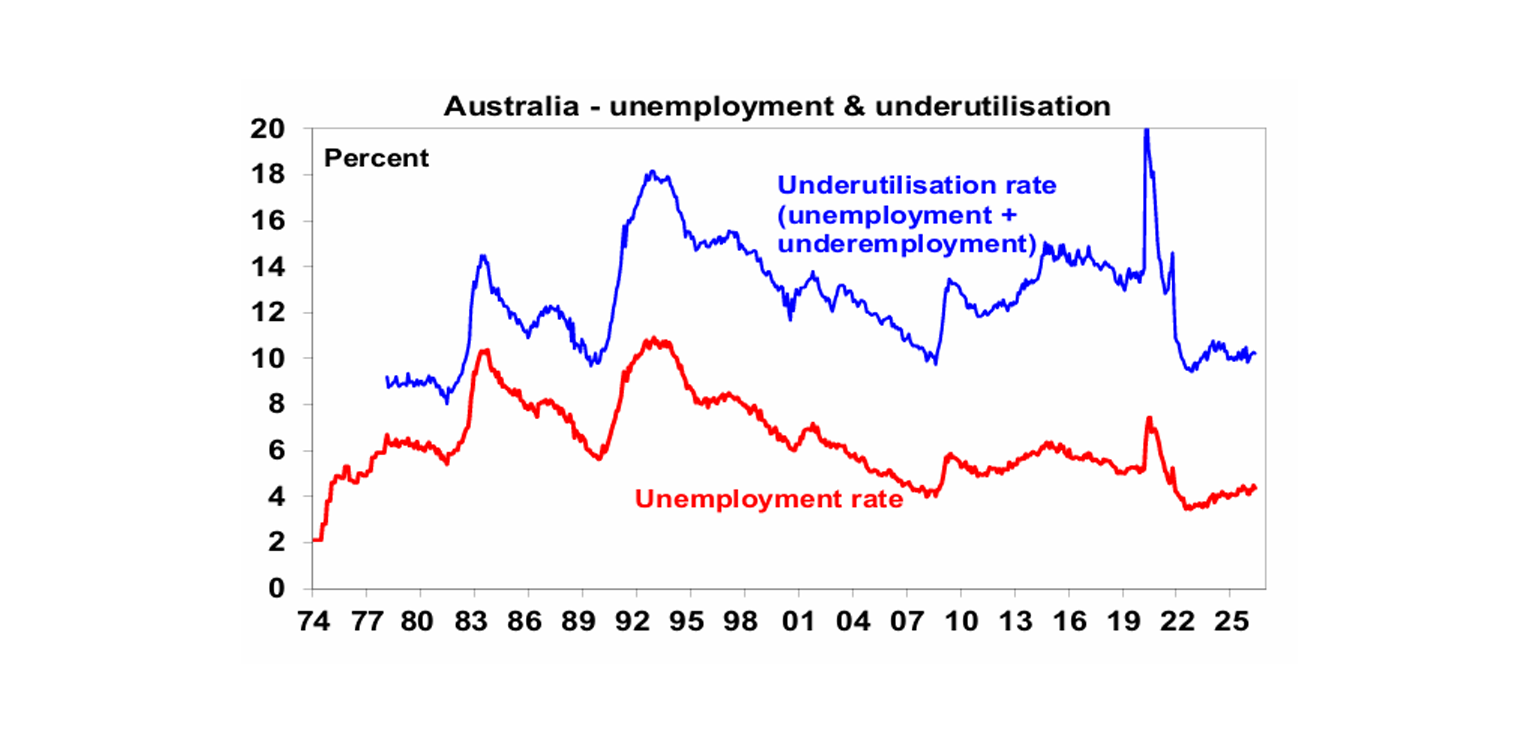
Jobs data for May was solid, reversing the weakness seen in April. Employment rebounded by 40,300 after a revised fall of 40,700 in April, unemployment fell back to 4.4% from 4.5% and underemployment fell to 10.2% from 10.3%. April’s weakness in Queensland female jobs and unemployment – which always looked more noise than signal – has now been reversed. Hours worked fell but the overall picture is that while the labour market has softened it sill remains solid with the RBA Governor still likely to characterise it as a “bit tight”.
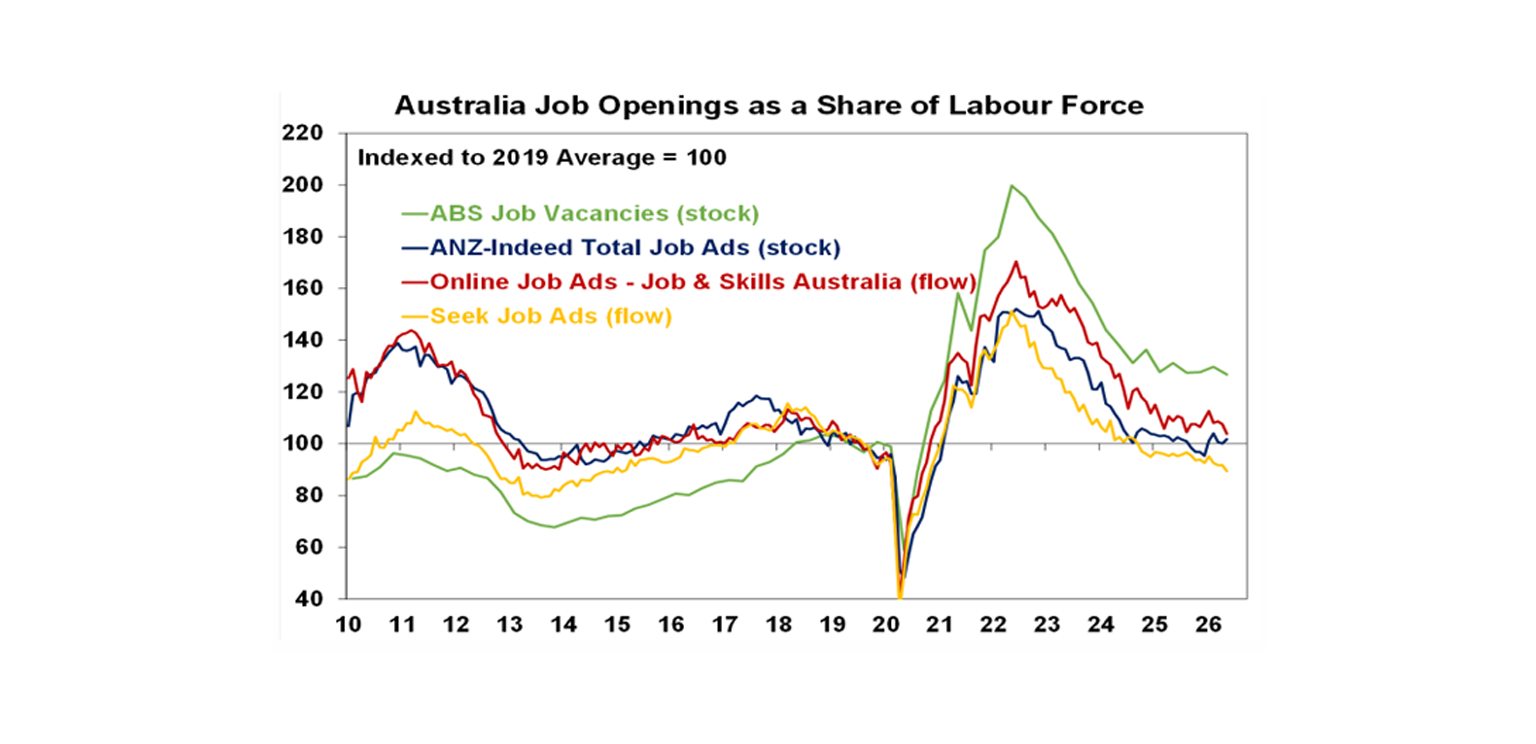
Job vacancies as measured by the ABS fell 2.1% over the three months to May – with weakness mainly in the public sector – but they remain high relative to the pre-Covid period. Private sector surveys are not so strong though. But the broad picture suggests still okay jobs growth ahead.
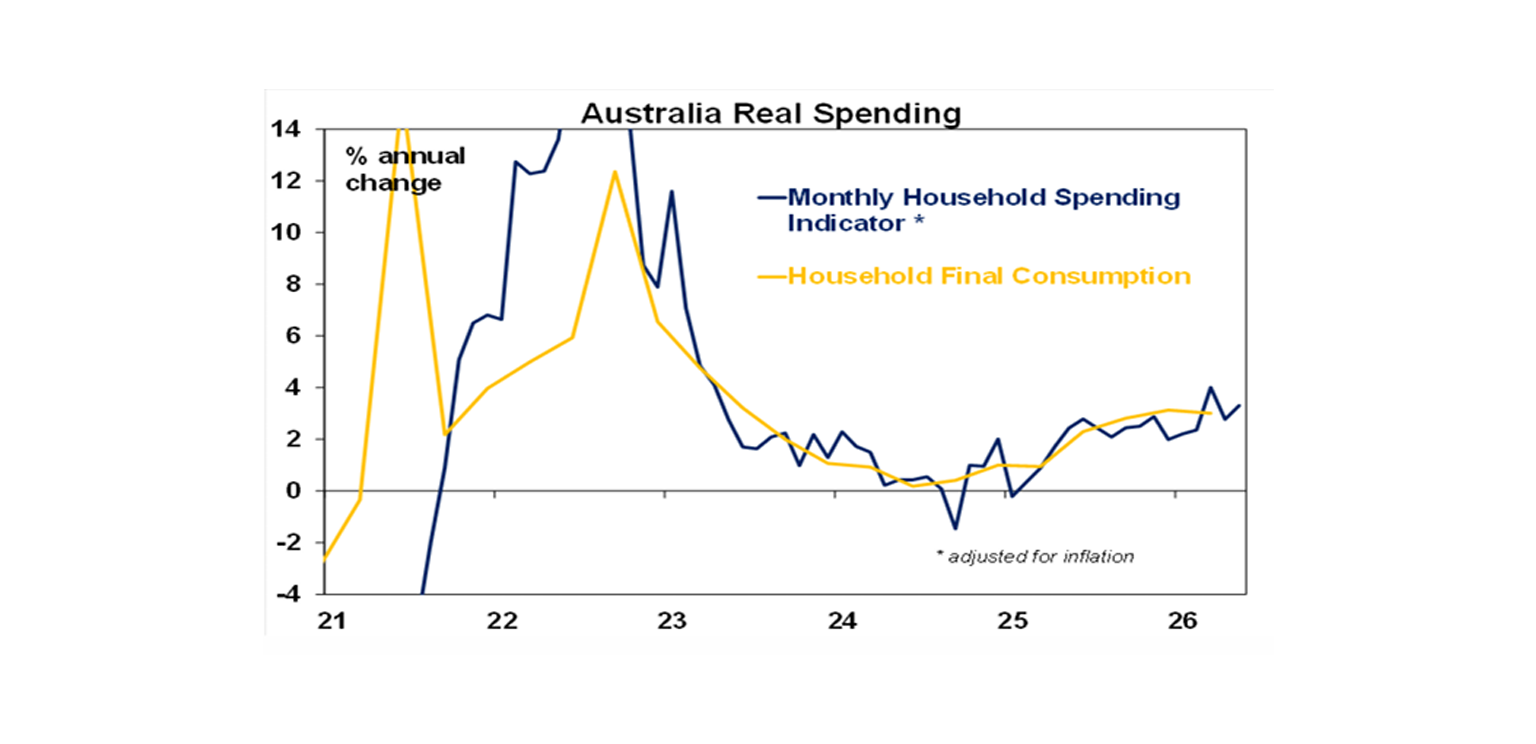
Household spending growth remains solid. The ABS’ measure of household spending rose a much stronger than expected 1.3% in May, reversing April’s fall. Looking through the monthly volatility, they are trending at a reasonable pace being up 1.7%qoq and with real spending estimated to be up 3.3%yoy. While cost of living issues are causing pain and consumer confidence is at recessionary levels it remains a case of watch what consumers do and not just what they say.
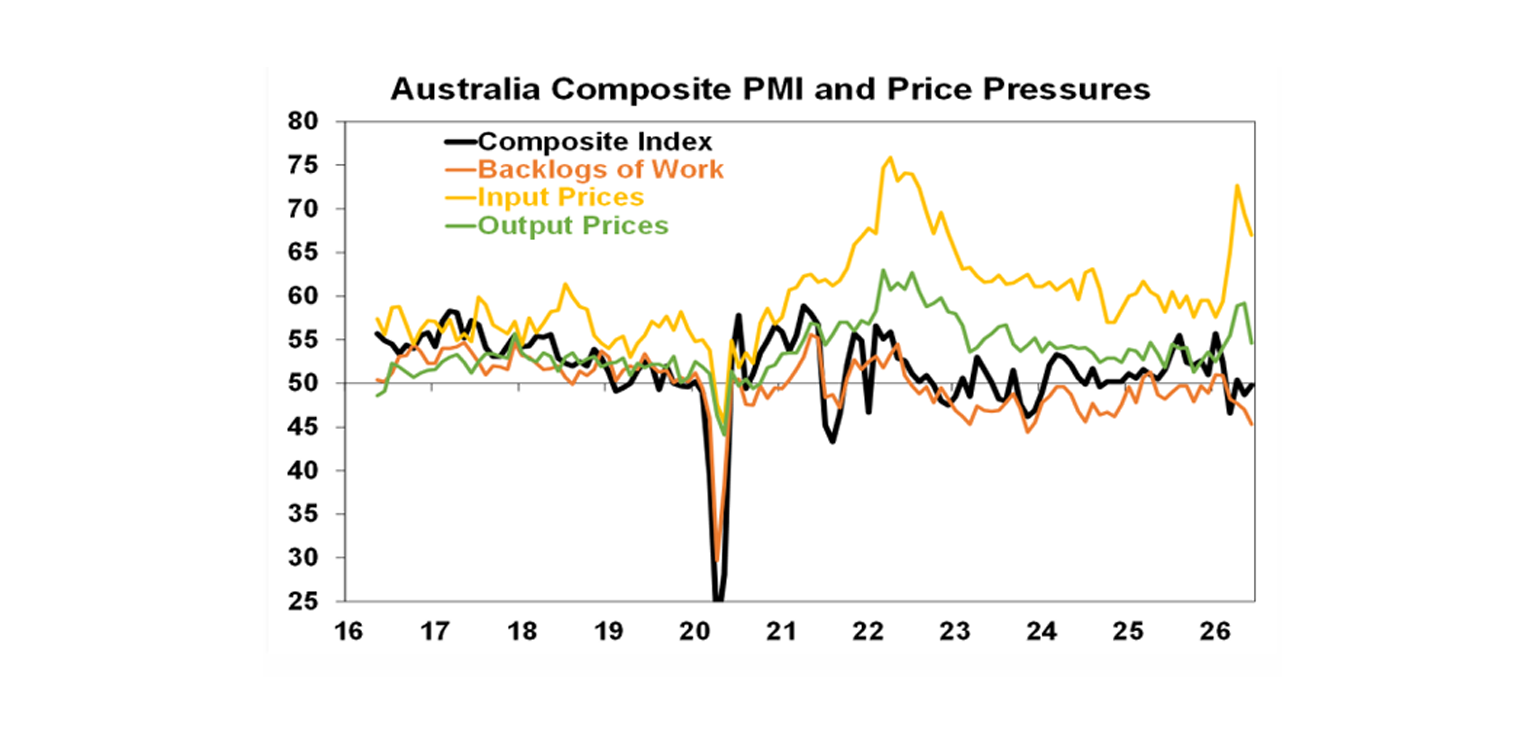
Australian business conditions PMIs for June rose slightly with improved orders and services conditions but remain subdued. Input and output price indicators fell but remain somewhat elevated – similar to the NAB survey.
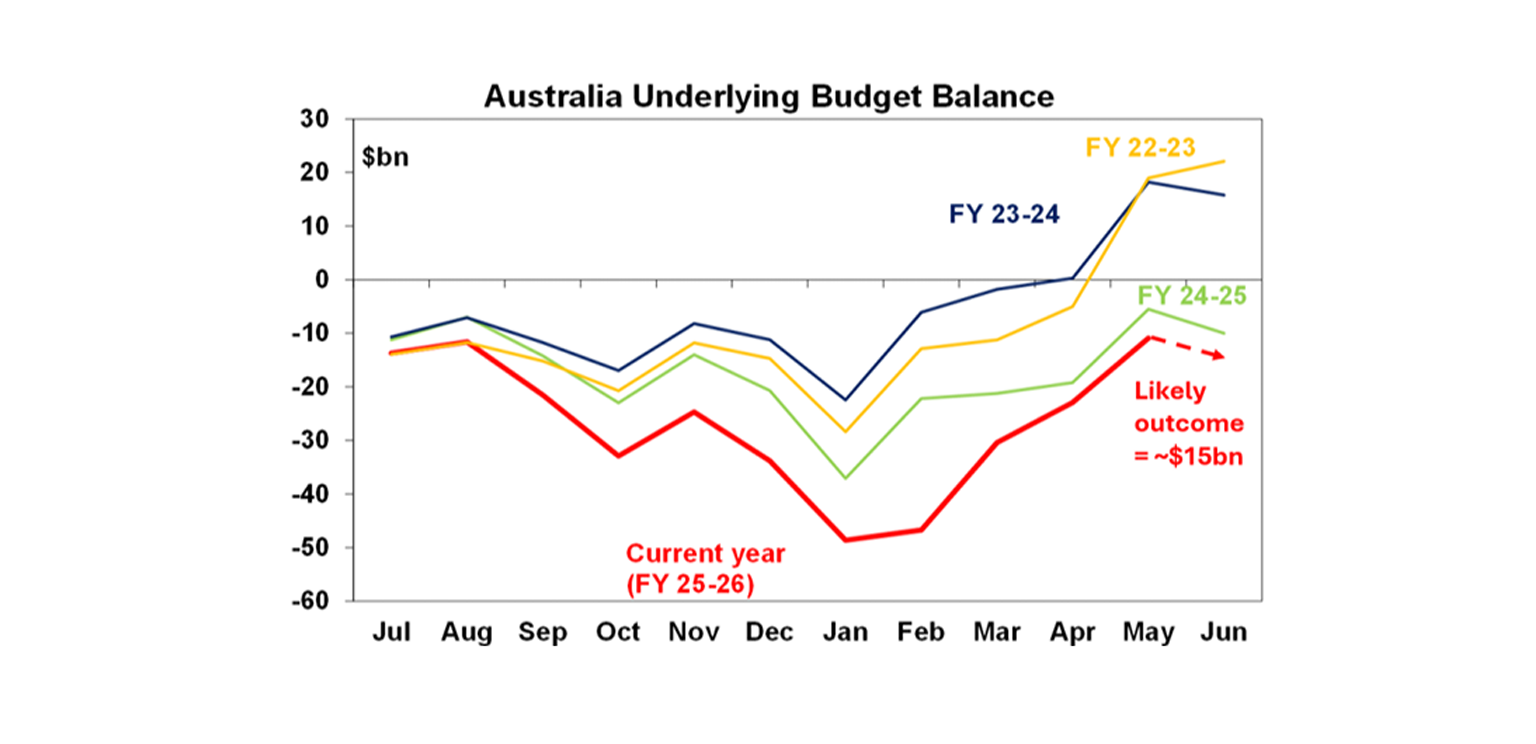
And finally, in Australia, monthly budget data to May shows the Federal budget deficit is continuing to come in way less than expected – at $10.9bn for the first 11 months of the 2025-26 financial year compared to the $18.5bn that Treasury was expecting for the same period. This reflects a continuing surge in tax revenue – on the back of higher-than-expected commodity prices boosting company profits and high employment boosting income tax – and less spending due mainly to delays in payments to states. The June numbers won’t be so good, but the 2025-26 deficit looks to be on track for around $15bn, well below the May Budget forecast of $28.3bn. The better revenue numbers will likely also flow through to lower starting point deficits in future years, but the key is that the Government bank the windfall as spending it will only inflame inflationary pressures.
What to watch over the next week?
In the US, consumer confidence is likely to rise reflecting falling gasoline prices, job openings are likely to remain okay but home prices are likely to have fallen further (all due Tuesday), the ISM manufacturing conditions index for June (Wednesday) is likely to have remained solid and non-farm payrolls (Thursday) are likely to have risen by a solid 120,000 with unemployment remaining at 4.3%.
Eurozone inflation for June (Wednesday) is likely to have fallen to 3.1%yoy, with core still 2.6%yoy. Unemployment (Thursday) is likely to have remained at 6.3%.
Japanese data for jobs and industrial production (Tuesday) and the June quarter Tankan business survey (Wednesday) will be released.
Chinese business conditions PMIs for June (Tuesday) are likely to remain around soft levels.
In Australia, the minutes from the last RBA meeting (Tuesday) will likely reiterate that it retains a tightening bias given high underlying inflation. On the data front expect May credit data (Tuesday) to show early signs of a slowing in housing credit growth particularly for investors, building approvals (Wednesday) to rebound by 3% and the trade surplus (Thursday) to rise to around $2.5bn. Cotality data for June is expected to show a further housing market slowdown with national home prices falling 0.3% led a 1.2% fall in Sydney and a 0.9% fall in Melbourne as rate hikes and tax hikes on investors hit.
Outlook for investment markets
Global and Australian share markets are likely to remain volatile with the risk of another correction given uncertainty about the peace deal with Iran, still stretched valuations, political uncertainty associated with Trump & the midterm elections and worries about the impact of AI and whether there is an AI bubble. However, returns should still be positive for the year as a whole thanks to Trump still likely to pivot to consumer-friendly policies ahead of the mid-terms, continuing economic growth with recession avoided and solid profit growth.
Bonds are likely to see returns below running yield this year.
Unlisted commercial property returns are likely to be solid helped by strong demand for industrial property associated with data centres.
Australian home prices are expected to fall around 1% this year and by 5% over the next 12 months as a result of poor affordability, RBA rate hikes, reduced investor demand flowing from the winding back of negative gearing and the capital gains tax discount and poor confidence. A 5% fall is consistent with just another cyclical downswing of which there have been several over the last two decades.
Cash and bank deposits are expected to provide returns around 4-5%.
The $A is likely to rise reflecting the wider interest rate differential to the US, although a move to Fed hikes may limit this. Fair value for the $A is around $US0.72.
You may also like
-

Oliver's insights - Why have Australian living standards “fallen” and how do we fix it? For the last few years there has been much talk of a “cost-of-living” crisis in Australia and of “falling living standards”. This has flared up again lately with the pickup in inflation resulting in a renewed fall in real wages. -

Weekly market update - 10-07-2026 Ceasefire over but markets are also over the war, Why oil prices can't go too low or too high, Is AI adding to inflation risk or taking it away, and Australia’s wage problem. -

How to protect yourself from phishing and impersonation scams Phishing scams can look like everyday messages – emails, texts or calls. Learn the signs and simple steps to protect your money and personal information.
Important information
While every care has been taken in the preparation of this document, neither National Mutual Funds Management Ltd (ABN 32 006 787 720, AFSL 234652) (NMFM), AMP Limited ABN 49 079 354 519 nor any other member of the AMP Group (AMP) makes any representations or warranties as to the accuracy or completeness of any statement in it including, without limitation, any forecasts. Past performance is not a reliable indicator of future performance.
This document has been prepared for the purpose of providing general information, without taking account of any particular investor’s objectives, financial situation or needs. An investor should, before making any investment decisions, consider the appropriateness of the information in this document, and seek professional advice, having regard to the investor’s objectives, financial situation and needs. This document is solely for the use of the party to whom it is provided.
This document is not intended for distribution or use in any jurisdiction where it would be contrary to applicable laws, regulations or directives and does not constitute a recommendation, offer, solicitation or invitation to invest.