





Weekly market update
Investment markets and key developments
Ceasefire over but markets are also over the war, Why oil prices can't go too low or too high, Is AI adding to inflation risk or taking it away, and Australia’s wage problem.
11 min read

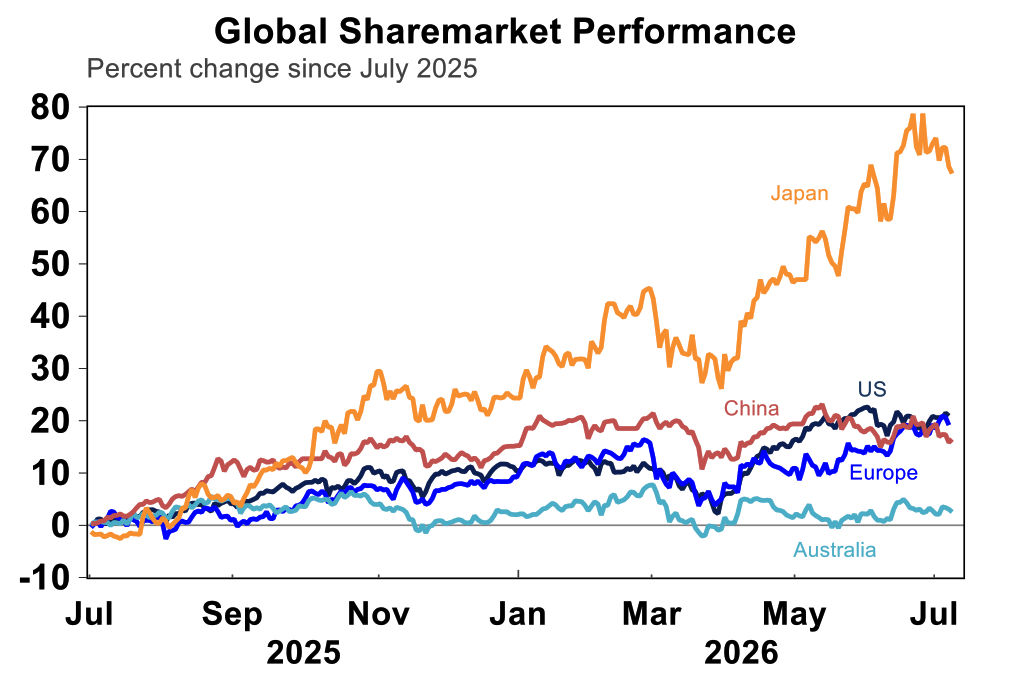
The US-Iran ceasefire is “over” but Iran had “called and wanted to make a deal” and Hormuz traffic will soon be declared open, so shares are slightly up – what’s new?! Over the last week, global markets first tumbled after US forces launched new strikes against Iranian military targets on Tuesday, while Iran responded by targeting US bases in the Gulf including in Kuwait, Bahrain and Qatar. Clearly downside risks have risen, but markets seemed to agree that the worst of the war is behind us. US shares are up by 1.2% for the week, led by tech stocks and consumer discretionary. More vulnerable regions saw shares down including the Eurozone which fell by 2.2% and Japanese shares which were down 1.7%, while the ASX 200 fell slightly by 0.4%.
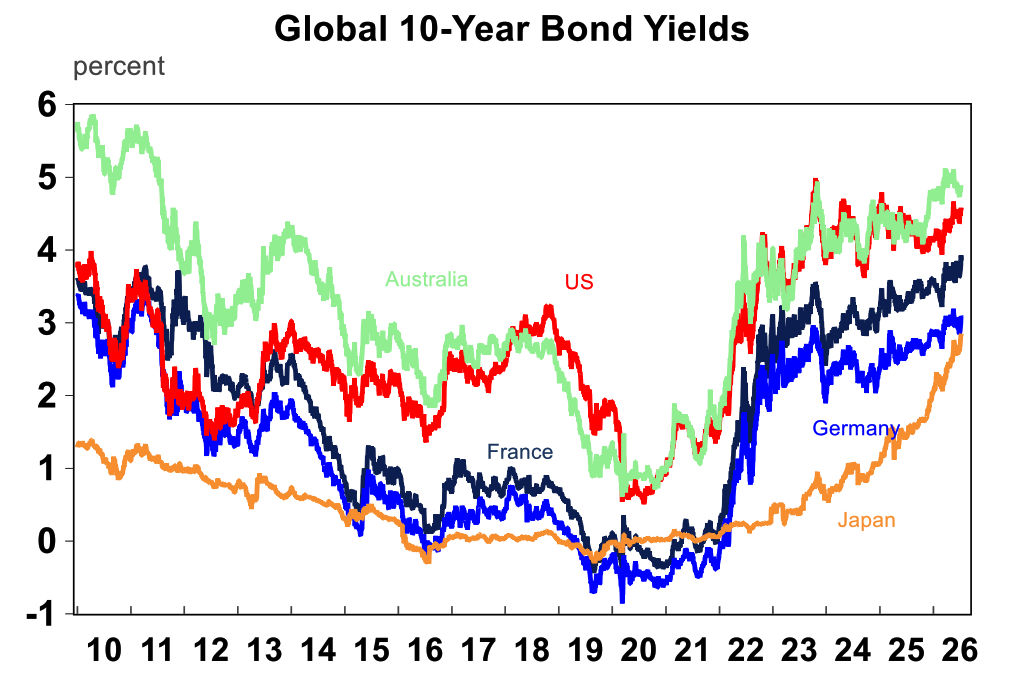
Bond yields rose further on the back of inflation concerns before retracting slightly towards the end of the week. US 10-year Treasury yields surged to above 4.56% again and Aussie 10 year increased to 4.84% (though both are not as high as back in May), and the Australian dollar is also up slightly to 0.69.
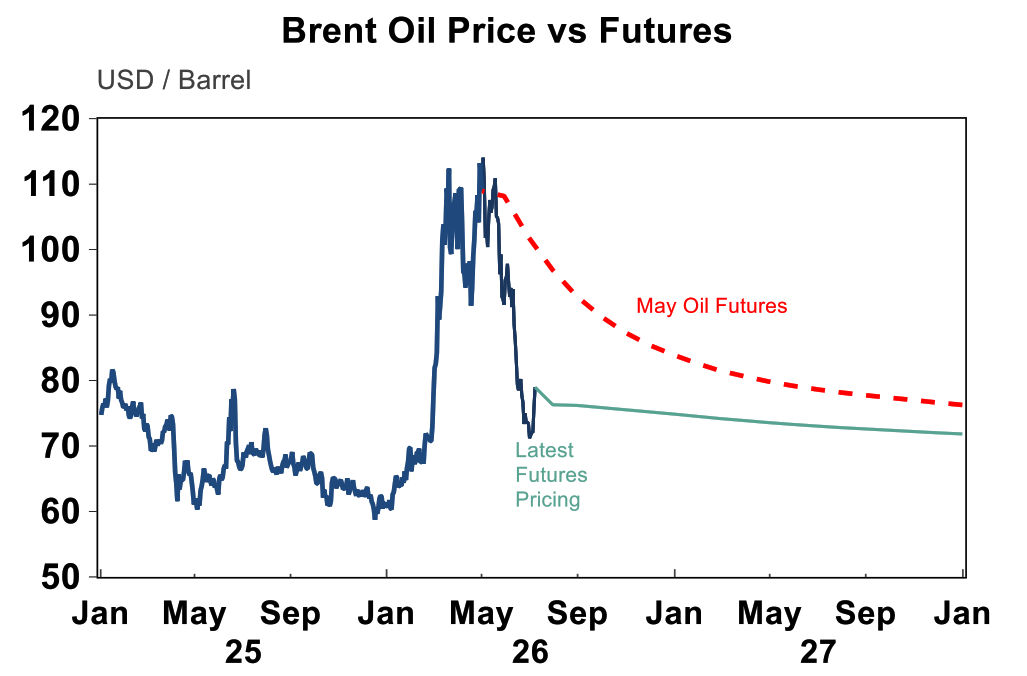
With war escalation, oil prices have risen further, from around US$72/bbl last week to as high as US$78 mid-week, before easing back to around US$76 and the futures curve is still in slight backwardation. This suggests markets see greater supply risk than before, but not a severe shortage, and conditions are still expected to improve over time.
Indeed, traffic across the Hormuz strait has been rather volatile, but still averaged at 20% of pre-war levels in the past three days (even with ongoing strikes). 20% can seem quite low, but remember that over the past few months, there has been diversion of oil to other pipelines, more supply from outside of the Middle East (e.g. from the US with record high crude exports in April and May), as well as consumers pulling back demand for fuel (e.g. Aussies are buying more EVs than ever including one purchase this week from the AMP Economics team).
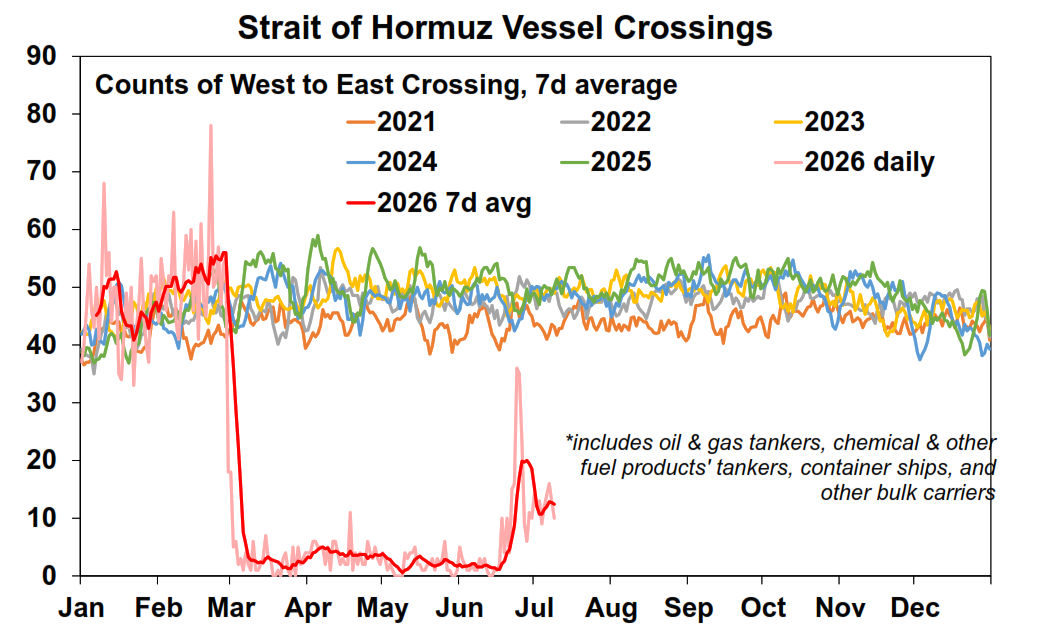
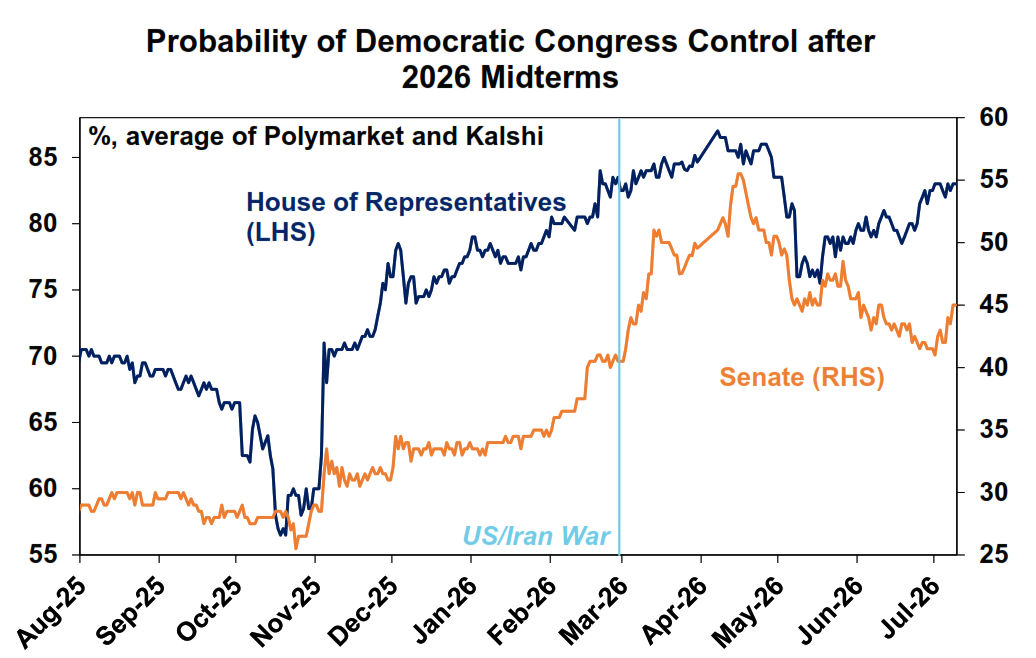
If the trend does not tick back up as indicated by US officials, then supply risks remain a concern, especially as reserves have been drawn down somewhat. But for now, markets appear to be taking a “she’ll be right” view and assuming oil can trade rangebound between US$70-90/bbl. No one was too surprised at the renewed flare-up in US-Iran tensions, given the fragility of the “peace deal”, which lacked an enforcement mechanism and did not resolve the nuclear issue. Bloomberg editor John Authers even called the MOU a “Memorandum of Misunderstanding”! We think fighting could continue over the coming months, keeping oil prices a little above pre-war level. Prices are unlikely to fall much below US$70/bbl because US consumers can certainly live with oil around that level and so Trump has little reason to pull back. Therefore, Iran also wants to preserve a floor price, both to strengthen its negotiating position and retain its leverage on Hormuz traffic. But prices are also unlikely to push too far above US$90/bbl, as higher fuel prices would create political pressure for the Republicans, likely prompting another Trump’s pullback as we saw in May.
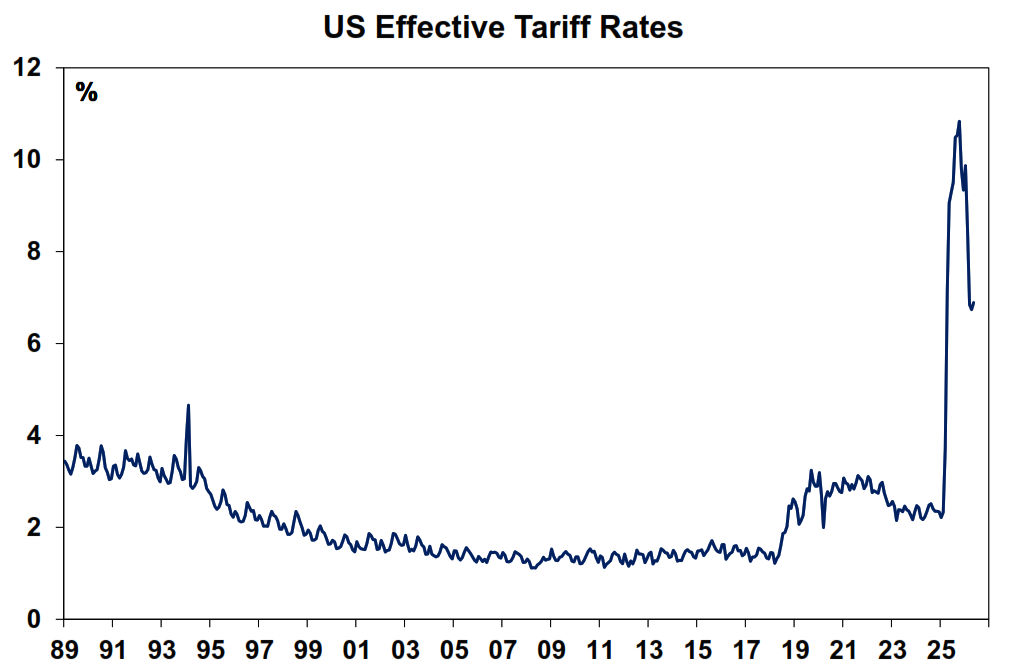
The Iran war is no different from the tariff saga of 2025! After the “maximum pressure” strategy at the beginning, tariff rates have gone down from the peak, as the US pulled back on threats and even exempted a wide range of consumer goods from tariffs (including beef, bananas, coffee, or orange juice). Expect tariff news to make noise again in the coming days, with Section 122 (aka the replacement measure put in place after the Supreme Court struck down broad-based reciprocal tariffs) due to expire in two weeks, while the USMCA agreement with Canada and Mexico is now subject to annual reviews and negotiations. But if you’re not an economist, you certainly don’t need to bore yourself with all the little details and just need to know that the effective tariff rates will probably range between the current level of 6.7% and 10%, which the strong US economy can still sustain.
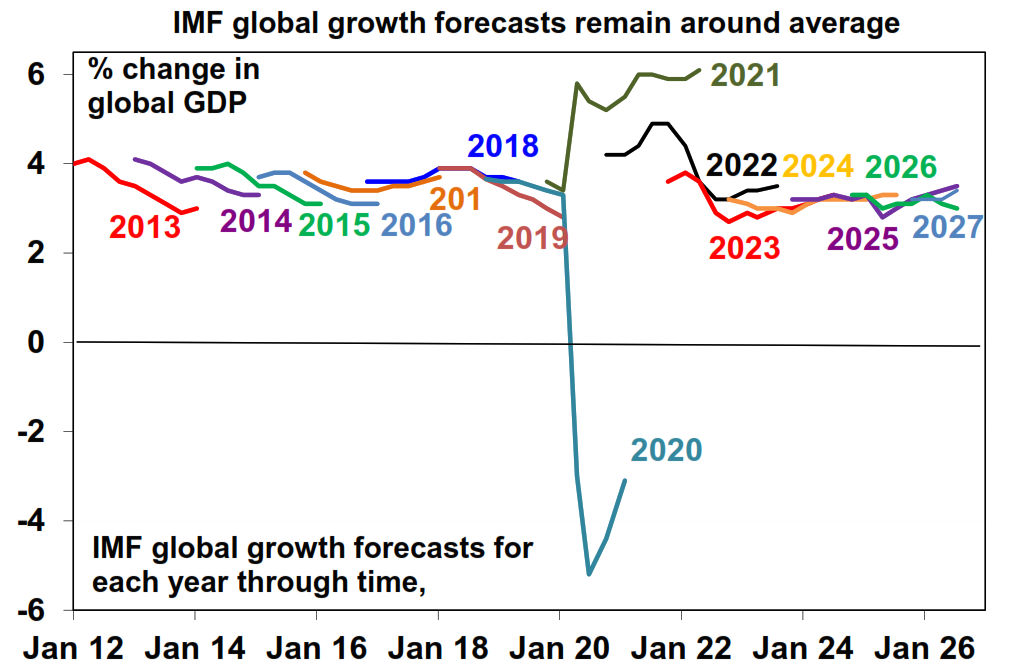
Similarly, the IMF projected that global growth would remain okay at around 3% for 2026 and even stronger at 3.4% in 2027, as downside risks have partially been offset by AI-driven demand. The global economy has weathered the shock better than feared but much of the positive surprise was concentrated in countries that add value in the technology supply chain (especially East Asian countries including Taiwan, Korea, China and Japan).
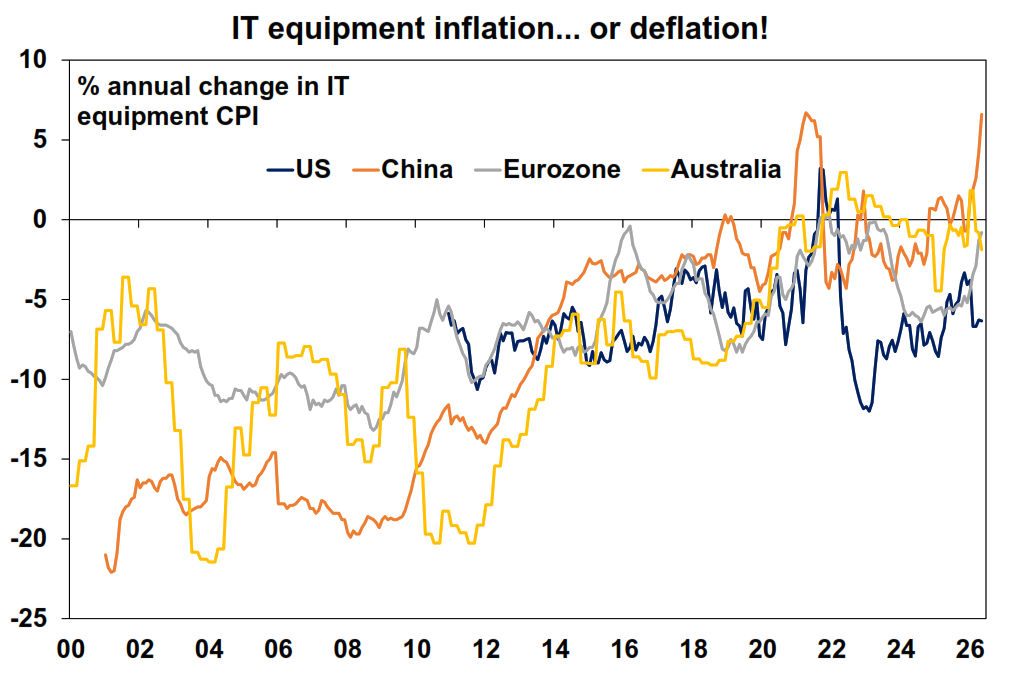
So, if war and tariffs are not the main market worries, what is? These days, it seems to be concern that AI investment is adding to inflation pressure, a sentiment echoed by Fed officials in the latest FOMC meeting minutes. Indeed, the rapid build out of AI infrastructure is driving a lot of investment in data centres, semiconductors, and electricity networks, which could create some short-term supply bottlenecks and push up prices of materials and labour. There have already been reports of multiple companies raising chip prices, evident in Chinese inflation data this week. At the same time, strong aggregate demand in the economy coming from private business investments means that there is no hurry to cut rates next year (even if there are other sectors in the economy that don’t do as well), so markets are right to be worried. However, this demand only becomes a lasting inflation problem if productivity fails to keep pace. Over time, productivity gains should help absorb higher costs; without them, consumers and businesses will have little reason to keep paying more for AI tokens, and prices are likely to adjust back down. In addition, IT equipment makes up a small part of the CPI basket (2% in Australia), and after adjusting for quality improvements, it has been in deflation for the past two decades. So near-term hardware price rises may simply mark a normalisation of that long-running trend.
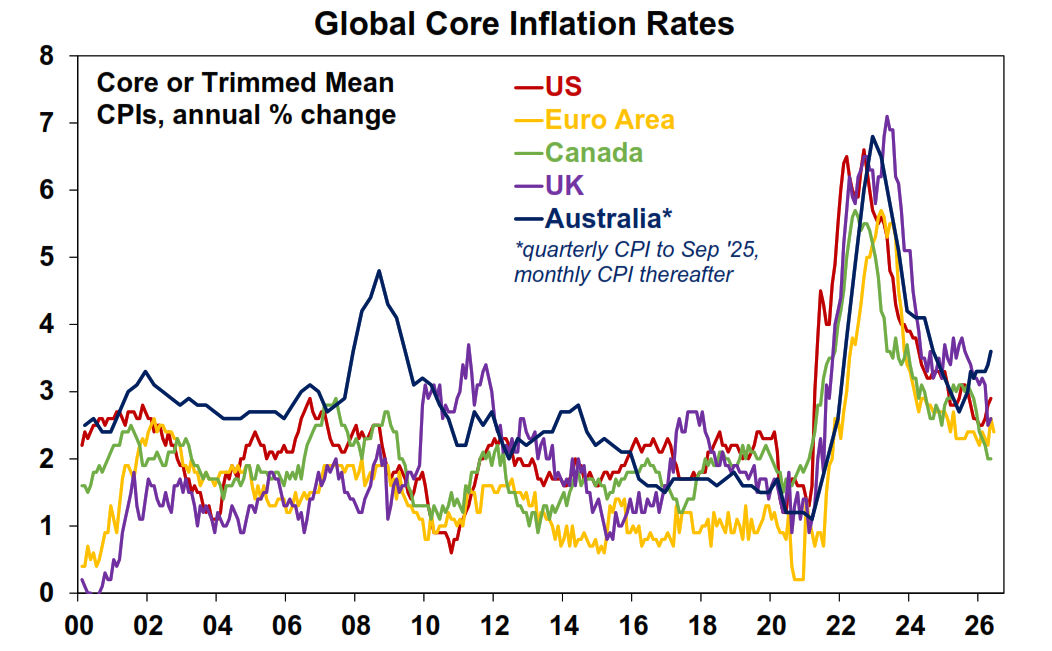
Of course, global inflation concerns go beyond the AI story. The IMF expects inflation to tick up from here as commodity prices remain elevated, with most major economies unlikely to return to target until next year. RBA Chief Economist Sarah Hunter also noted this week that geopolitical and supply shocks make central banks’ jobs harder, as they can push up consumers’ backward-looking inflation expectations. That means central banks may need to stay more aggressive to bring expectations back down. Australia certainly stands out with much higher core inflation rates than peers and the upward momentum does not look good either!
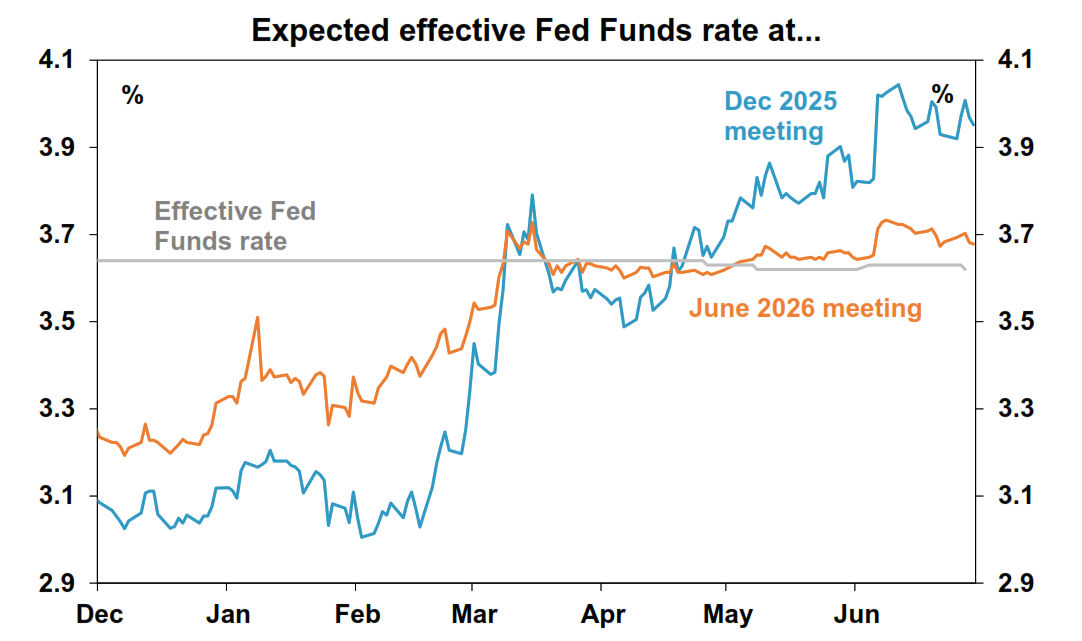
The minutes from Kevin Warsh’s first FOMC meeting as chair also noted some upside risks to US inflation from lingering tariff impacts. However, the effect of Hormuz-related disruptions is expected to fade by year-end, the housing market is still slowing, and the labour market remains stable rather than inflationary. So there is no hurry for the Fed to hike in July just yet. Positively, Warsh also announced five task forces to review the Fed’s approach to communications, balance sheet policy, data integrity, productivity and inflation frameworks, while most FOMC members saw “advantages in shortening the statement”. Great news for all of us now that there’s less to read! While some market participants are worried that Warsh is moving away from forward guidance, we don’t think this will stop other board members from expressing their own views. Fewer words also does not necessarily mean less clarity on how the Board interpret past data! And future policy moves should depend on upcoming data anyway, not guidance within the post-meeting statement or minutes.
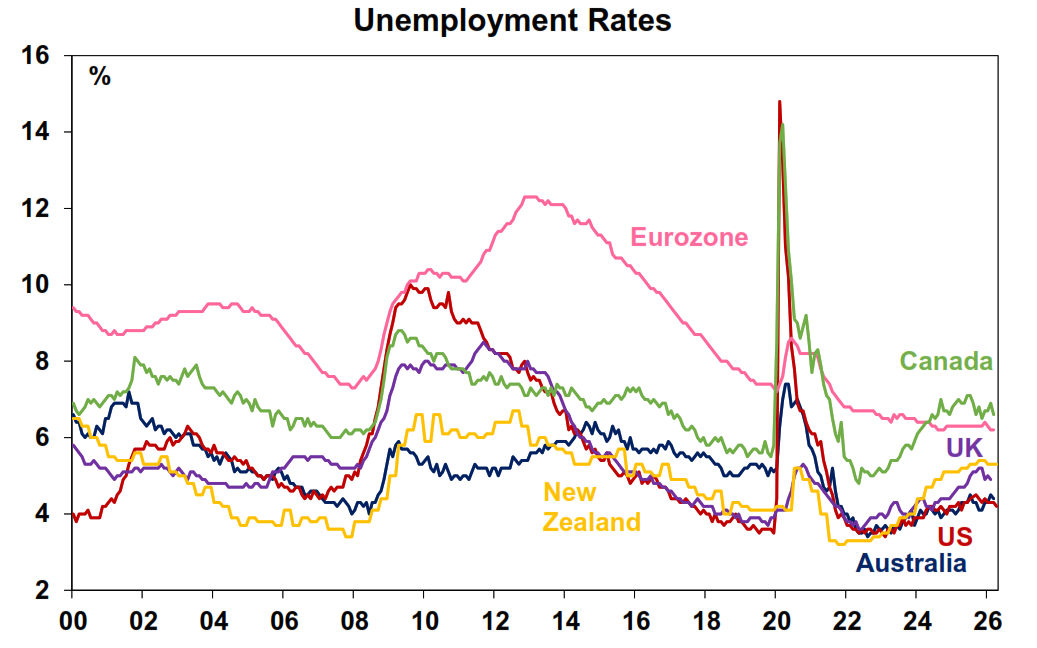
Australia’s labour market has held up better than most, but our real wages performance remains among the weakest in the developed world. The latest OECD labour market report showed unemployment is still low across most economies, but has edged up from a year ago, with some sectors facing more persistent labour shortages due to population ageing, the energy transition and digital transformation. Australia stands out in three ways: first, headline labour market outcomes remain stronger than the OECD average, with employment and participation near record highs and the unemployment rate at 4.4%, below the OECD average of 4.9%. Secondly, our younger graduates have fared relatively well, with much smaller gap between youth unemployment rates versus the rest of the population, unlike in the EU and Canada (interestingly, the OECD found that so far youth unemployment has not yet been driven by AI). Thirdly (and sadly), real wages growth in Australia is “one of the steepest declines” among peers since Q1 2021, and real wages are near the lowest point since the pandemic “only in New Zealand and Australia”.
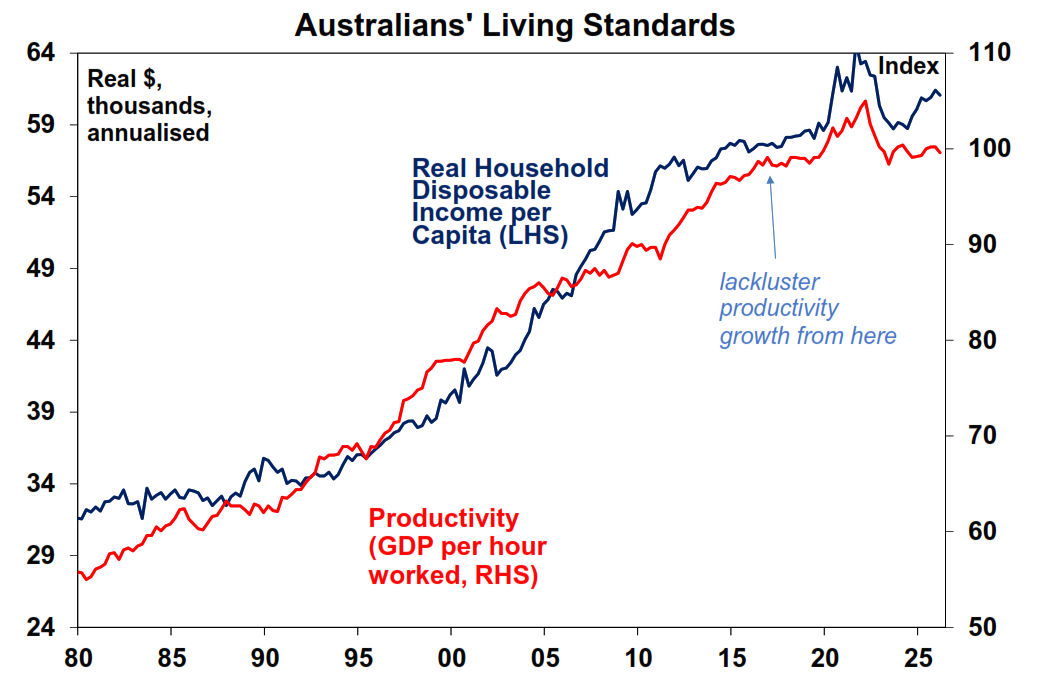
The driver of this is not new. Productivity in Australia has stalled for a whole decade and we are just now paying the price – through eroding purchasing power of wages income.
Major global economic events and implications
June US ISM surveys were good news, with both manufacturing and services holding steady. The services composite index and new orders eased slightly but remained in expansionary territory. Meanwhile employment improved to 51.2 from 47.9 last month, returning to expansion and aligning with other signs of labour market stabilisation. Price pressures also cooled, suggesting the peak inflation scare has passed.
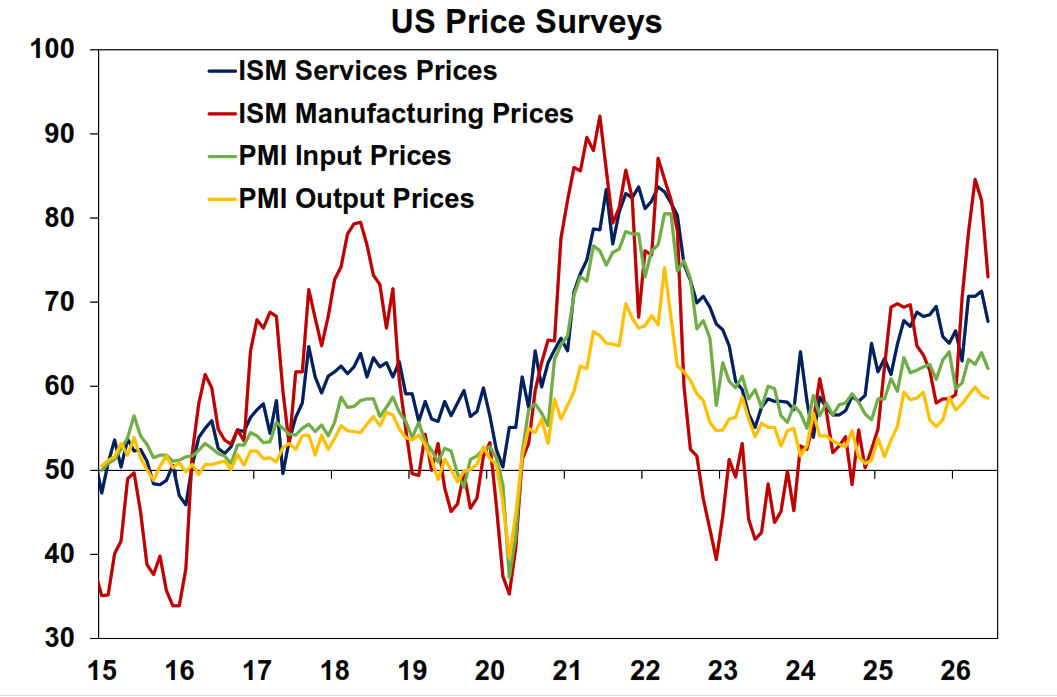
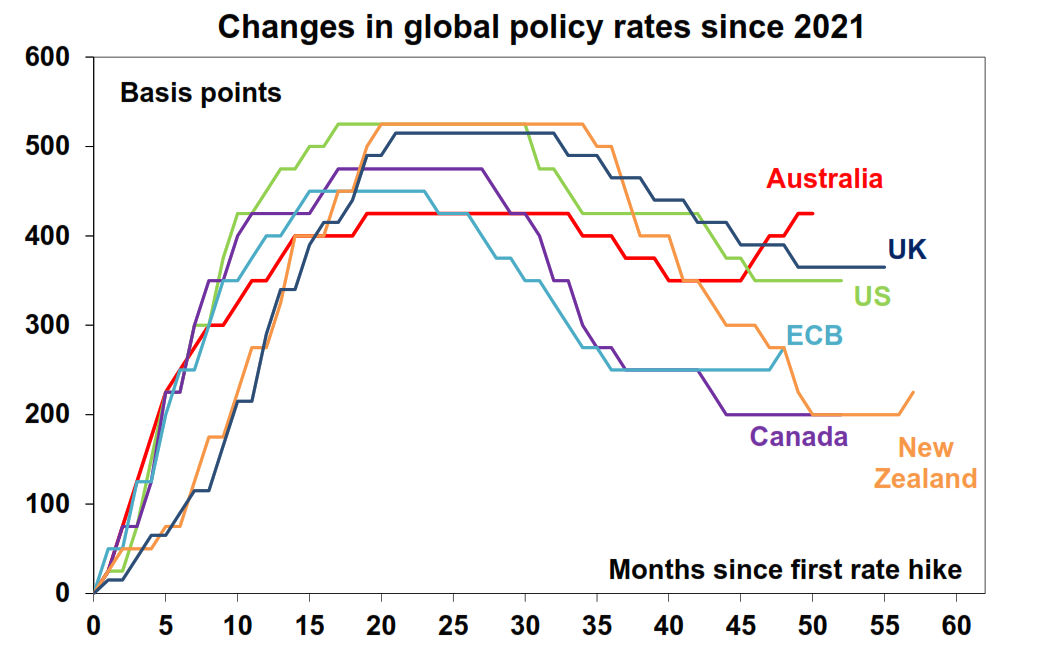
The Reserve Bank of New Zealand raised interest rate for the first time this year to 2.5% from 2.25%, as expected. The hike reflected elevated inflation expectations, stronger-than-feared economic growth (evident by the highest manufacturing PMI in five years, and the risk that higher input costs have yet to fully pass through to consumers). Lower fuel prices are also expected to support a recovery in consumer and business spending. Basically, the risks for inflation tilt towards the upside, while the cash rate after today’s increase is still accommodative based on the Bank’s own assessment (the long-term neutral is around 3%). There are likely more hikes to come – similar to expectations for other central banks across the globe (but Australia is indeed an outlier with earlier and more hikes than anyone else!)
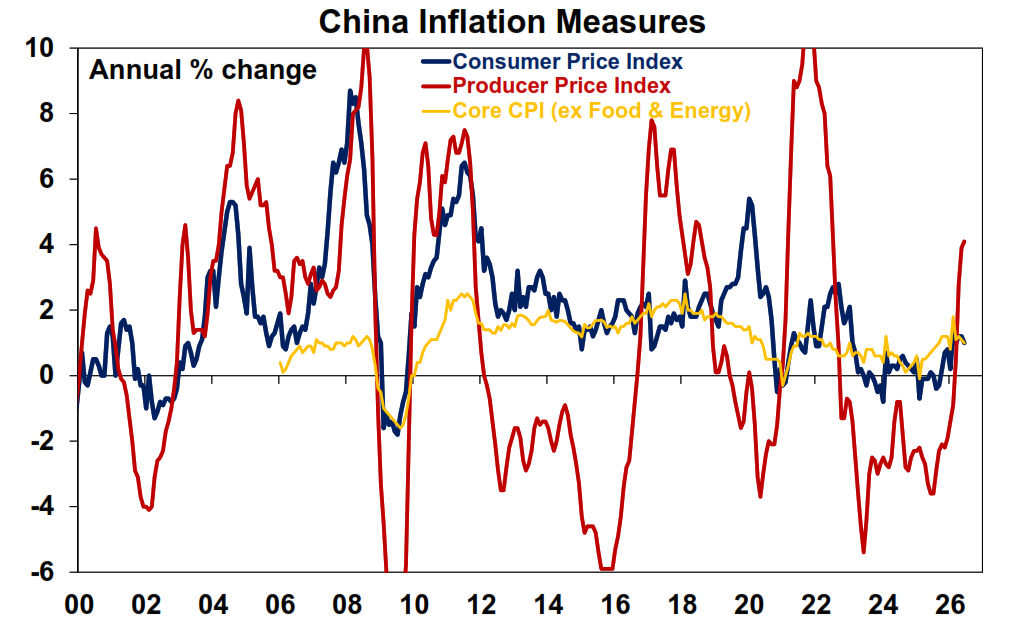
Chinese inflation data seems to be rolling over with consumer inflation readings rising by just 1% over the year (down from 1.2% last month). Meanwhile, factory prices declined 0.3% over May despite posting a solid 4.1% annual growth. The fall in crude oil has translated into softer price growth in various sectors, including food, tobacco, home appliances, and miscellaneous items (most likely driven by lower gold prices), reflecting a softer domestic consumer backdrop. The outlier was communications equipment & smartphones, which accelerated to 7.6% as chips prices increased.
Australian economic events and implications
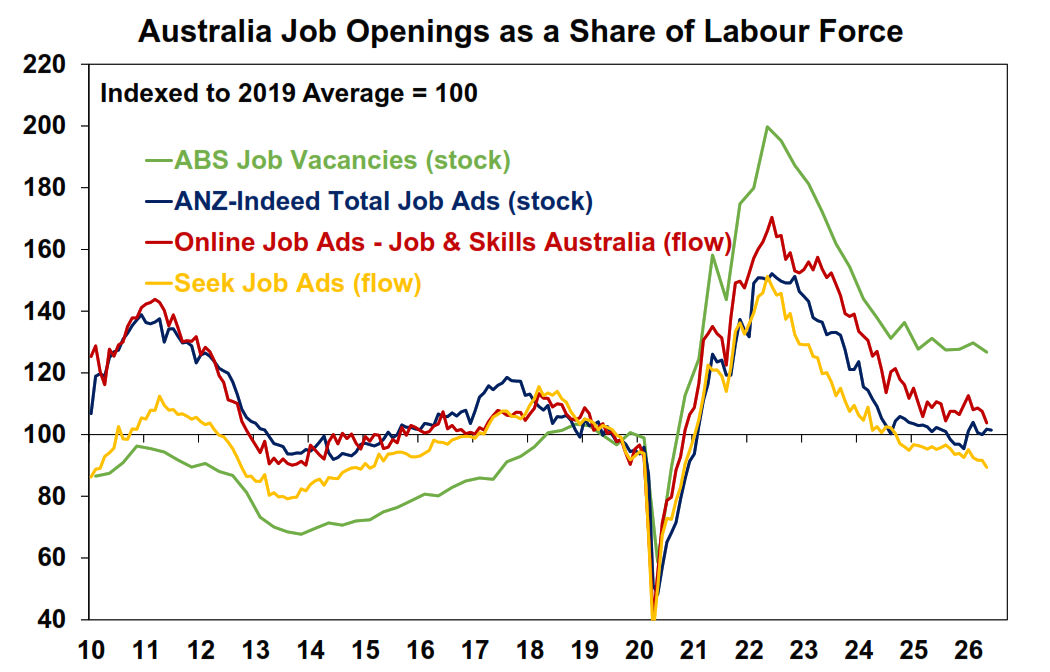
ANZ-Indeed job advertisements fell by 0.2% in June but are still up by 0.5% over the year – essentially flat. Together with other high-frequency indicators, they show some very early signs of softening in the labour market, but from very healthy levels and there’s no need to worry just yet.
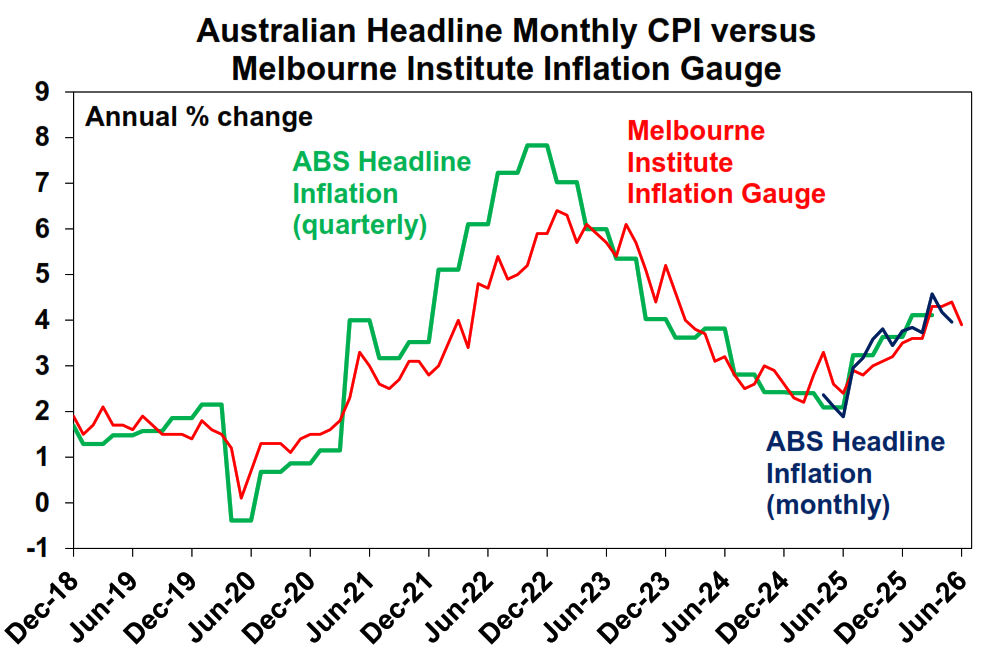
The Melbourne Institute June Inflation Gauge fell by 0.4% over June, translating into an annual rise of just 3.9% (down from 4.4%) which is great news for inflation. The trimmed mean figure also fell sharply to 2% (though trimmed mean level has been consistently below the official ABS figure). The fall was mainly driven by lower fuel prices over the last month. Overall, the gauge underscores that we’re past the peak of inflation in Australia thanks to lower energy costs. But we’re certainly not out of the woods of sticky inflation yet.
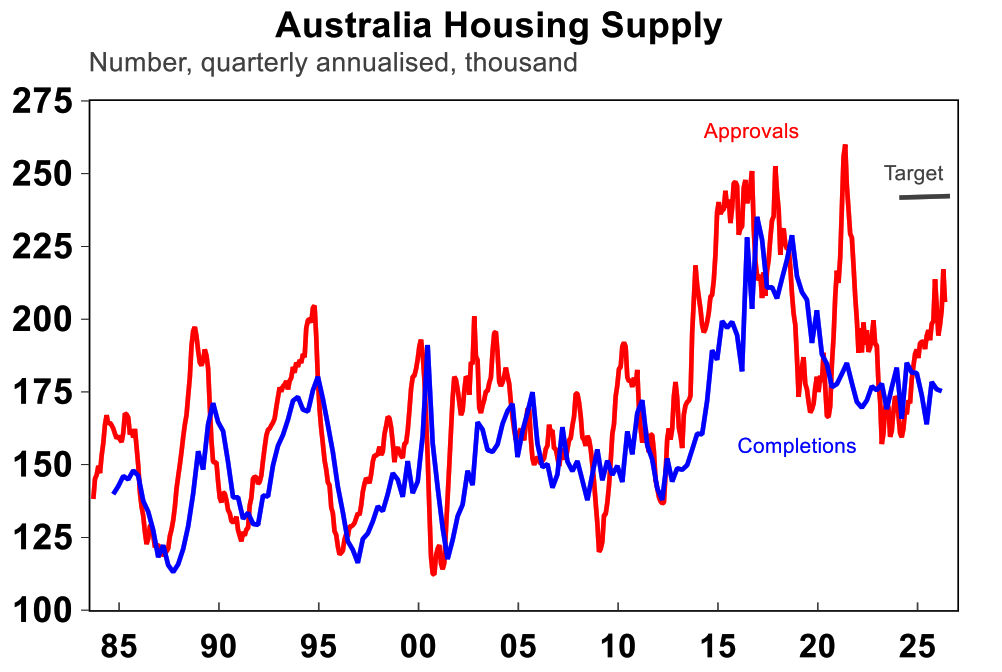
Building completions data for the March quarter showed that we are so far 112,000 dwelling units behind the optimistic target set by the National Housing Accord back in mid-2024, and the gap will continue to widen in the next year. Dwelling completions remain at a stagnant pace of around 175 thousand units per annum, while the target requires at least 240k pa (which is also the level that can both match demand from population growth and solve some of the structural supply issues). With accelerating construction inflation at the same time home prices are falling, abandonment rates may rise and both residential building approvals and completions are likely to decline. So, while we continue to see further home price declines through to next year, they will likely start to bounce back towards the second half of 2027 given the structural undersupply.
What to watch over the week ahead?
US inflation data is out Tuesday and will be closely watched for any signs of inflation pressures building in the core measure. Headline CPI is expected to decline 0.1% over the month thanks to better commodity prices, but core reading is likely firmer at 0.2%mom or 2.8% over the year. Retail sales on Thursday will likely show consumer spending continuing to pick up on a nominal basis (+0.3%mom), and a suite of high frequency housing indicators (housing starts & permit) together with UMich consumer sentiment will be consistent with an economy that’s neither overheating nor underperforming.
In Australia, expect some minor improvement in the Westpac-Melbourne Institute consumer sentiment reading thanks to benign fuel prices, but sentiment levels will continue to remain depressed with the house price downturn and still sticky inflation. The NAB Business confidence should bounce back from low levels as well and hopefully price surveys can tick down. The July consumer inflation expectation is out on Thursday and is also likely to go down slightly, albeit from elevated levels.
China’s June GDP and monthly activity data is out on Wednesday. Expect growth to soften further to 4.5%yoy (from 5%yoy) as consumer spending slowed, despite exports remaining solid.
Outlook for investment markets
Global and Australian share markets are likely to remain volatile with the risk of another correction given uncertainty about the peace deal with Iran, still stretched valuations, sticky inflation, political uncertainty associated with Trump & the midterm elections and worries about the impact of AI and whether there is an AI bubble. However, returns should still be positive for the next 12 months as a whole thanks to Trump still likely to pivot to consumer-friendly policies ahead of the mid-terms, continuing economic growth with recession avoided and solid profit growth.
Bonds are likely to see returns around running yield.
Unlisted commercial property returns are likely to be solid helped by strong demand for industrial property associated with data centres.
Australian home prices are expected to fall around 2% this year and by 6% over the next 12 months as a result of poor affordability, RBA rate hikes, reduced investor demand flowing from the winding back of negative gearing and the capital gains tax discount and poor confidence. This will mean roughly a 7% top to bottom fall.
Cash and bank deposits are expected to provide returns around 4-5%.
The $A is likely to rise reflecting the wider interest rate differential to the US, although a move to Fed hikes may limit this. Fair value for the $A is around $US0.72.
My Bui,
Economist, AMP


You may also like
-

Weekly Market Update - 16-10-2026 - AMP Weekly Market Update: AI credit fears hit shares, Investors flocking to safe haven (because of CoreWeave?), Oil still high but global growth still resilient, and Weak jobs data gives RBA room to pause. -

6 New Year resolutions that could improve your finances Six simple financial tips that could help you save more, spend smarter and feel more in control of your finances in the new year. -

Weekly Market Update - 09-10-2026 - AMP Weekly Market Update: US shares near record highs but risks are bubbling, tech rally remains narrow, credit markets turn wary on AI & Firmus IPO shelved, French bond yields surge, and another immigration debate.
Important information
Any advice and information is provided by AWM Services Pty Ltd ABN 15 139 353 496, AFSL No. 366121 (AWM Services) and is general in nature. It hasn’t taken your financial or personal circumstances into account. Taxation issues are complex. You should seek professional advice before deciding to act on any information in this article.
It’s important to consider your particular circumstances and read the relevant Product Disclosure Statement, Target Market Determination or Terms and Conditions, available from AMP at amp.com.au, or by calling 131 267, before deciding what’s right for you. The super coaching session is a super health check and is provided by AWM Services and is general advice only. It does not consider your personal circumstances.
You can read our Financial Services Guide online for information about our services, including the fees and other benefits that AMP companies and their representatives may receive in relation to products and services provided to you. You can also ask us for a hardcopy. All information on this website is subject to change without notice. AWM Services is part of the AMP group.