


Weekly market update
Investment markets and key developments
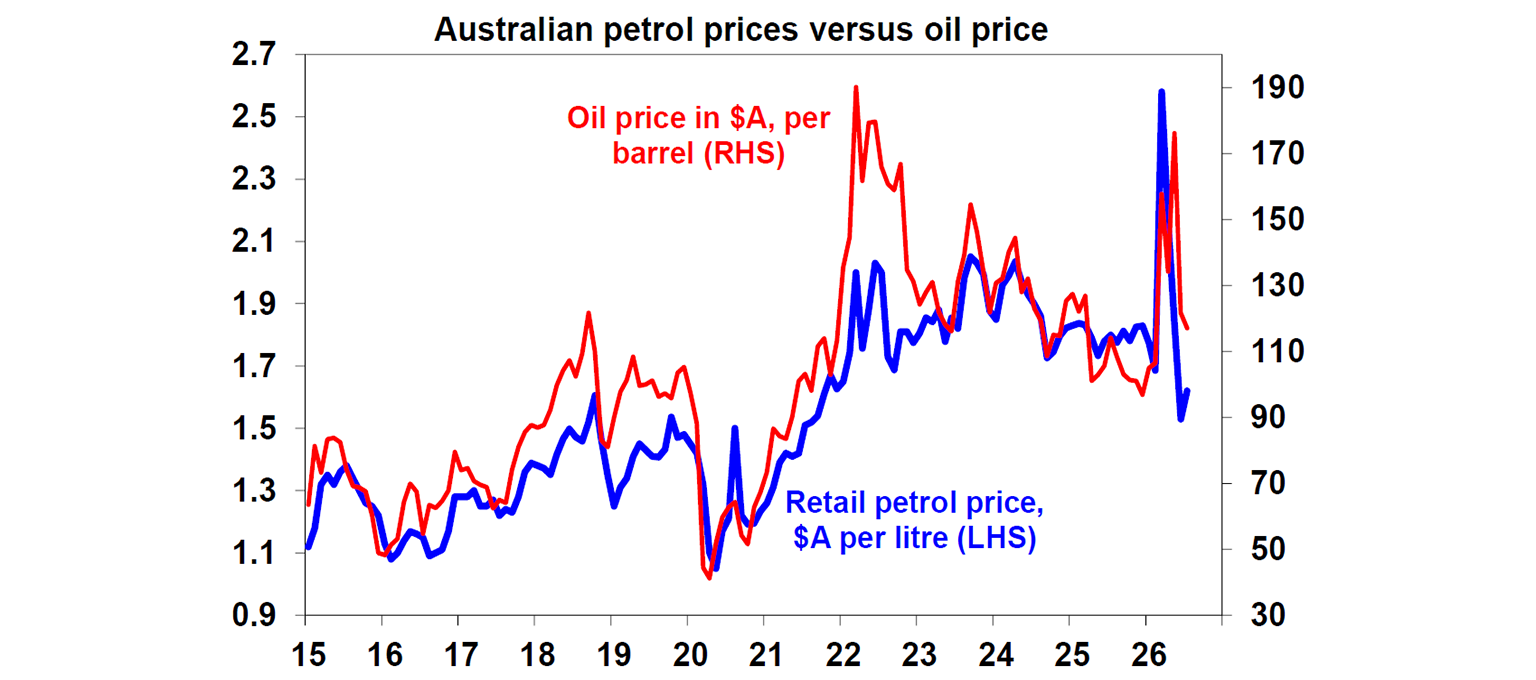
In Australia, the halving of the 32 cents a litre fuel tax cut from 1 July saw average capital city petrol prices rise but only from around $1.53/litre to around $1.62 leaving them still well below where they were before the War started.
9 min read

Global shares mostly saw strong gains over the last week as the oil price remained down, inflation fears subsided and slower US payrolls removed some pressure for a US rate hike. For the week US shares rose 1.8%, Eurozone shares rose 2.7% to a record high & Japanese shares rose 0.6% but Chinese shares fell 0.5%. The positive global lead along with with a rebound in health care stocks saw Australian shares rise 0.9%.
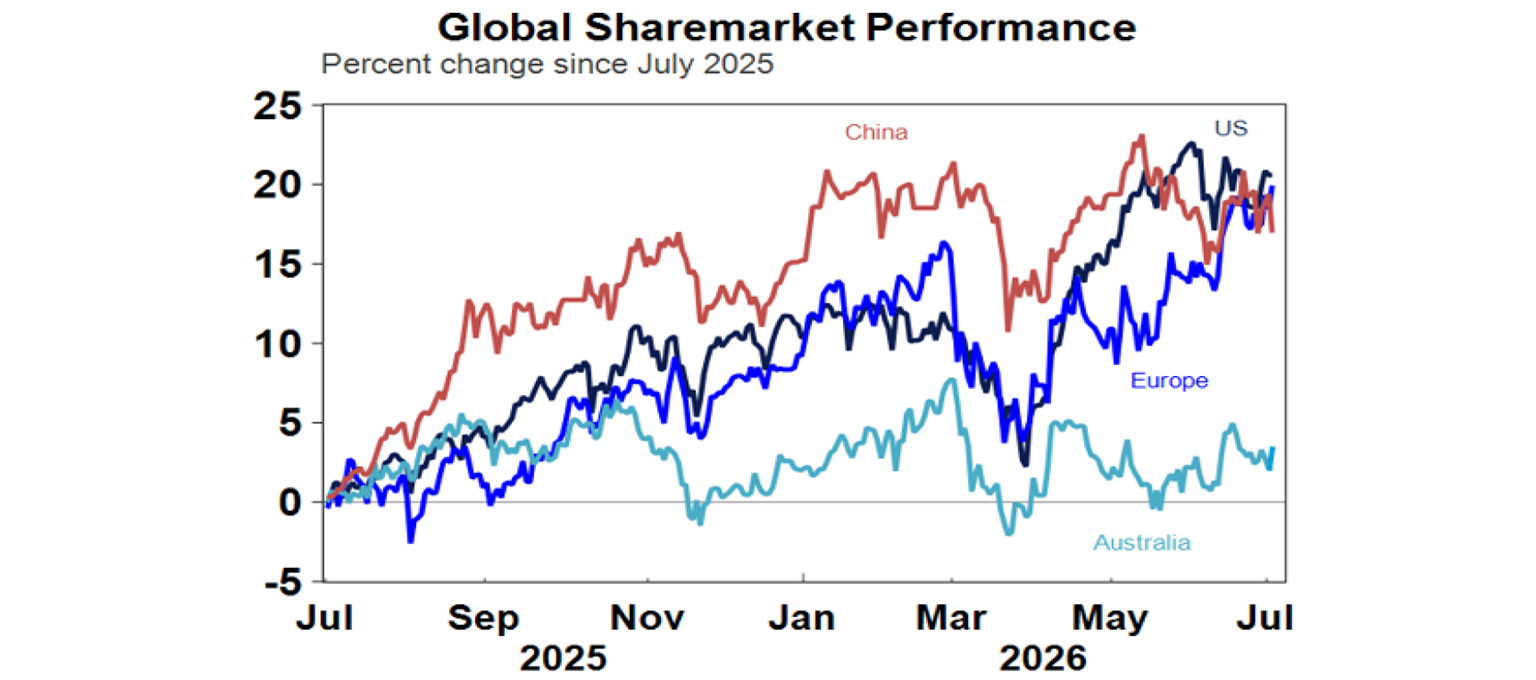
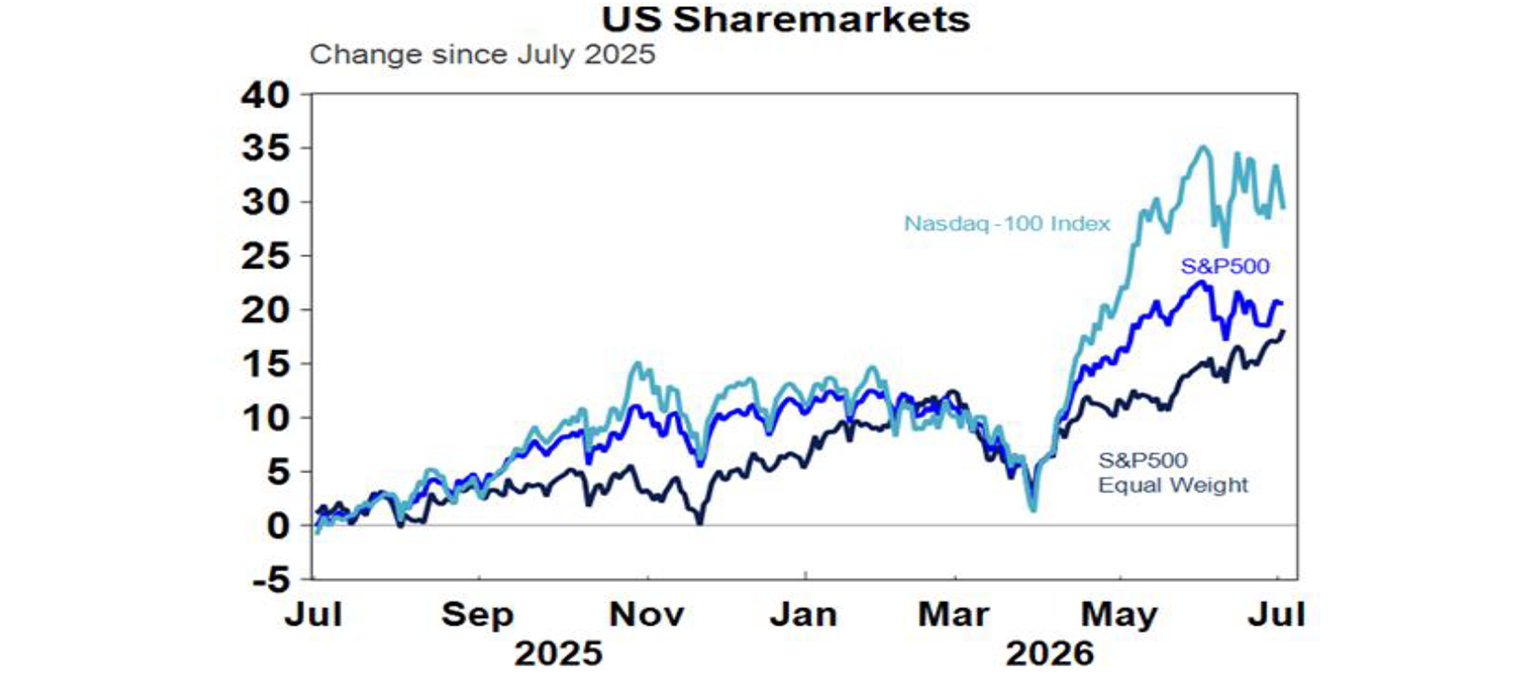
Another rotation in US shares. While the US share market remains below its recent record high this partly reflects another healthy rotation from tech to non-tech shares with the equal weighted S&P 500 reaching new highs.
Despite reduced inflation fears, bond yields actually rose slightly in the last week. Prices for metals and iron ore fell but gold and Bitcoin rose as the $US fell which also helped the $A get rise above $US0.69. So far Bitcoin appears to be holding technical support around $US60,000 following a roughly 53% fall from its October high. If it’s able to bottom here it may be seen as very positive potentially breaking out of the four year cycle of 80% falls as it matures.
Despite a rocky ride the interim US/Iran peace deal appears to be holding together with the flow of ships through the Strait of Hormuz remaining up from lows through the March-June period, despite a setback a week ago as the conflict appeared to be briefly flaring up again.
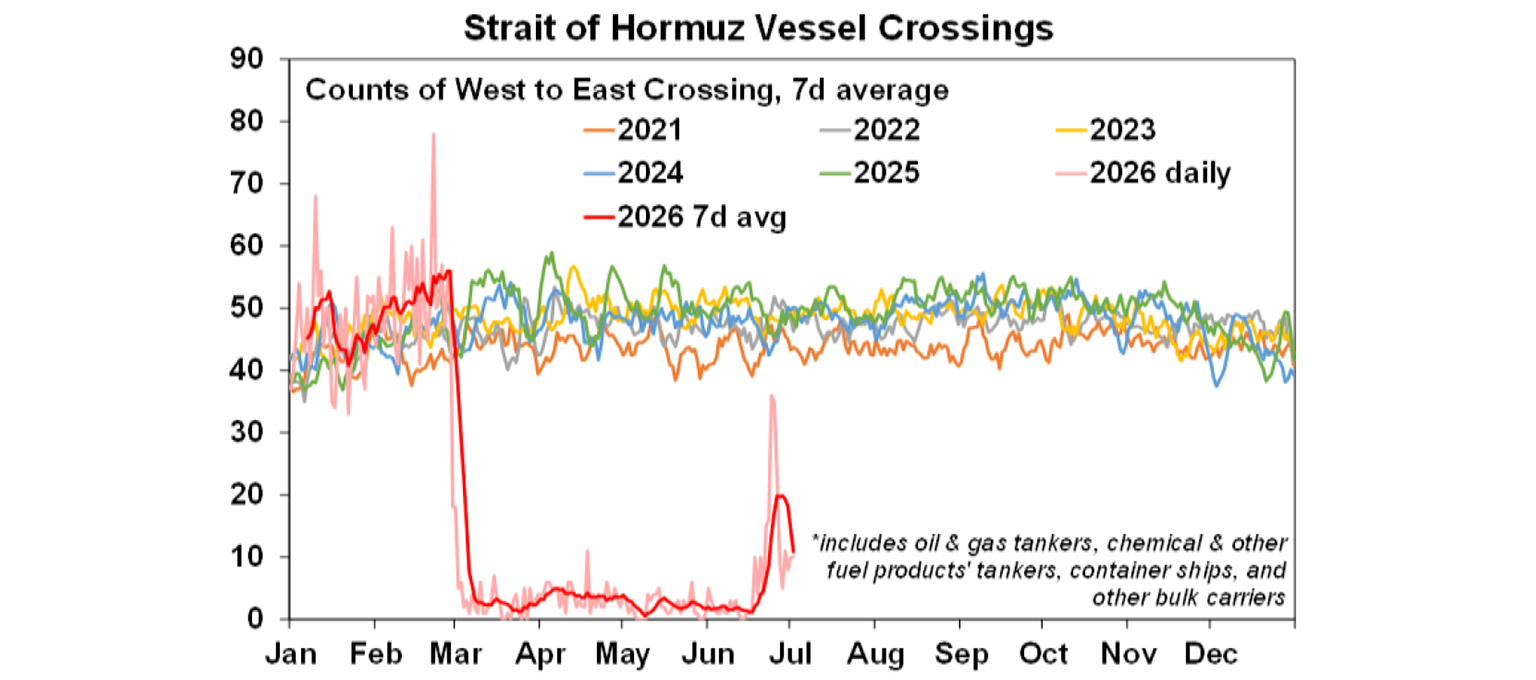
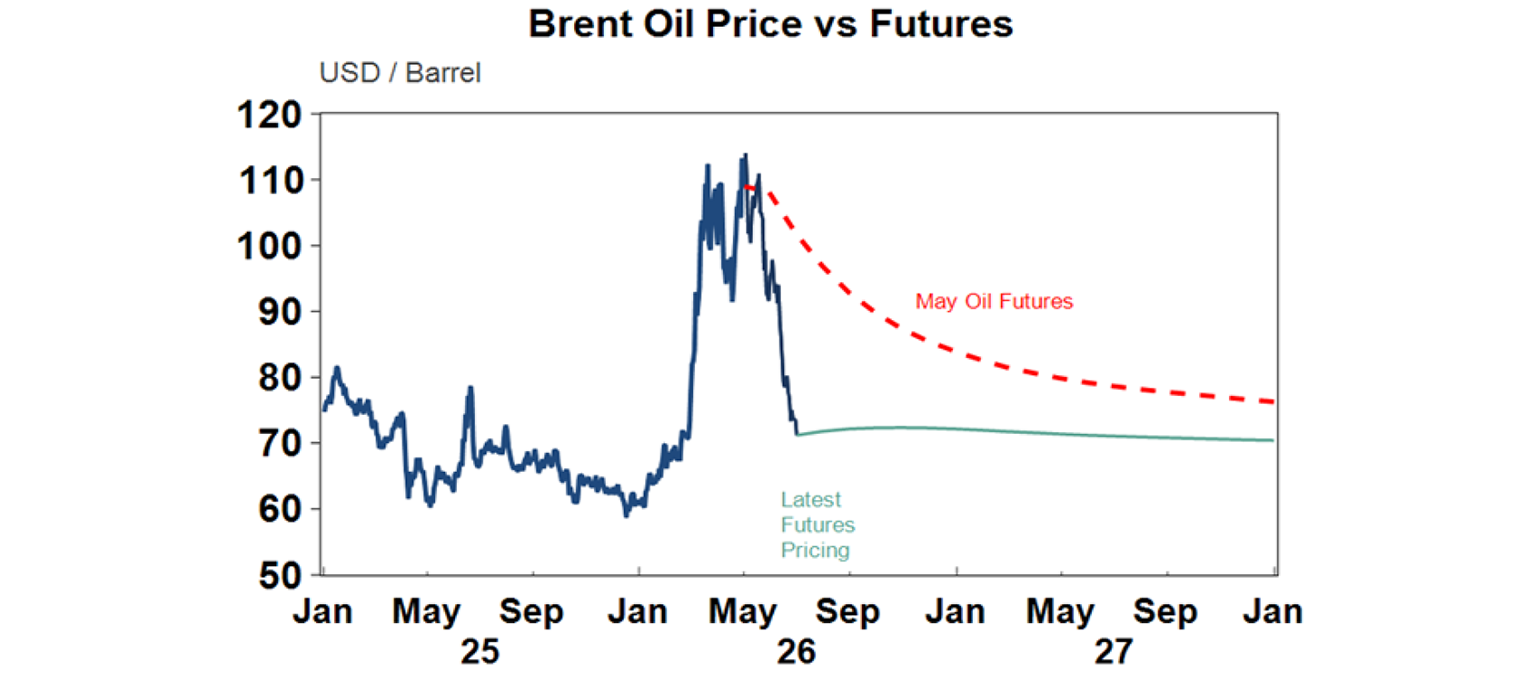
This in turn has seen oil prices fall to slightly above where they were before the War. However, scope for a further fall in the near term may be limited with the risk of some rise as the flow of ships through the Strait remains depressed and the peace deal still looks fragile with difficult to resolve issues around Iran’s desire to control the Strait, its nuclear program and the Israel/Hezbollah conflict all posing a threat with the risk it could all flare up again.
In Australia, the halving of the 32 cents a litre fuel tax cut from 1 July saw average capital city petrol prices rise but only from around $1.53/litre to around $1.62 leaving them still well below where they were before the War started.
The last financial year saw another year of solid returns despite a long worry list including last year’s US tariffs and this year’s US war with Iran – but can it continue? Sure Australian shares lagged with just a 6.1% return but that was still above inflation and most bank account rates. But global shares returned around 23% in local currency terms with Japanese and emerging market shares being the star performers. Can it continue? Our assessment is that shares will continue to provide reasonable returns over the year ahead, albeit with significant bouts of volatility. The combination of sticky inflation, an upwards drift in central bank interest rates, worries about an AI bubble, huge US IPOs, political uncertainty around the US mid-terms and high risks around the Iran peace deal are likely to continue to result in a volatile ride with a high risk of yet another correction. But the absence of a recession, solid profit growth, Trump likely to pivot to more consumer-friendly policies ahead of the mid-terms and the Fed and RBA likely to cut rates next year should result in okay overall returns.
The past week saw mixed messages regarding the outlook for global interest rates.
In the US new Fed Chair Warsh noted that inflation risks have come down suggesting no urgency to hike in July - not that he’s providing any guidance. A new complication though is that surging tech costs flowing from the AI boom may add to inflation – with Apple and Microsoft raising prices in the past week on the back of higher memory costs. Our assessment is that a Fed hike may still be required this year, but probably only one. Meanwhile a Supreme Court decision allowing Fed Governor Cook to stay in office while she defends a case against her is good news in terms of heading off Trump’s threat to Fed independence but for now its academic as even Trump appointees have backed away from rate cuts lately. That said, Trump and his allies are reportedly still looking at ways to get greater control of the Fed.
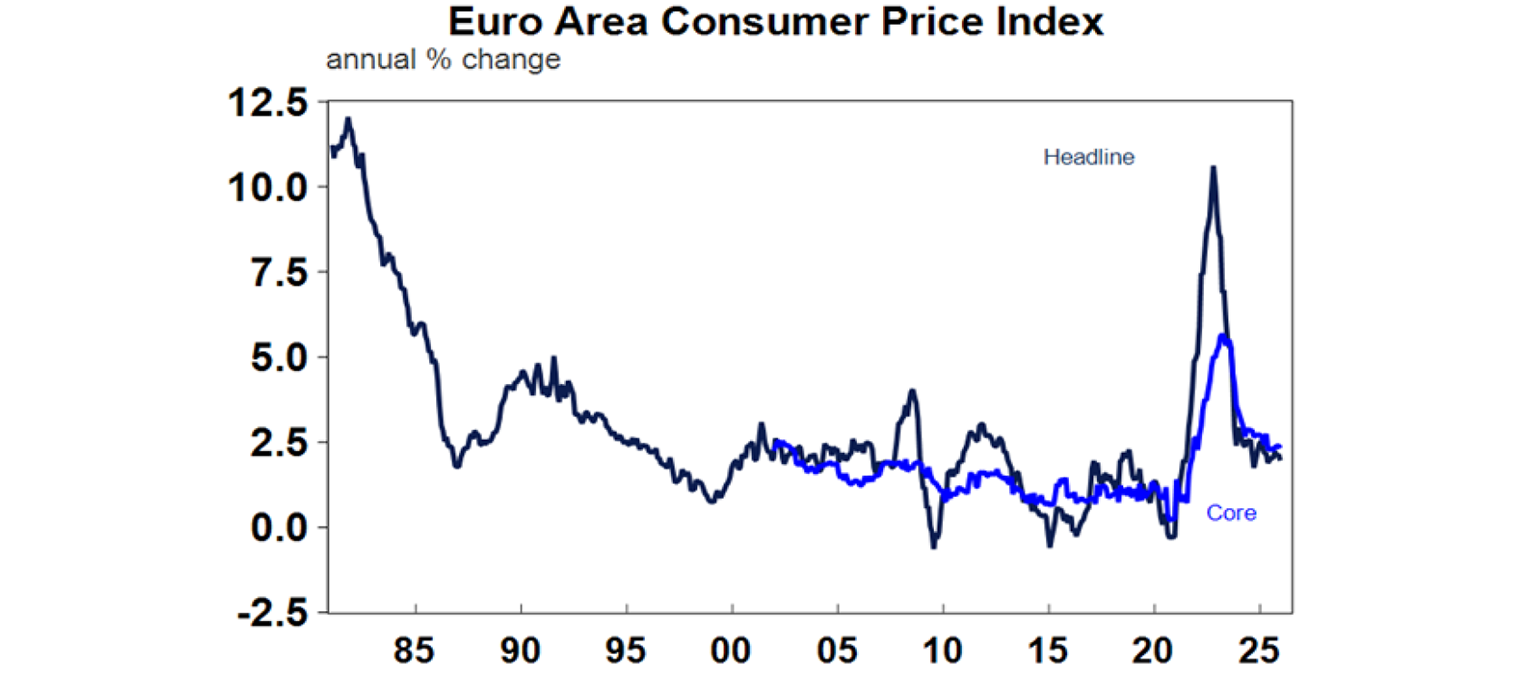
An AI related boost could also be a threat to Eurozone inflation, but its core inflation rate fell to 2.4%yoy in June reducing pressure on the ECB for a hike in July.
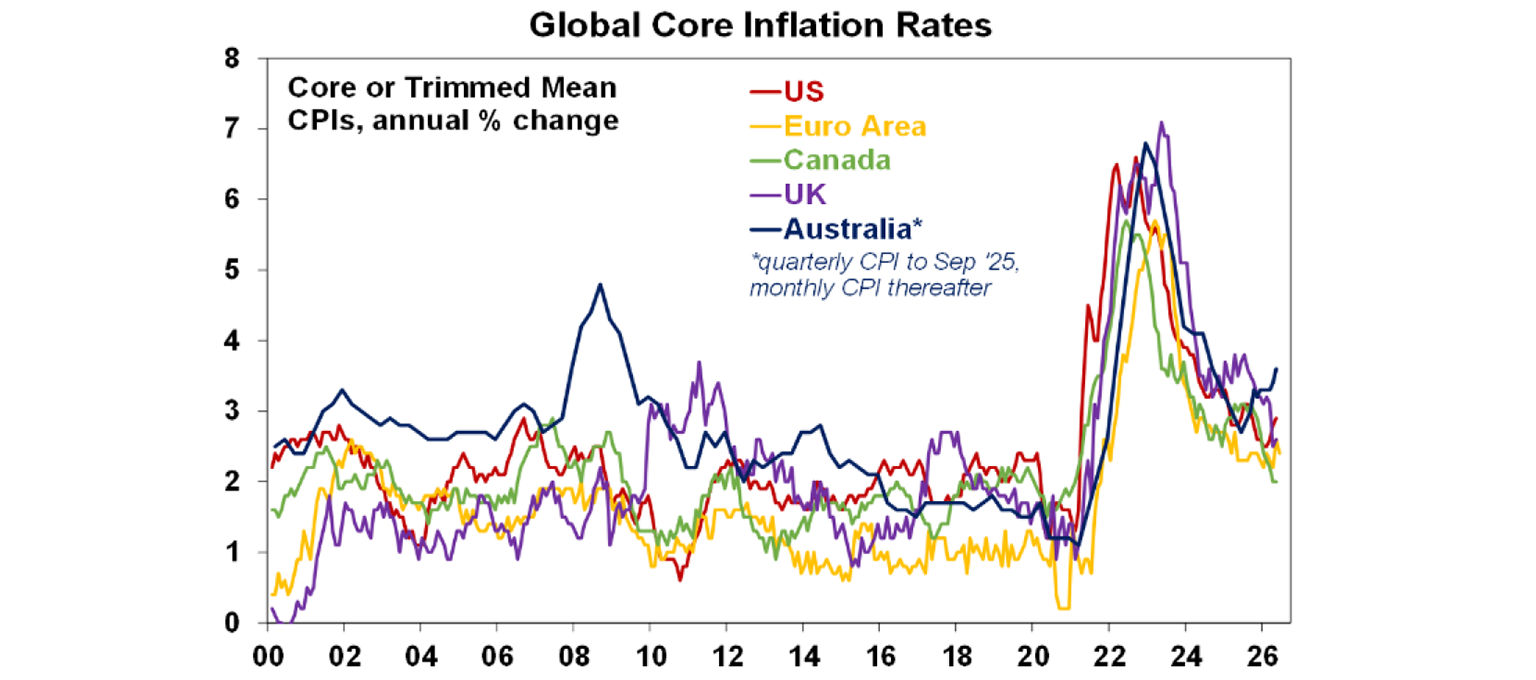
In Australia the minutes from the last RBA meeting noted that financial conditions were “somewhat restrictive” with signs that monetary tightening was being transmitted to the economy. But it also appeared to reiterate the RBA’s tightening bias noting that capacity pressures remained with “widespread inflationary pressures” and that the hold in June was to assess things. The next chart continues to highlight that underlying inflation remains more of a problem in Australia than in other comparable countries. We continue to expect another RBA hike in August, but we also see it as a close call, particularly with signs that the downswing in home prices is gathering pace.
Some light at the end of the tunnel in the renewables transition? The last decade seems to have been full of bad news on the electricity price front with all sorts of reasons given for surging prices. But the last month or so has seen some positive news with the Energy Market Regulator announcing a reduction in rates under in the default market offer from July 1 (of course those already on a cheaper deal may still see a rise in prices) and the Energy Market Operator halving its projections for expensive poles and wire projects and cutting its projections for the amount of gas likely to be required over the next 25 years by nearly 40%. This reflects a combination of increased renewables and batteries in the system.
It seems some economists and market strategists are into making models to predict the winner of the 2026 FIFA World Cup. GDP - which allows for population size and income per person - is one of the best predictors of a country’s success in international sporting events. And as the next chart, put together by my colleague My Bui, shows there is a clear relationship between it a country’s world football rating. Those well above the red trendline are punching well above their weight in GDP terms – partly reflecting a national love of the soccer compared to those well below. Note that this chart works best as a log scale for GDP because there are diminishing returns to having additional GDP. Lots of other factors impact too of course, eg, in Australia there are several other highly popular versions of football that soccer has to compete with for players and dollars. And this holds Australia back relative to many European and South American countries where soccer dominates.
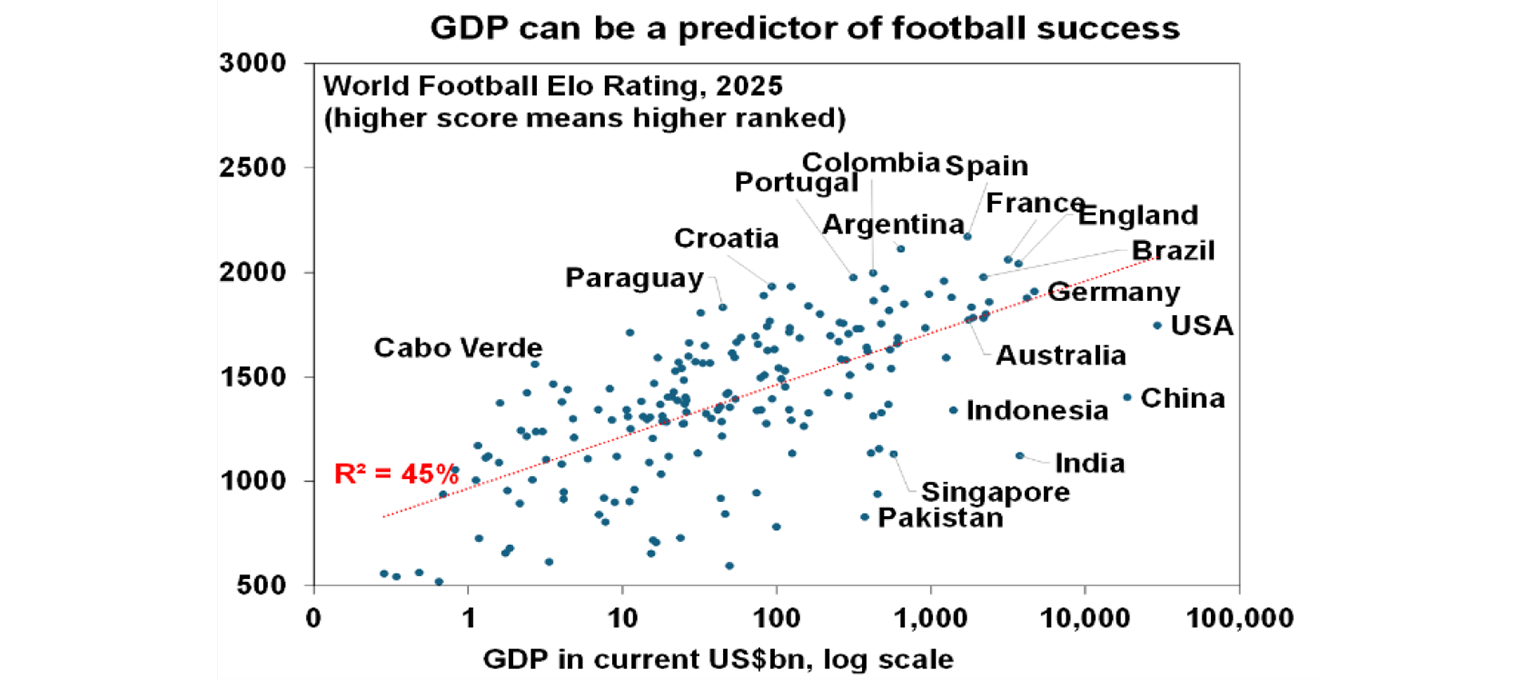
Beyond this, I would not have a clue so asked Chat GPT, and it told me (after looking at others’ models, bookmakers and football analysts) that the winner is likely to be France, followed by Argentina, then Spain, Brazil and England.
Major global economic events and implications
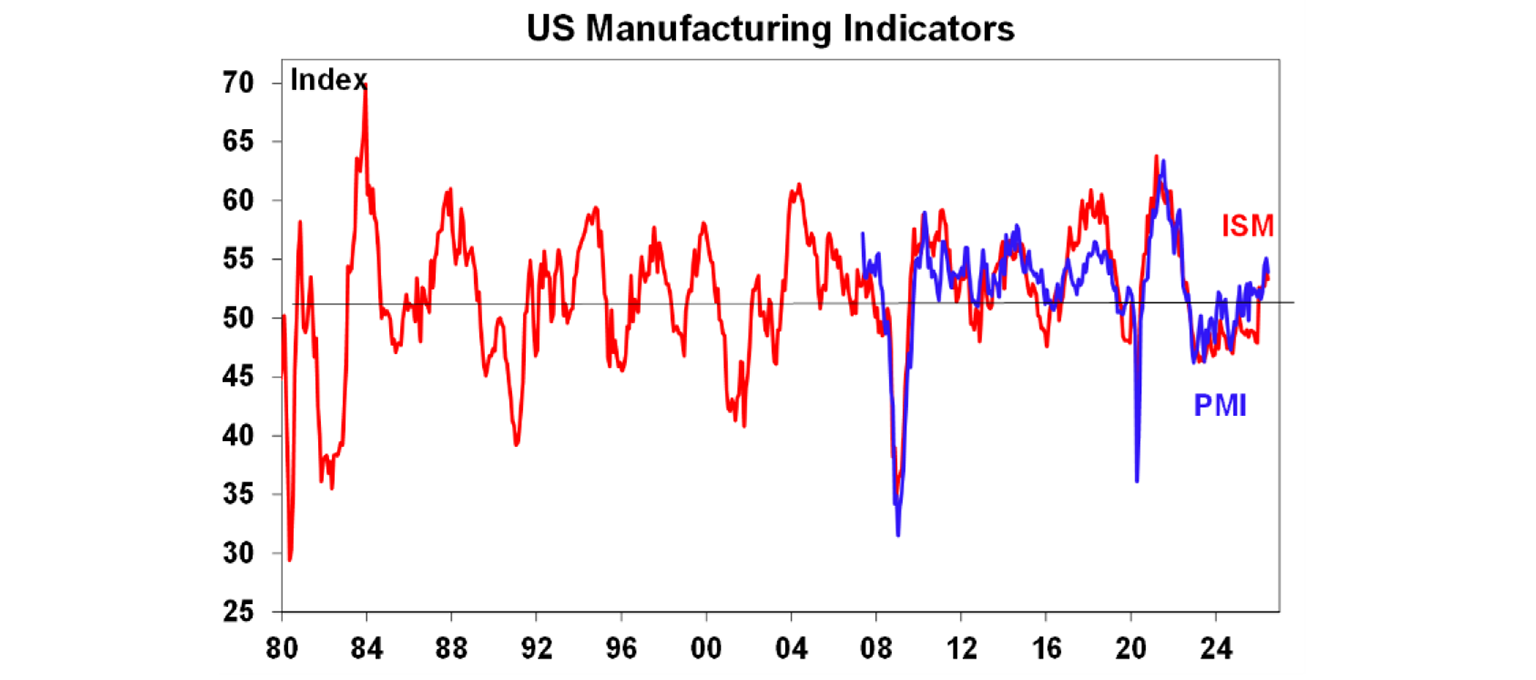
US economic data was a bit messy. Manufacturing conditions according to the June ISM and PMI indexes fell slightly but remain around okay levels. Against this consumer confidence rose slightly but remains soft with consumers viewing the jobs market less favourably and construction spending barely rose in May.
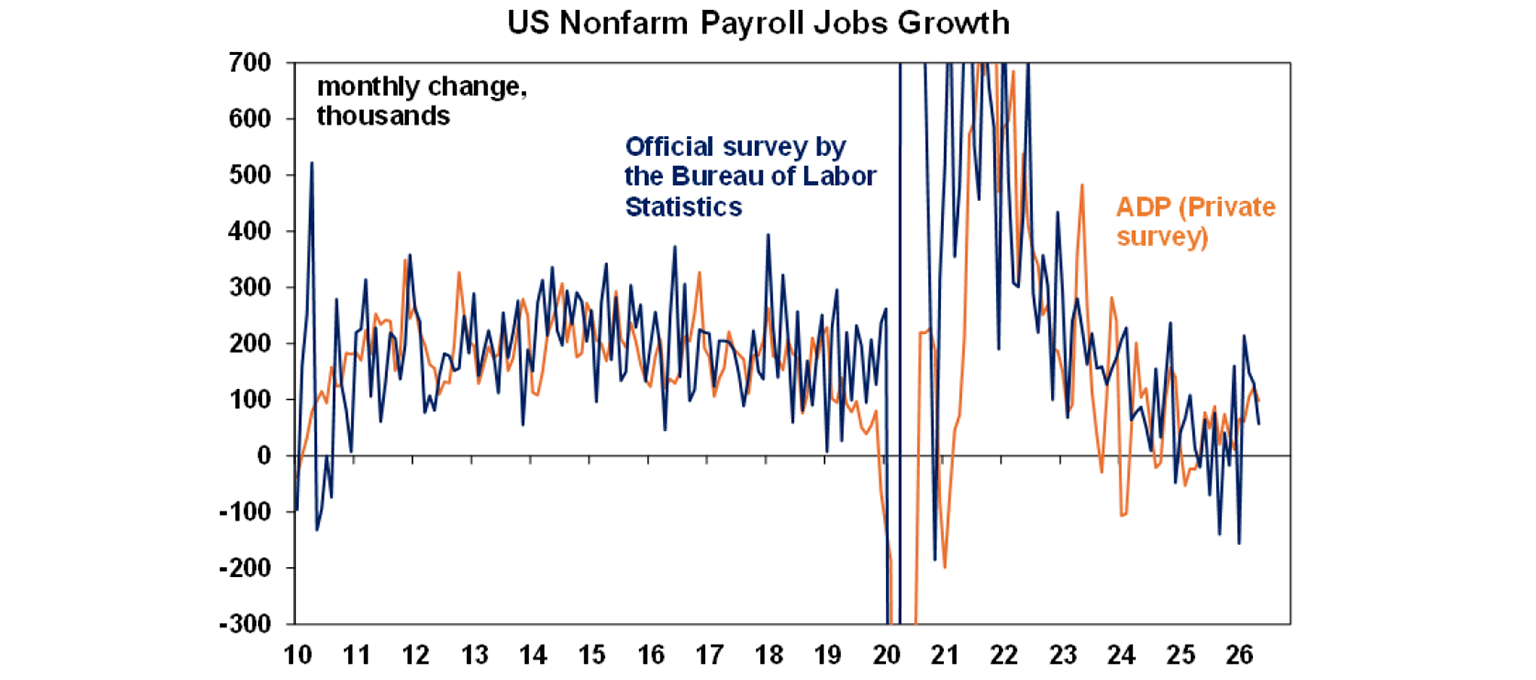
US payrolls cooled – but are not too hot or too cold. Payrolls rose a far less than expected 57,000 with prior months revised down by 74,000. Unemployment fell to 4.2% but only because of a sharp fall in the participation rate offsetting a 507,000 fall in household survey employment – all of which looks more like noise than signal. And growth in average hourly earnings remained around a benign 3.5%yoy. Cutting through the statistical noise the overall impression is that the US jobs market is better than last year but not overheating. This in turn takes some pressure off the Fed for a rate hike – although inflation will be key.
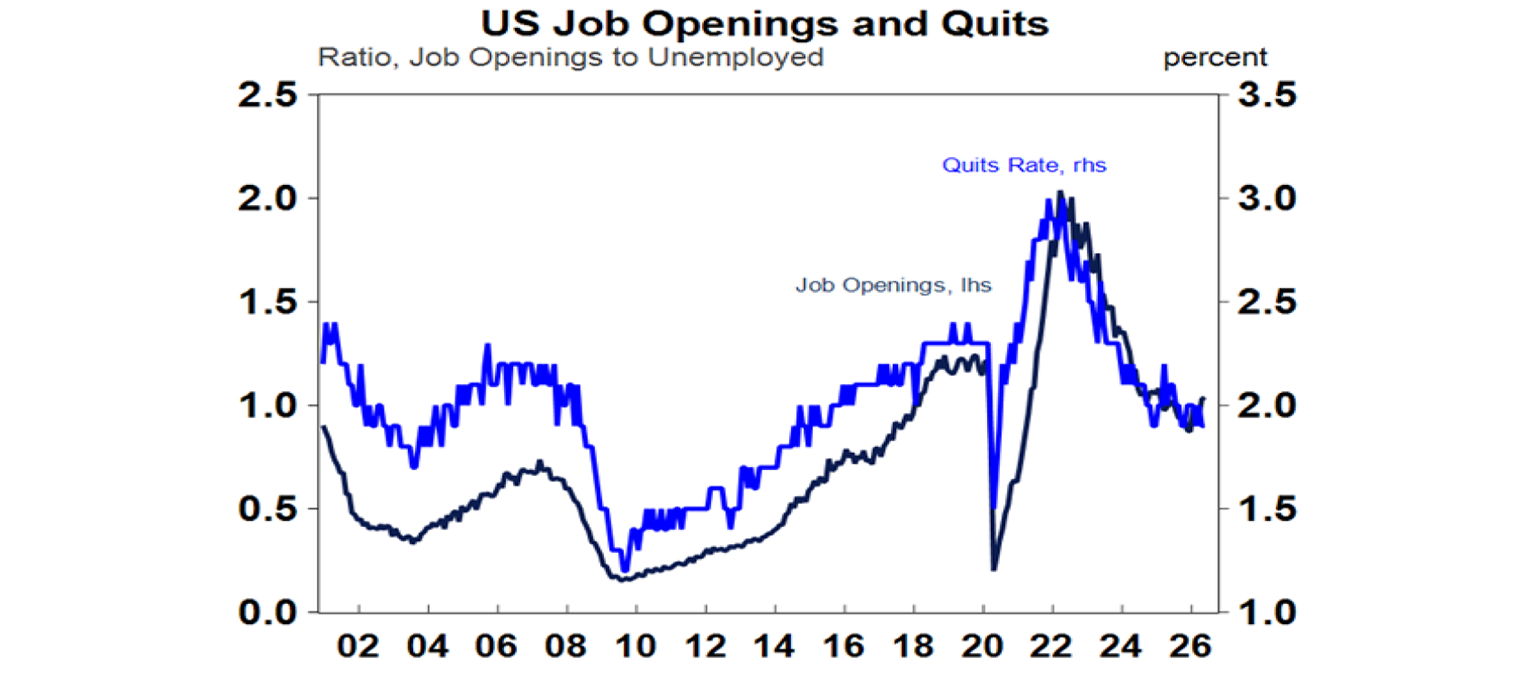
Meanwhile US job openings rose in May with the quits rate unchanged and both running around okay levels. And jobless claims remain low. Interestingly, the Atlanta Fed’s GDPNow tracker of GDP growth this quarter has now slumped to just 1.2% annualised growth largely reflecting trade data pointing to a detraction from growth from trade.
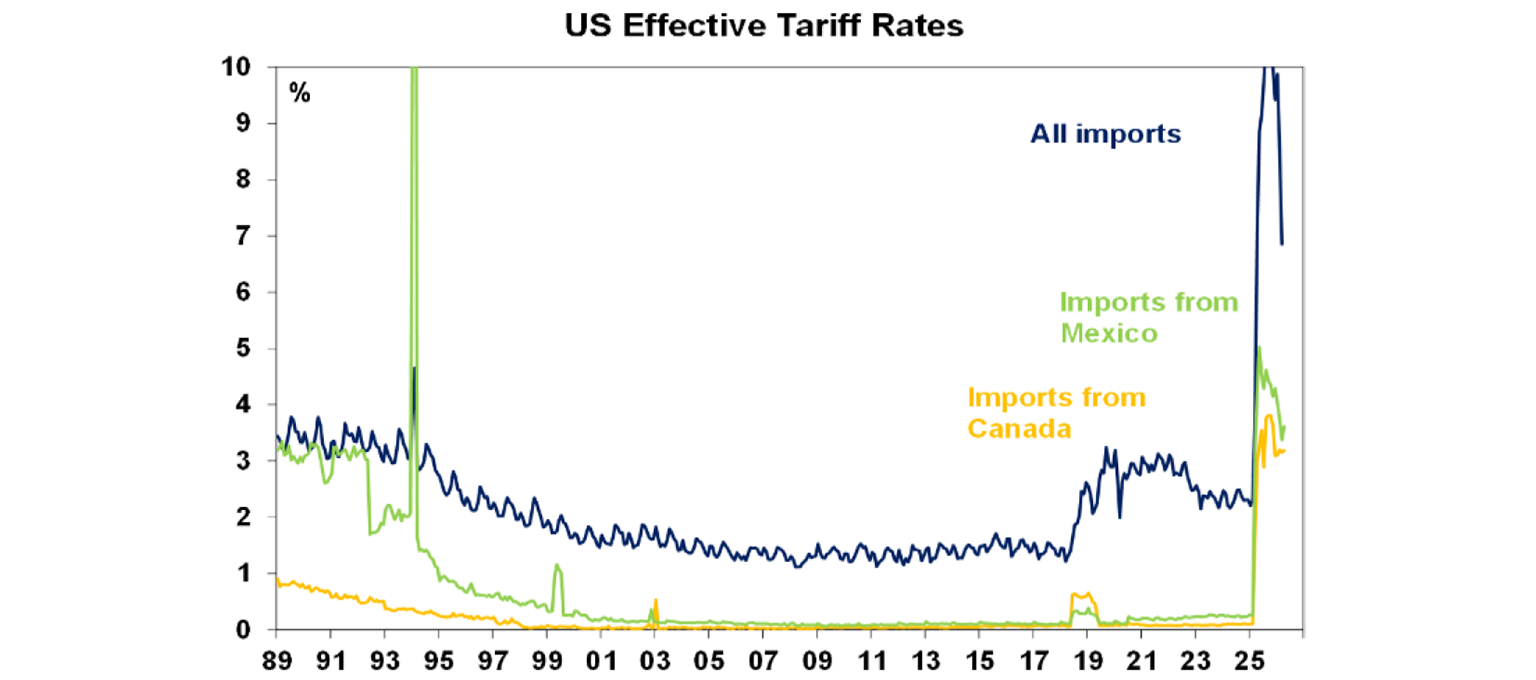
On trade, the US announced it would not renew the US, Mexico and Canada trade agreement, but it will engage in talks to address various issues. For now this means “the USMCA remains in force pending resolution of these issues” or its termination in 2036 which means Mexico and Canada can continue to have lower tariffs on goods that meet USMCA rules. This means goods from Mexico and Canada going into the US face average tariff rates around half of those from the average of other countries.
Eurozone inflation fell more than expected in June both at a headline level reflecting lower fuel prices and at a core level. This reduces the case for another ECB rate hike although the money market still sees another hike by year end. An AI boom related wave in inflation could be an upside risk though partly offsetting relief from lower energy prices. Eurozone unemployment dipped to 6.2% in May.
Japanese economic data was solid. Industrial production rose less than expected but retail sales rose more than expected, unemployment remained at 2.5%, housing starts rose sharply in May, and the Tankan business survey showed strong conditions in the June quarter.
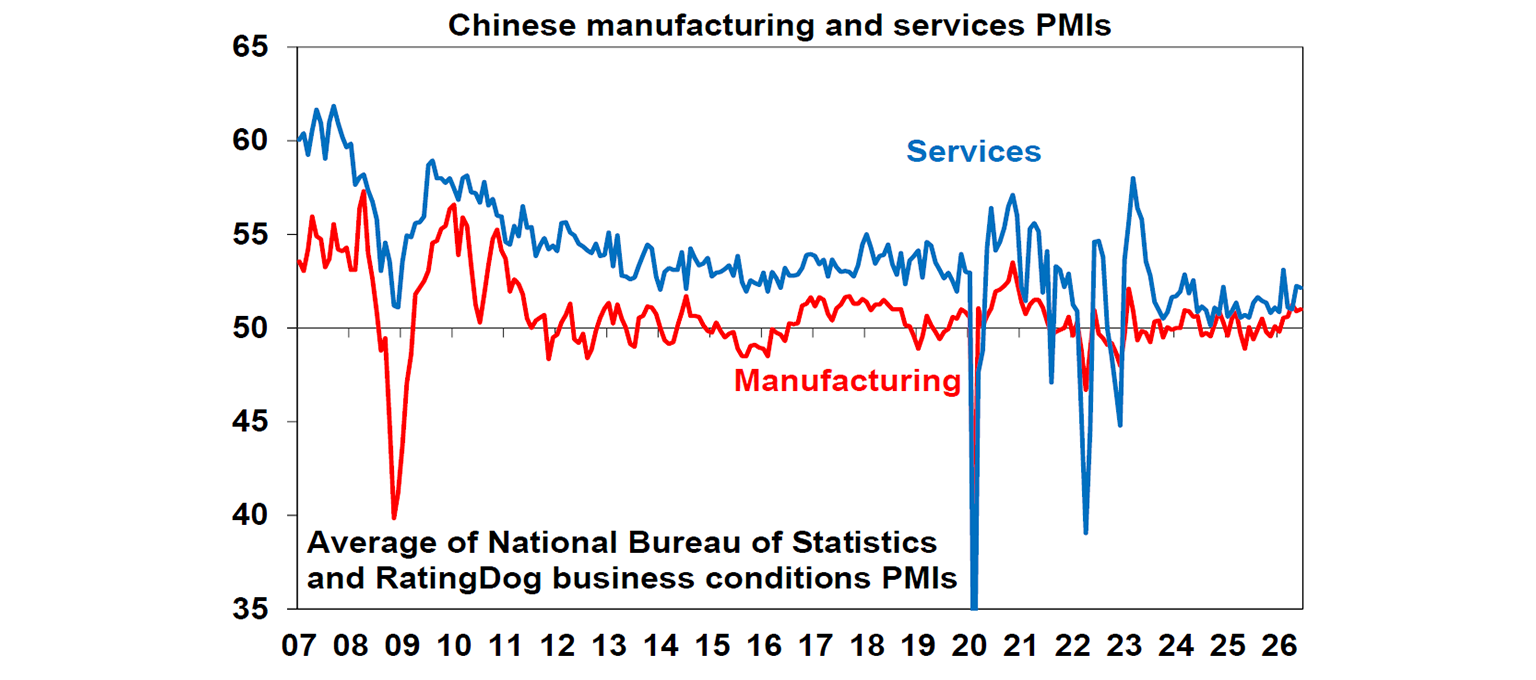
Chinese business conditions PMIs for June were little changed and remain at levels consistent with GDP growth running around 4-5%yoy.
Australian economic events and implications
The home price downturn accelerated in June with prices falling 0.4%mom and the previous two quarters revised to show declines. While the slide is being led by Sydney and Melbourne, Brisbane and Adelaide look like they will go negative soon too.
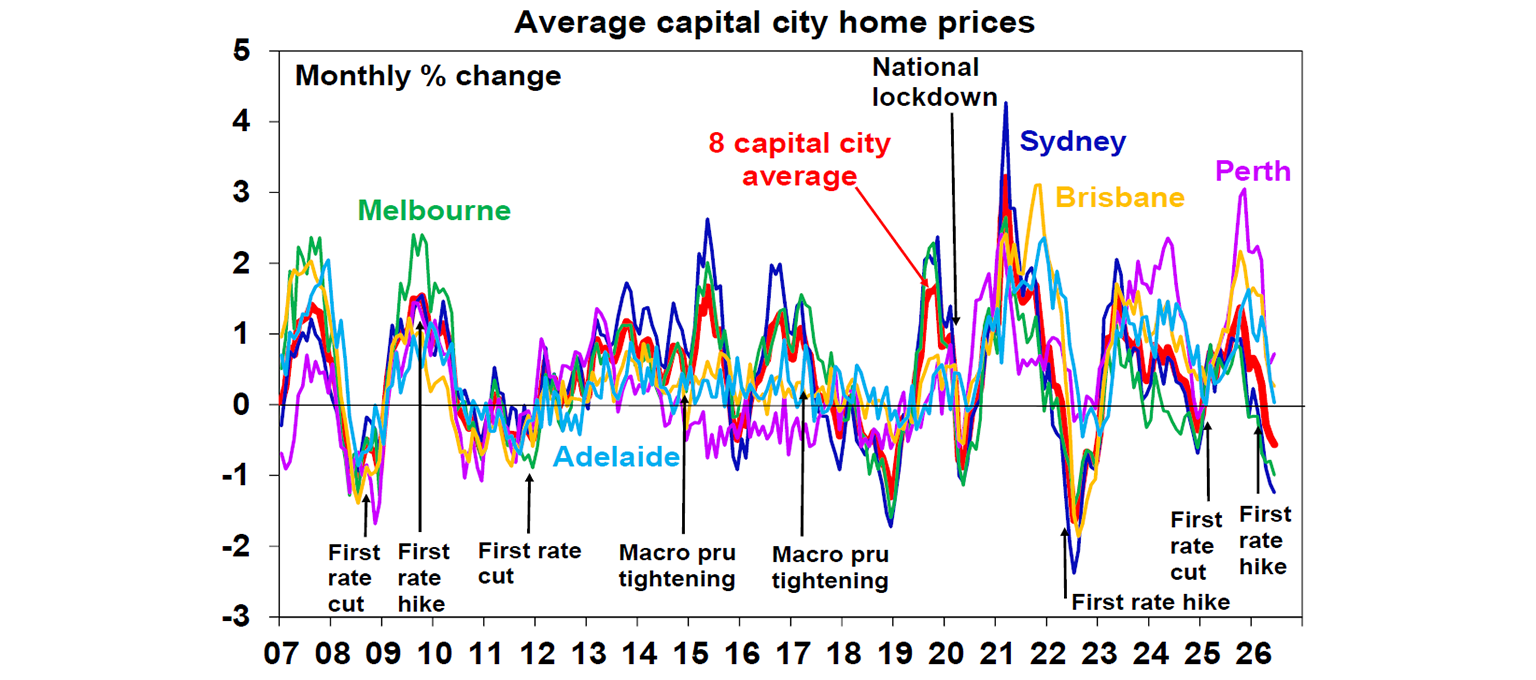
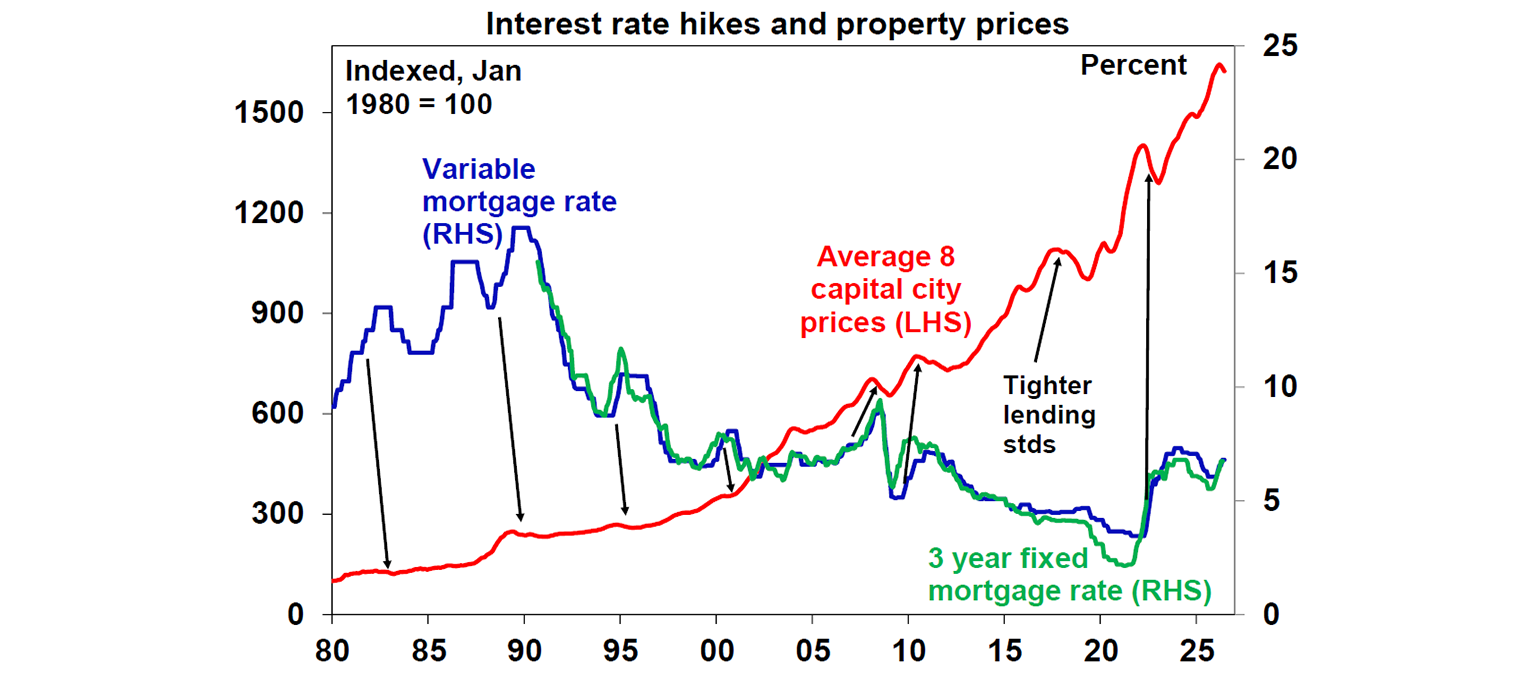
So far it’s just a flick of the top for house prices and the sort of thing you would expect when interest rates rise. National average prices are down around 1% from their high after a 26% surge over the prior three years. But the downturn likely has further to go reflecting the impact of rate hikes, low confidence, poor affordability and the move in the Budget to wind back virtually all investor property tax concessions. Given the role the concessions had played in attracting investors into the property market over many years their removal has logically seen many investors retreat to the sidelines waiting for lower prices and higher rents before committing, but it also likely means that unaffected buyers will also hold back to see what happens. We now expect a 2% fall in property prices this calendar year and a 6% fall over the next 12 months, resulting in a top to bottom fall of around 7%. If unemployment rises substantially the fall is like it be greater. By the June quarter next year property prices are likely to bottom as the market starts to focus on RBA rate cuts in 2027.
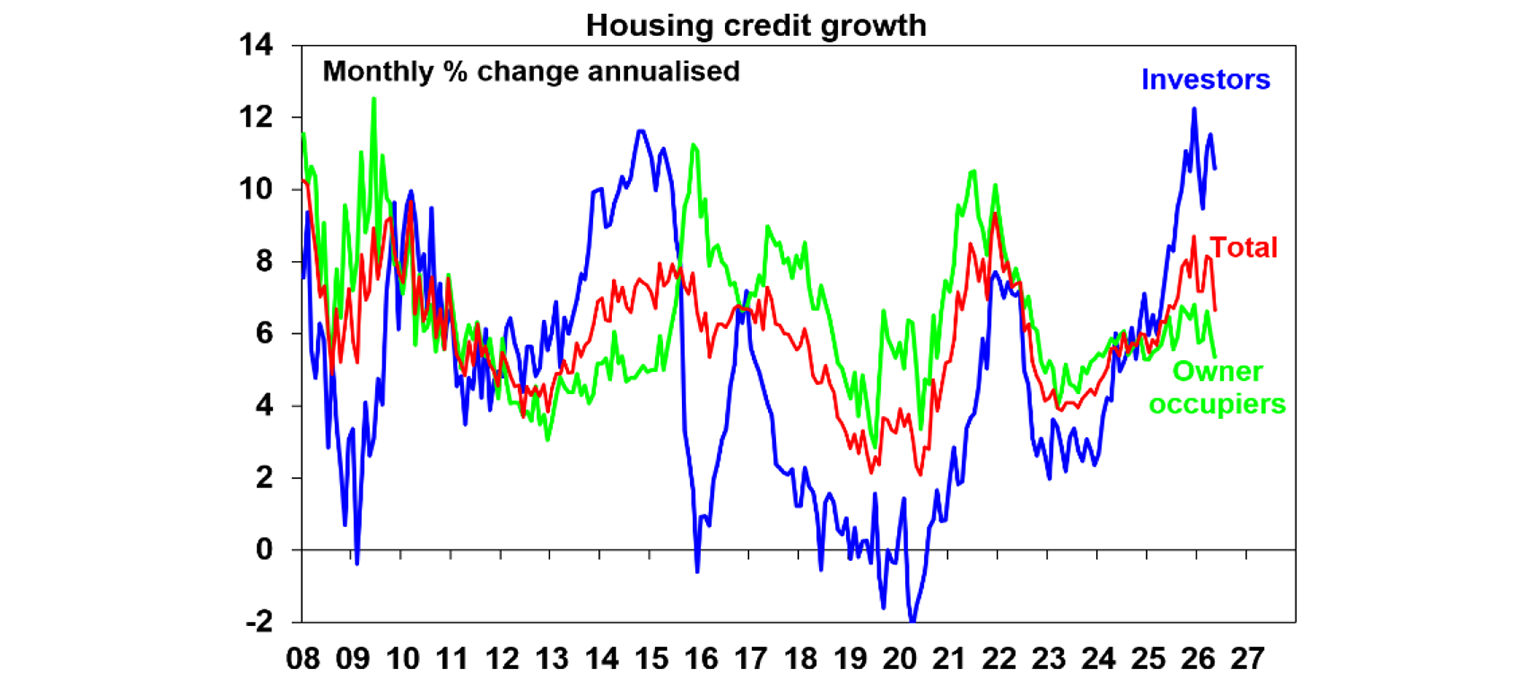
Housing credit growth for May is showing signs of rolling over as rate hikes hit, but as it lags actual lending commitments it’s too early to see the impact of the Budget tax changes on lending to investors.
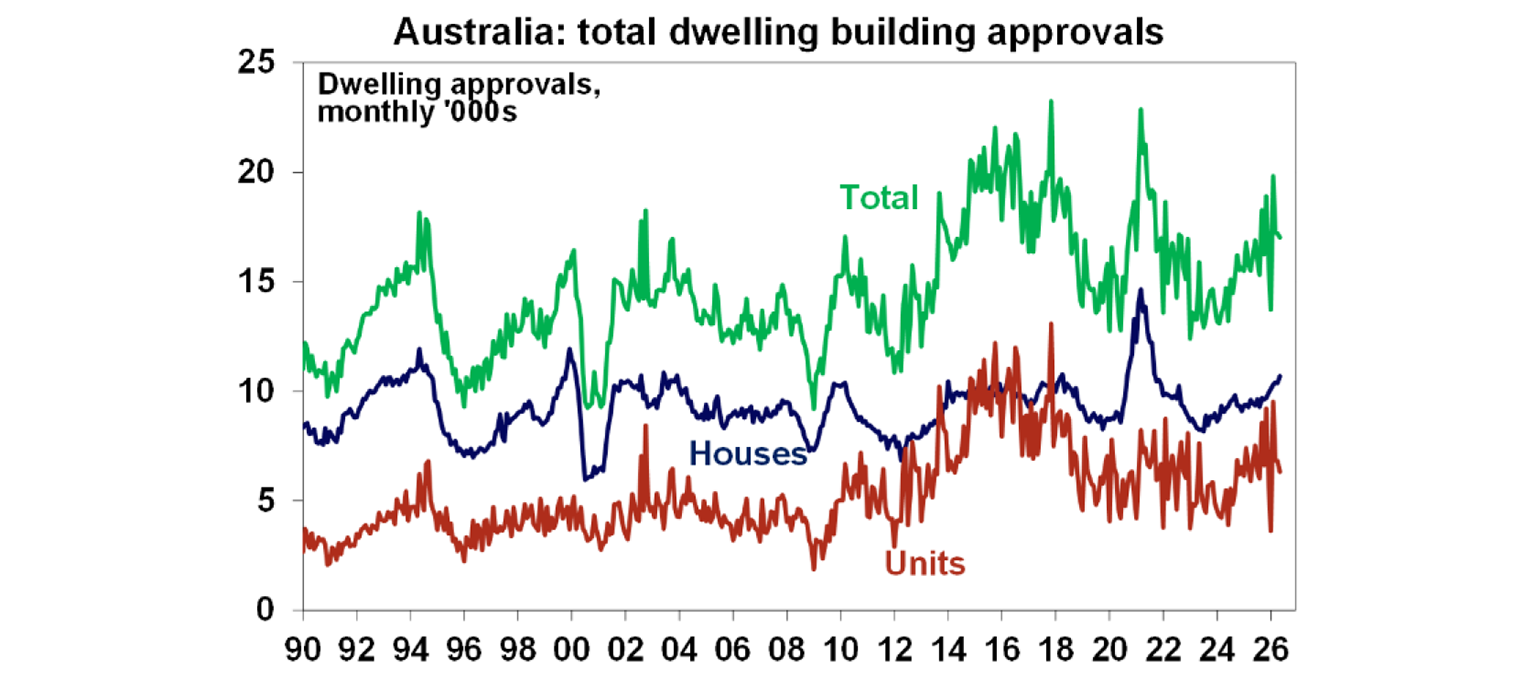
One source of support preventing a deeper slump in property prices is the housing shortfall and this is unlikely to change anytime soon. Home building approvals fell 1.1% in May with a 7.3%mom fall in volatile unit approvals. They are trending around 204,000 at an annual rate which is up from the 2023 low but still below the Housing Accord target of 240,000 a year which is necessary to meet regular annual demand and eat into the shortfall. The rise in mortgage rates risks driving a slowing in approvals from here.
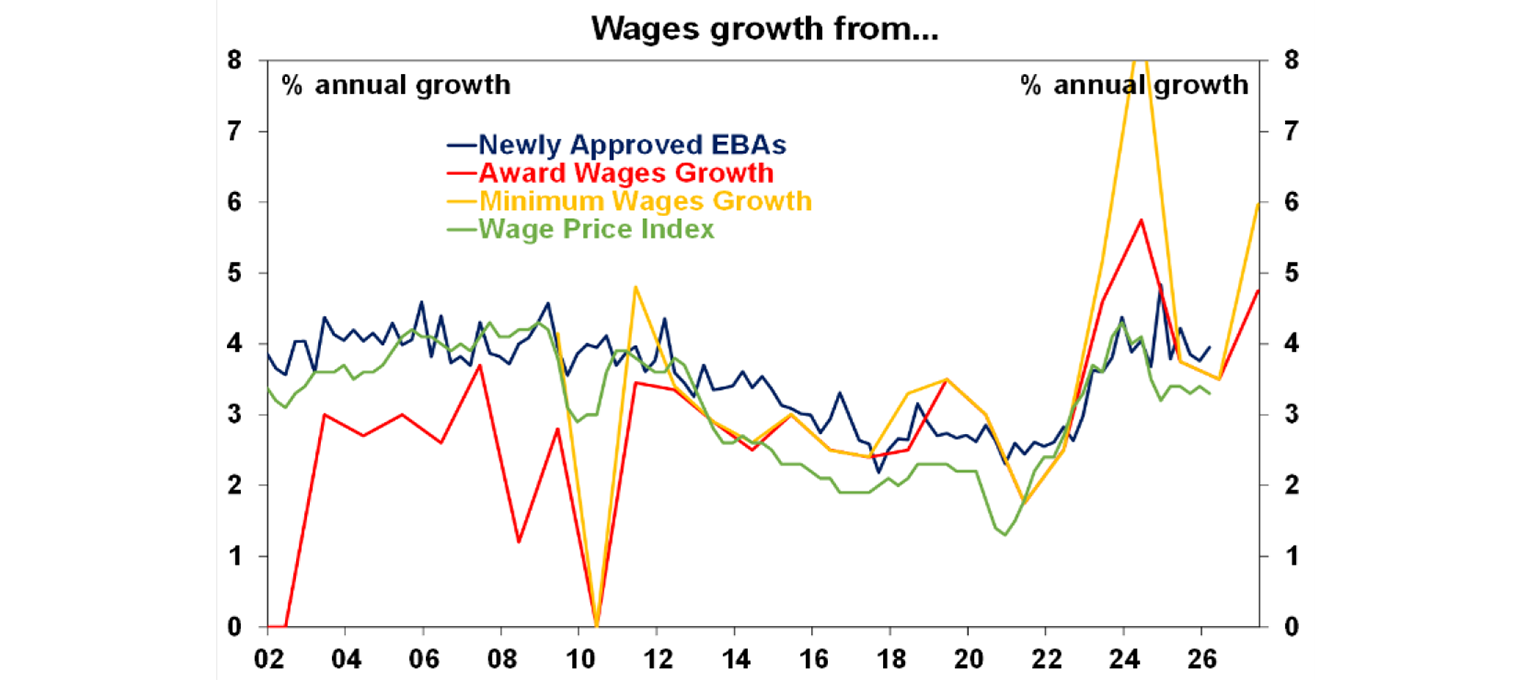
Wages growth under newly approved enterprise bargaining agreements rose a notch in the March quarter but is still around 4%. However, the pick-up in inflation and minimum and award wages risks some acceleration ahead.
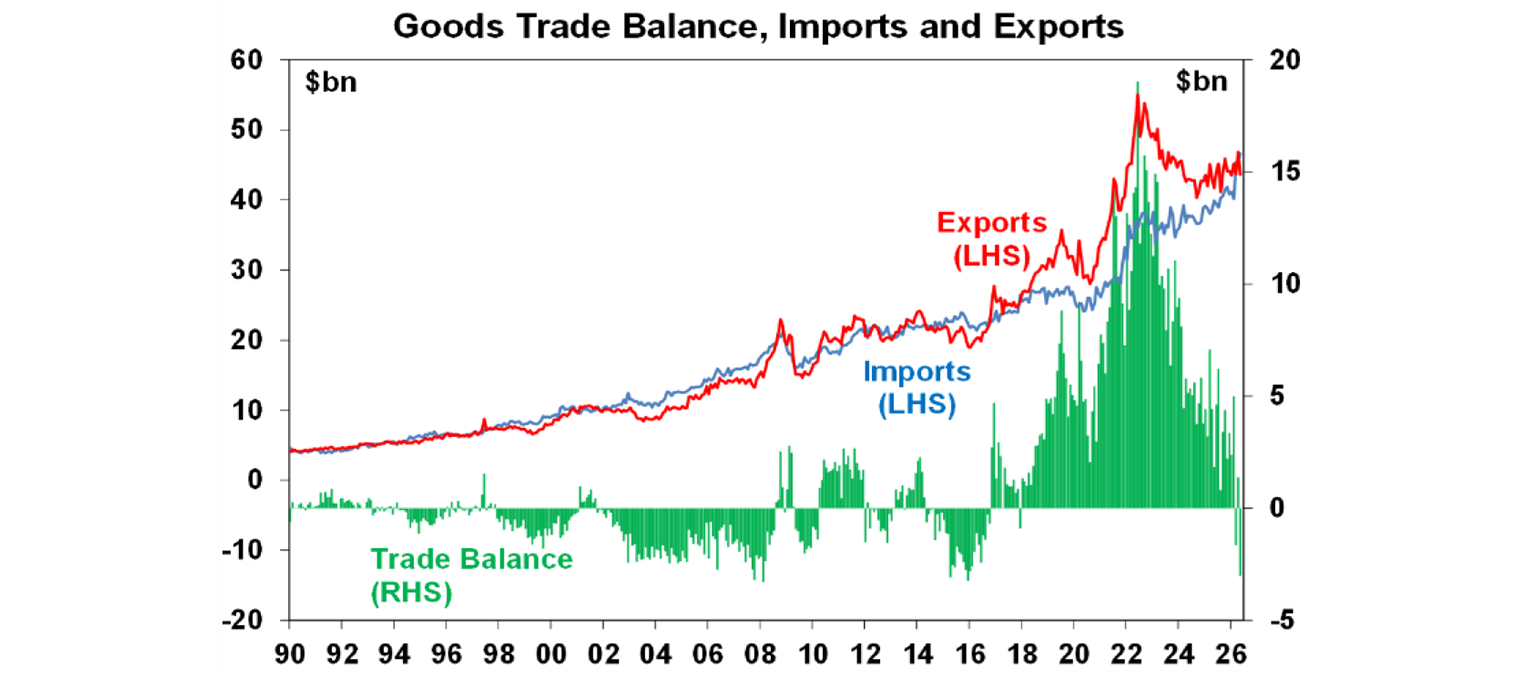
The trade surplus fell back into a deficit in May of $3bn, with exports up 6.9% with a fall in gold and gas exports and imports up nearly 3% reflecting lumpy aircraft, telco equipment and a spike in cars – maybe the rush into EVs on the back of higher oil prices! Net exports could be a detractor from June quarter GDP growth adding to the risk of return to a per capita recession.
What to watch over the next week?
In the US, the services conditions ISM index for June (Monday) is likely to remain solid at around 54, the minutes from the last Fed meeting (Tuesday) are likely to reiterate a tightening bias and existing home sales (Thursday) are likely to rise slightly but remain weak.
Chinese inflation data for June (Thursday) is likely to show a slight fall in consumer price inflation to 1.1%yoy but with core inflation remaining around 1.1%yoy.
The Reserve Bank of New Zealand (Wednesday) is expected to hike its cash rate by 0.25% to 2.5%
In Australia a speech by RBA Chief Economist Sarah Hunter (Wednesday) will be watched for clues on the interest rate outlook and data on job ads and the Melbourne Institute’s Inflation Gauge for June will be released Monday.
Outlook for investment markets
Global and Australian share markets are likely to remain volatile with the risk of another correction given uncertainty about the peace deal with Iran, still stretched valuations, sticky inflation, political uncertainty associated with Trump & the midterm elections and worries about the impact of AI and whether there is an AI bubble. However, returns should still be positive for the next 12 months as a whole thanks to Trump still likely to pivot to consumer-friendly policies ahead of the mid-terms, continuing economic growth with recession avoided and solid profit growth.
Bonds are likely to provide returns below running yield.
Unlisted commercial property returns are likely to be solid helped by strong demand for industrial property associated with data centres.
Australian home prices are expected to fall around 2% this year and by 6% over the next 12 months as a result of poor affordability, RBA rate hikes, reduced investor demand flowing from the winding back of negative gearing and the capital gains tax discount and poor confidence. This will mean roughly a 7% top to bottom fall
Cash and bank deposits are expected to provide returns around 4-5%.
The $A is likely to rise reflecting the wider interest rate differential to the US, although a move to Fed hikes may limit this. Fair value for the $A is around $US0.72.
You may also like
-

Oliver's insights Charts to watch 21 July 2026 Share markets had a strong first half despite the oil supply shock as expectations for de-escalation, okay economic data, strong profits and the AI boom provided an offset. -

Weekly market update - 17-07-2026 Following the renewed escalation in the US/Iran conflict, the Strait of Hormuz is effectively closed again with Iran attacking ships and the US attacking Iran and blockading its ports. Both are now back to attacking energy infrastructure which is a signficant & concerning escalation. -

Oliver's insights - Why have Australian living standards “fallen” and how do we fix it? For the last few years there has been much talk of a “cost-of-living” crisis in Australia and of “falling living standards”. This has flared up again lately with the pickup in inflation resulting in a renewed fall in real wages.
Important information
Any advice and information is provided by AWM Services Pty Ltd ABN 15 139 353 496, AFSL No. 366121 (AWM Services) and is general in nature. It hasn’t taken your financial or personal circumstances into account. Taxation issues are complex. You should seek professional advice before deciding to act on any information in this article.
It’s important to consider your particular circumstances and read the relevant Product Disclosure Statement, Target Market Determination or Terms and Conditions, available from AMP at amp.com.au, or by calling 131 267, before deciding what’s right for you. The super coaching session is a super health check and is provided by AWM Services and is general advice only. It does not consider your personal circumstances.
You can read our Financial Services Guide online for information about our services, including the fees and other benefits that AMP companies and their representatives may receive in relation to products and services provided to you. You can also ask us for a hardcopy. All information on this website is subject to change without notice. AWM Services is part of the AMP group.