





Weekly market update
Investment markets and key developments
Global shares had another ripper week with major share markets reaching new all-time highs, before retracing slightly on Thursday as the Iran “deal” seems further away than previously thought.
10 min read

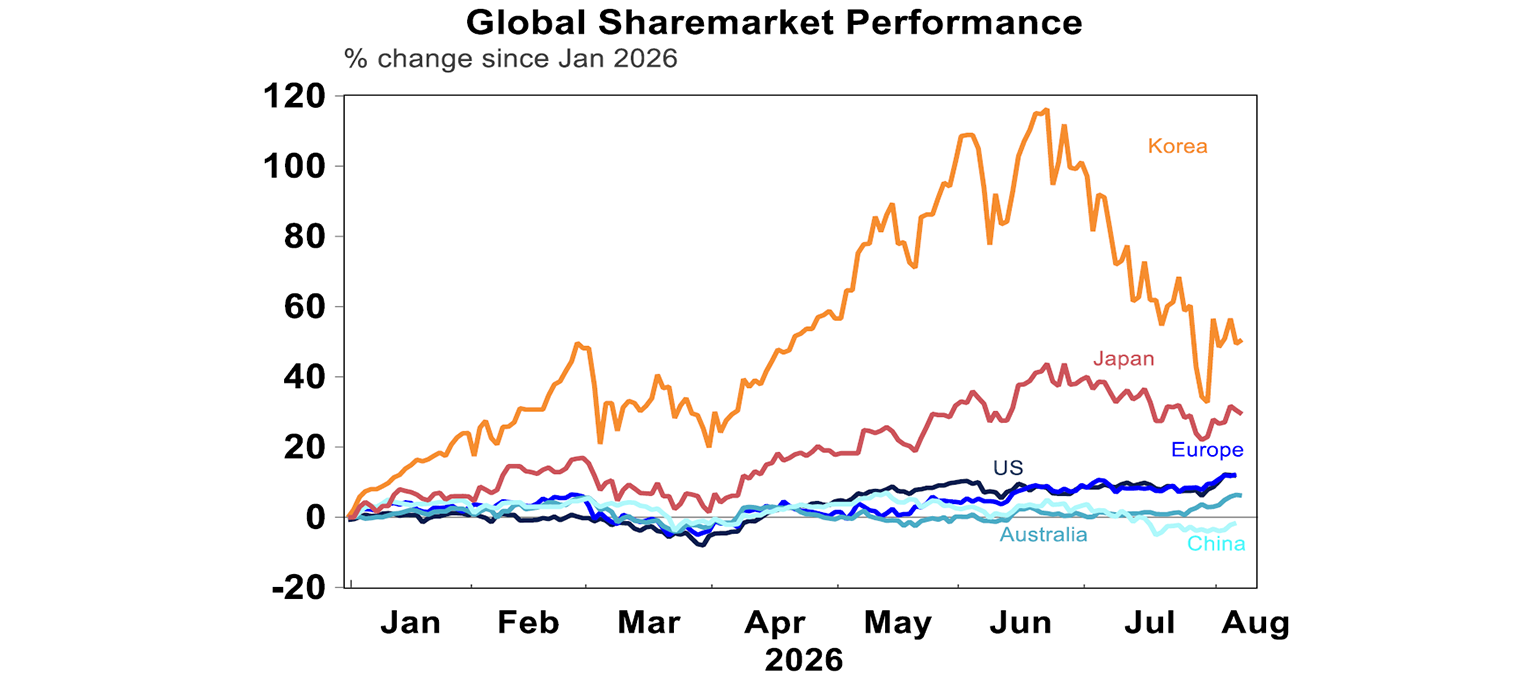
Global shares had another ripper week with major share markets reaching new all-time highs, before retracing slightly on Thursday as the Iran “deal” seems further away than previously thought. US shares rose 3.6% over the week, with broad-based gains across cyclical sectors including IT, materials, industrials, and consumer discretionary. The Euro Stoxx gained 2.6%, Japanese shares rose 1.9% and Chinese shares were up 2.3%. Even the ASX 200, which has lagged this year, reached record highs and is now up 3.2%, helped by a positive start to earnings season and gains across most sectors except energy and utilities.
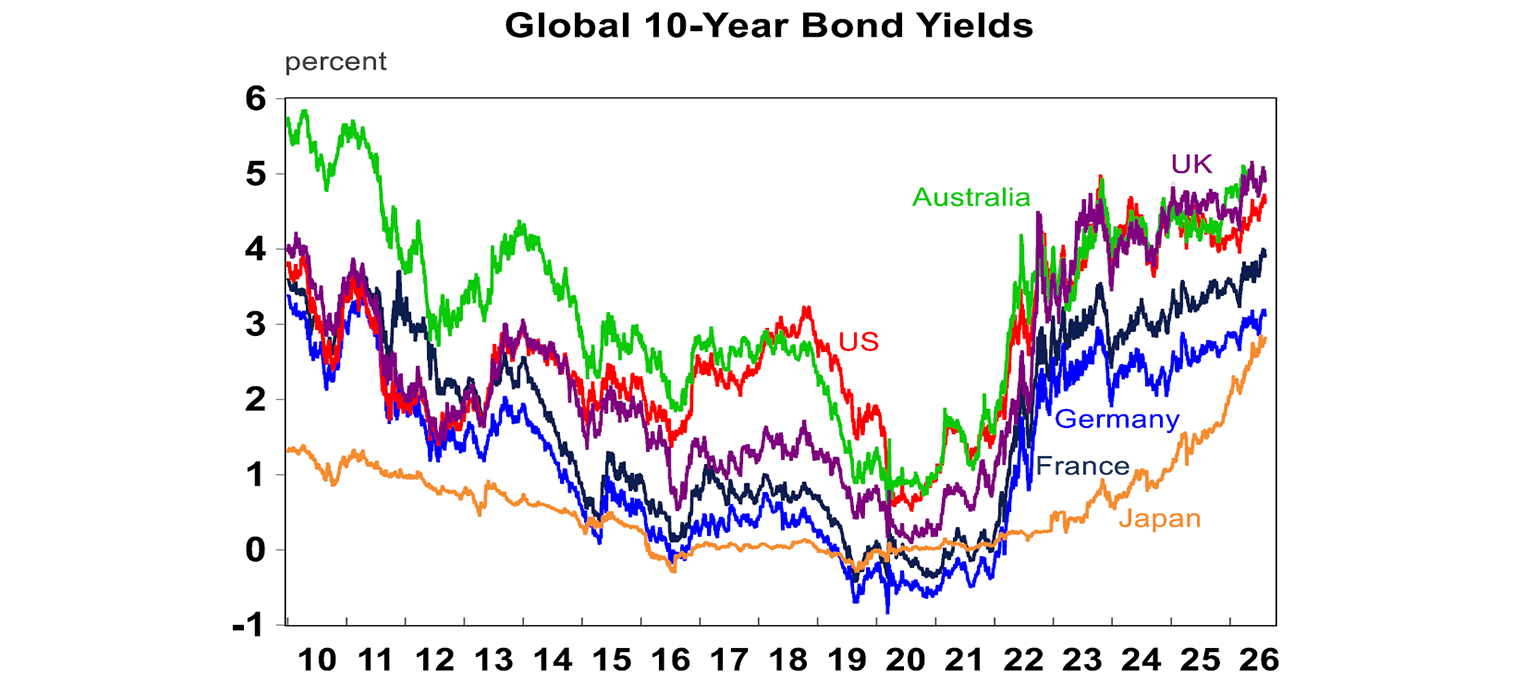
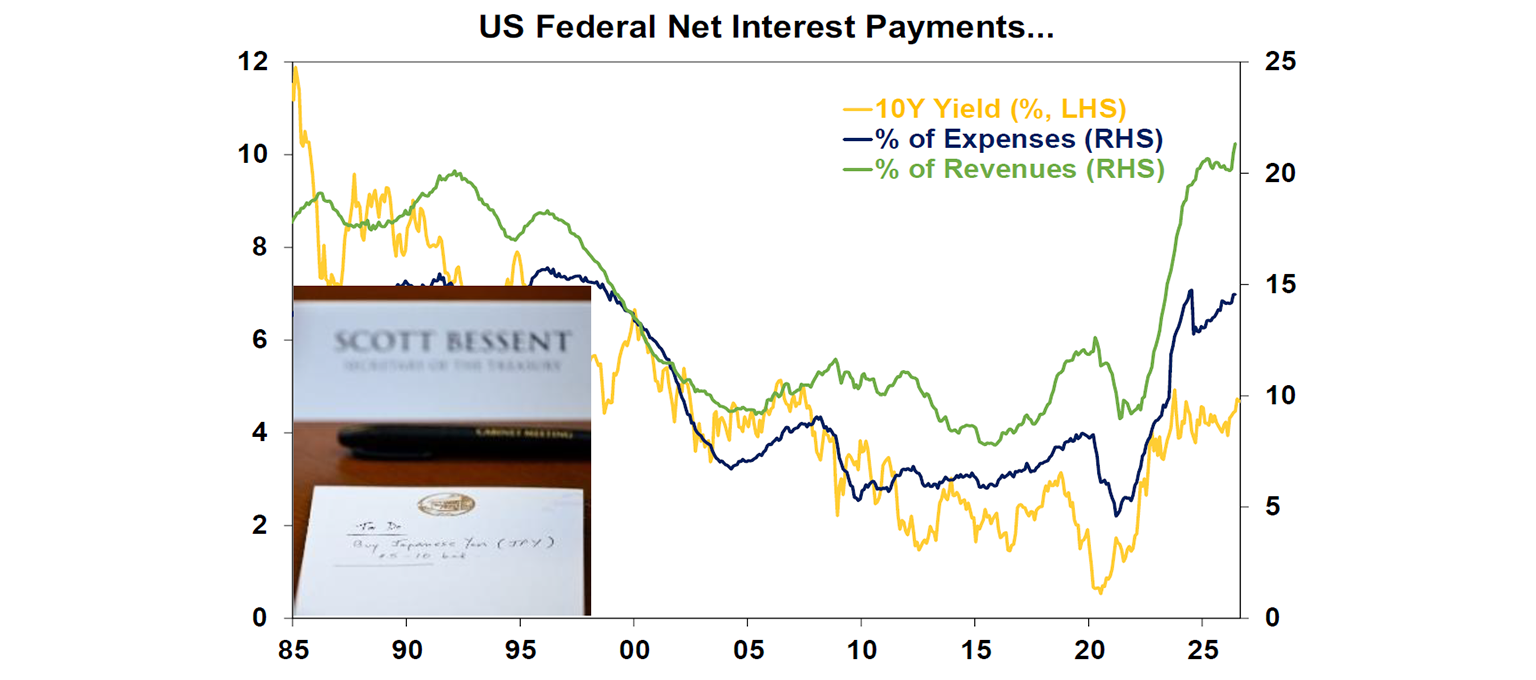
Bond yields ended the week marginally lower, with the US 10-year yield easing to 4.64% from 4.73% last week with markets in a risk-on mood. But the trend remains up since March this year partially driven by inflation concerns. The US Treasury curve has also seen higher term premium lately, reflecting concerns about US economic policy. These include Trump’s renewed attempt to fire Fed Governor Lisa Cook, Kevin Warsh’s preference for less forward guidance, reports that Warsh and Trump have maintained regular direct communication (unlike previous Fed Chairs), and Scott Bessent’s help to support the yen intervention (the first in almost 30 years); alongside longer-term worries about fiscal sustainability and structurally higher inflation from trade policy and geopolitical risks.
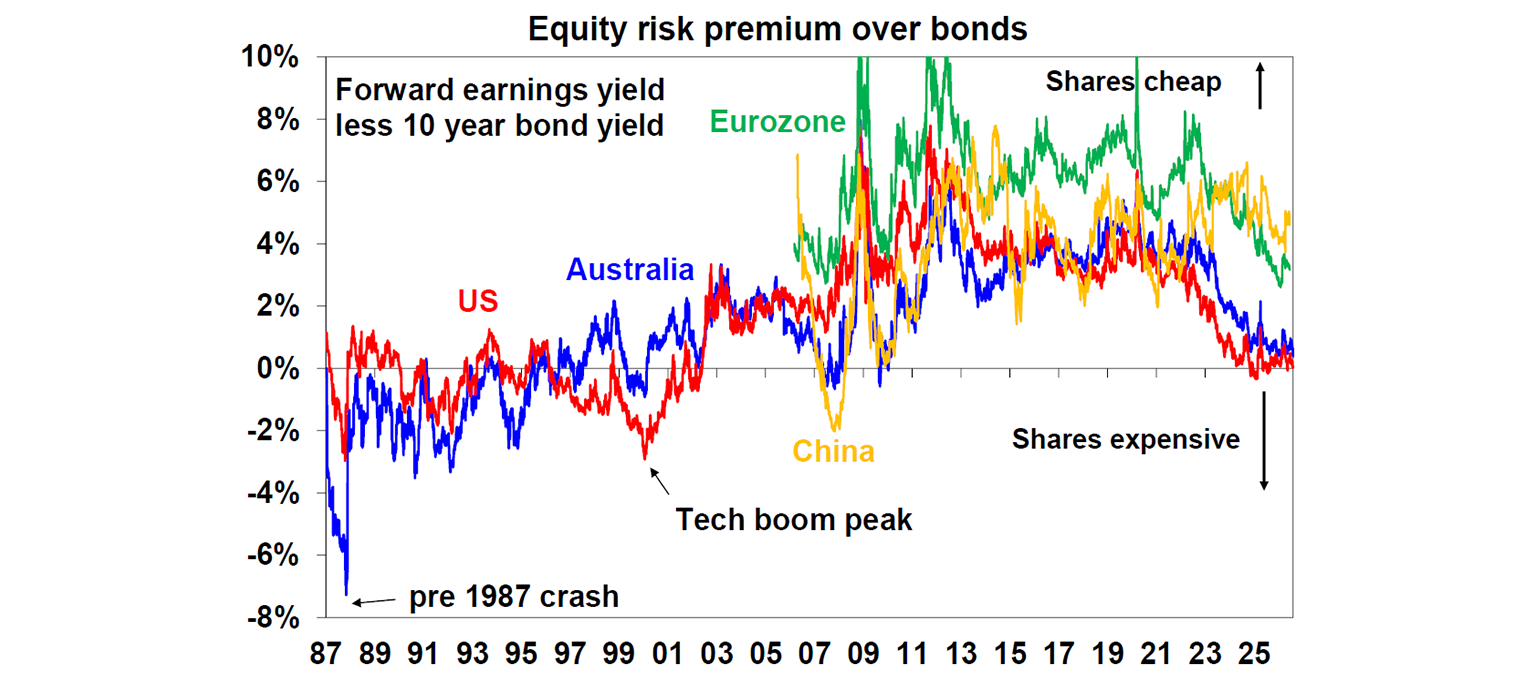
Even with rising interest rates, equity risk premium (earnings yield above bond yields) remained in the same range they have been in in the last two years. Both actual and forecast earnings are still trending up especially in the US, supported by still resilient economic data, which have propelled shares to new highs despite the unending cycle of news around the US-Iran war.
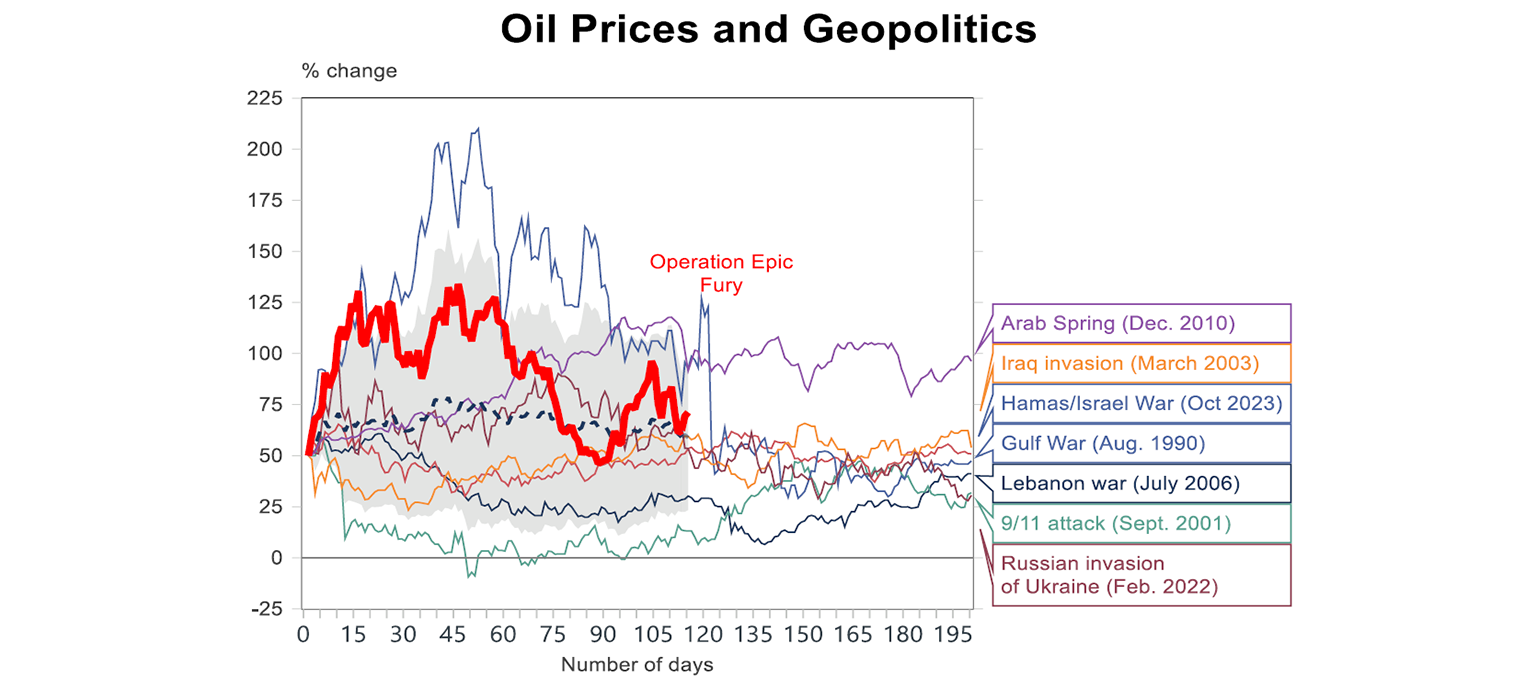
Markets were on another Middle East war rollercoaster this week, with weekend escalation from the US tempered by Treasury Secretary Scott Bessent’s Tuesday comment that a deal could come “today or tomorrow”. Positive sentiment has helped gold prices break out of a technical resistance level this week to above $4,250/oz (from just around $4,000 last week). But the leaked details of the expected “deal” between Iran and Oman looked unrealistic, with Iran reportedly demanding a ban on US and Israeli ships through the Strait of Hormuz, while the US maintained its regional blockade and pushed for traffic to resume. It is a classic game theory stalemate: neither side wants to back down because escalation serves their own interests! Now four days later, the Houthis have escalated attacks, Saudi Arabia seems to get pulled deeper into the conflict, Hormuz remains closed, and oil prices have bounced back above $80/bbl. It remained rangebound between $80 and $90/bbl in the last week and is unlikely to drop to below $70 anytime soon with all the back and forth – not too different from previous historical conflicts.
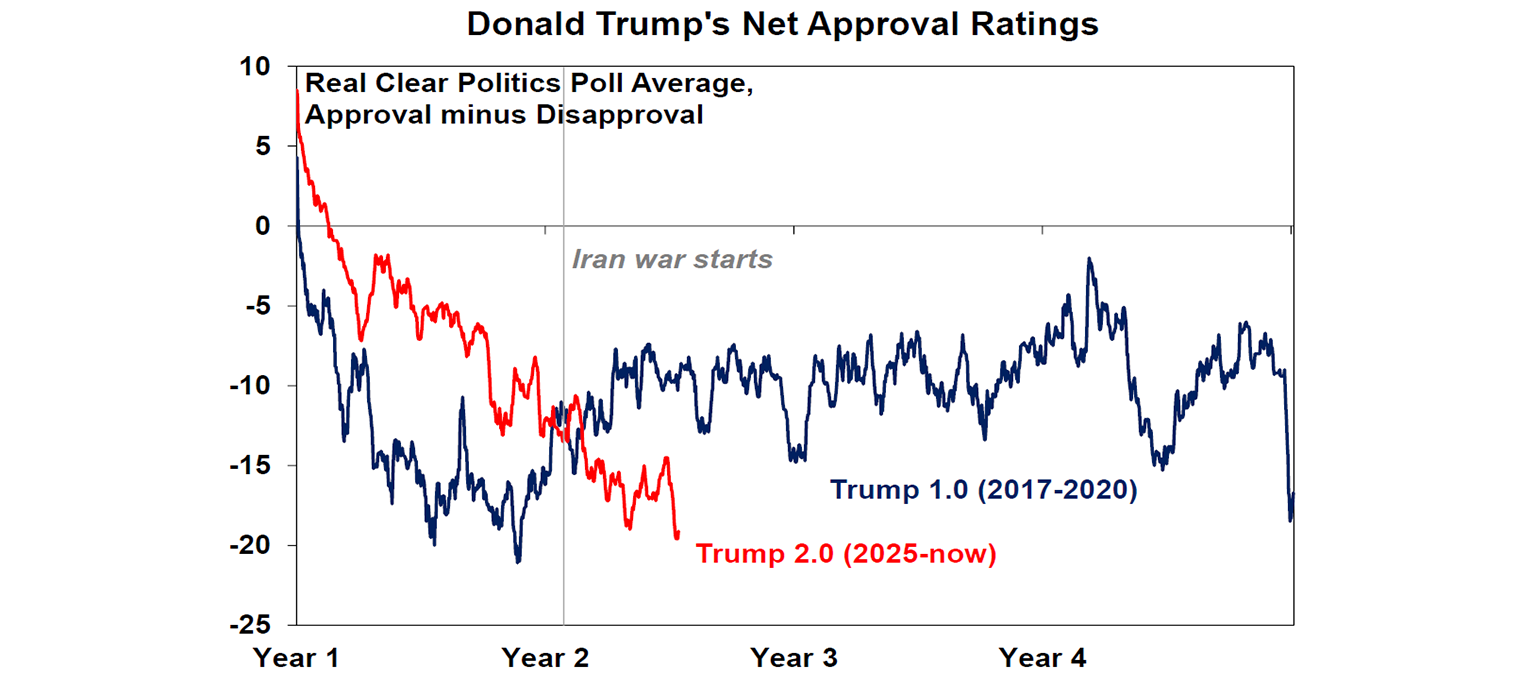
That being said, it’s probably best to follow Dr Shane Oliver’s 40-advice to “turn down the noise”; in other words, we can’t be too bearish given that Trump will likely TACO again at some point. In fact in the past week Trump’s approval ratings have fallen again to new lows for this term, with polls showing Americans are much more focused on gasoline prices and inflation than foreign affairs. So for now, it remains business as usual, with shares still supported by solid fundamentals, strong economic growth and rising productivity.
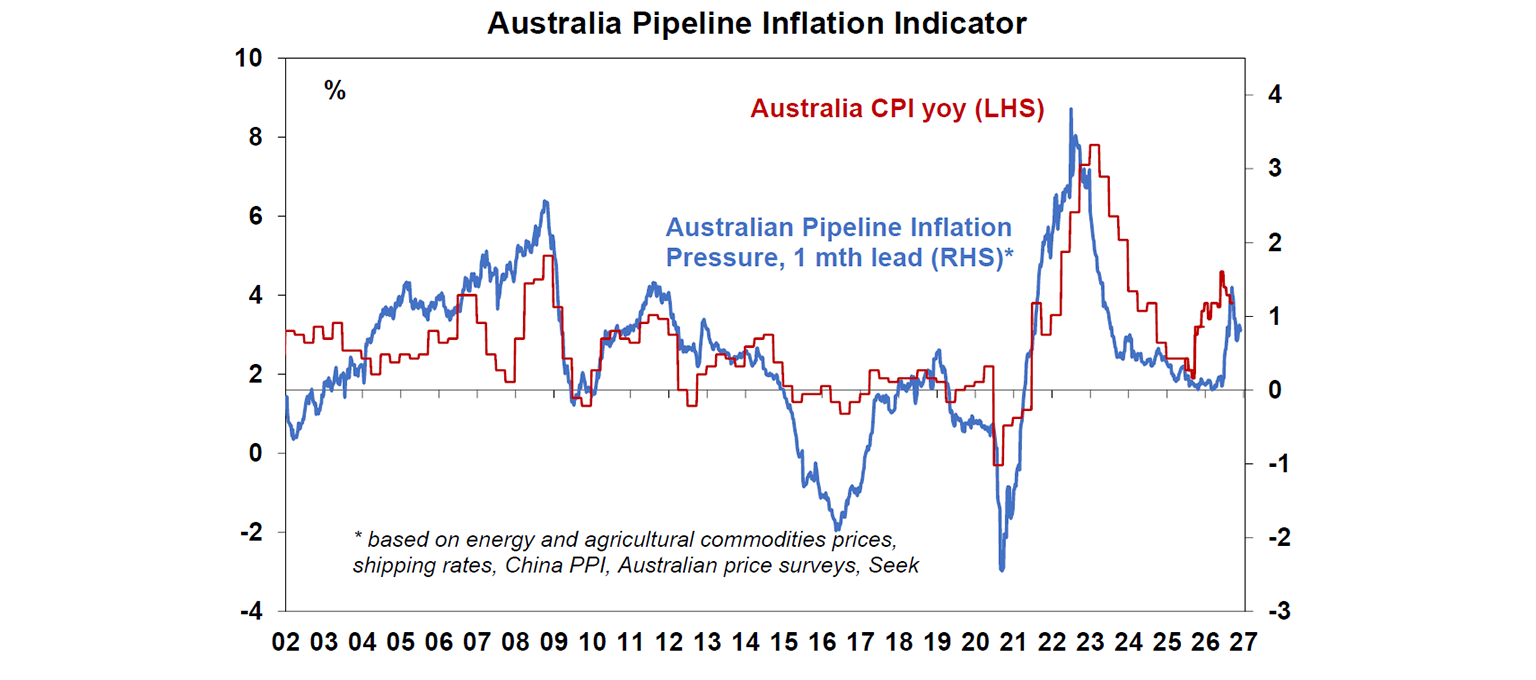
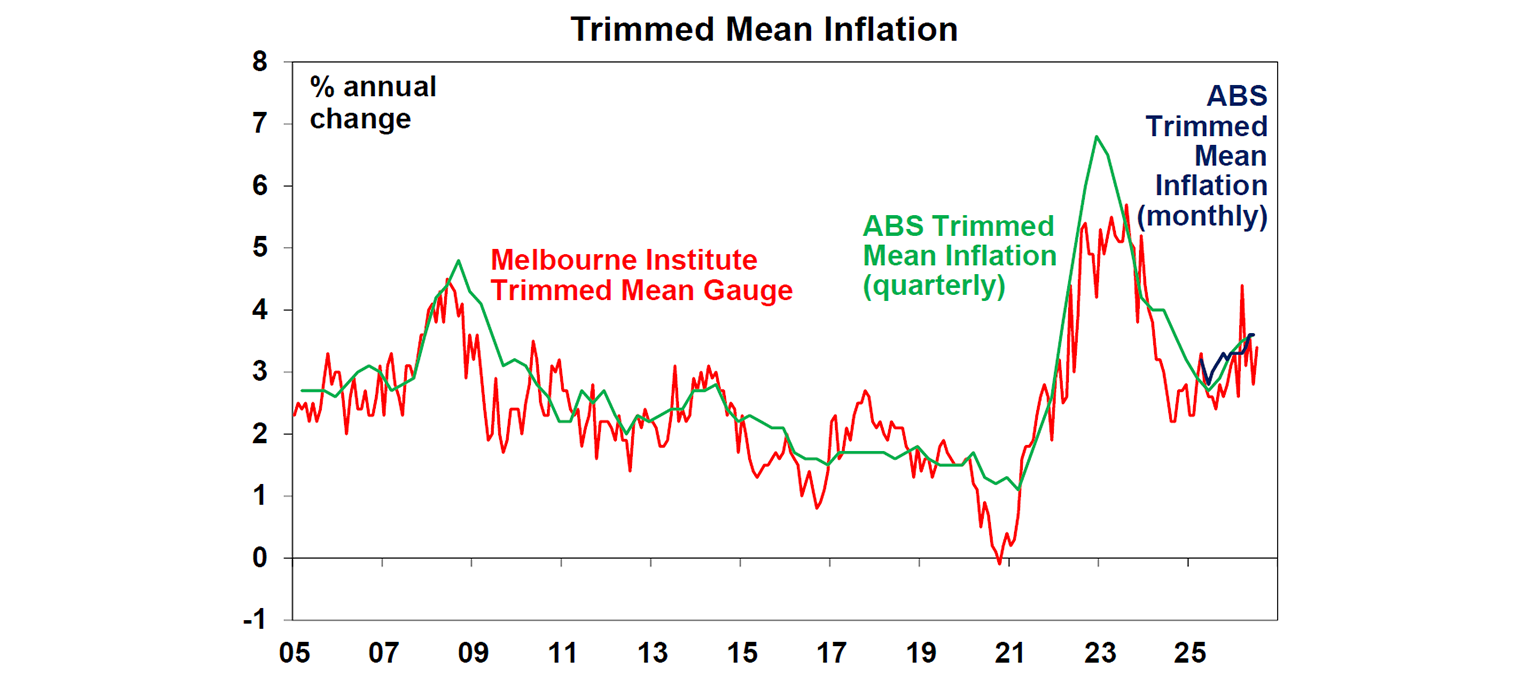
The RBA will likely revise down their inflation forecast next week and hold rates unchanged, but don’t expect this to be the end of the hiking cycle. With headline inflation for the second quarter coming in significantly lower than previously expected (4.0%yoy versus 4.8% forecast by the RBA in May) while the labour market looks weaker (unemployment rate averaging 4.4% vs RBA’s 4.2% forecast), the Reserve Bank certainly has space to hold rates constant for now to further assess the impact of the three rate hikes so far (they impact the economy with a lag!). However, the RBA will retain a hawkish bias, and we see a high chance of one more hike in November especially if the quarterly trimmed mean for 3Q comes out to be 0.8%qoq or higher. Specifically, trimmed mean momentum hasn’t trend down at all in the past two months (and 3.6% annual reading is too far from the 2.5% target), consumer spending is still very solid (see the Australian data section below), wage pressures remained high, and now that the fuel excise is fully reinstated, we think there is more room for businesses to pass through their costs to consumers with “fuel surcharges”! In fact, our pipeline pressure indicator remains elevated around the same levels as early 2023 (when the RBA was in the middle of hiking rates), despite having rolled over from oil price peak in May.
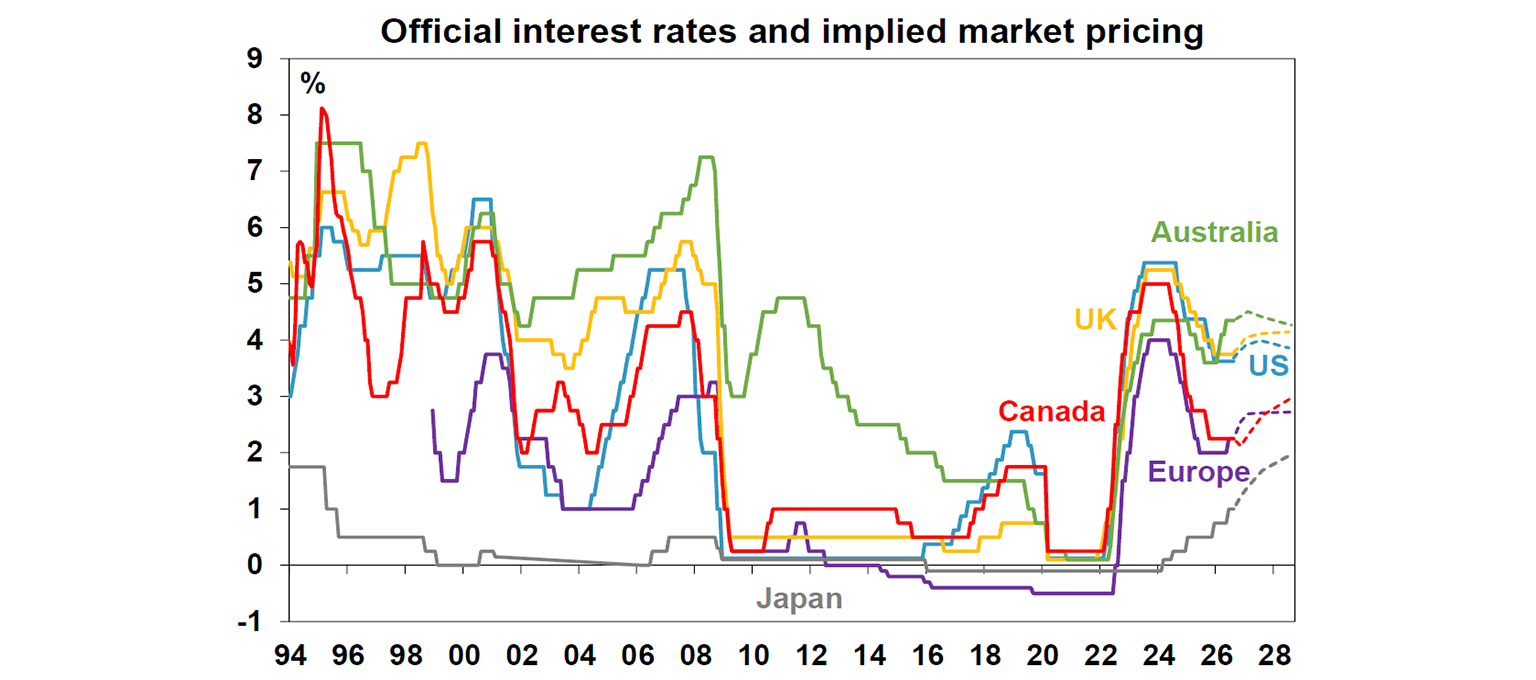
What’s going on with the Japanese yen? The JPY has been sliding since 2021 as Japan continued to experience lower inflation than other developed peers (with core inflation remaining at a meagre 1.2%yoy despite the energy shock this year), lower GDP growth (at just 0.4%yoy for the March quarter), years of low inflation mindset, and as a result, much lower cash rates than other developed economies. Even with the latest rate hike, the BOJ cash rate remained at just 1% with one more 25bps hike priced in by the end of the year. High public debt (at more than 200% of GDP, compared to 128% in the US and ~33% in Australia) is another major factor behind the yen's weakness. More recently, rising commodity prices have worsened the trend, as Japan's overwhelming dependence on imported energy means the country has to pay for energy using more US dollars, reducing demand for yen, thus adding to the downward pressure already coming from low inflation, low interest rates and high government debt.
Donald Trump clearly doesn’t like this, prompting US intervention to support the yen which was summed up by my favourite picture of the week: Treasury Secretary Scott Bessent’s notepad, captured by Reuters, reading “To Do Buy Japanese Yen (JPY) $5–10 bil”. This is because Japan is a major holder of US Treasuries, so large-scale selling of US assets could push up US debt servicing costs (which have already trended up consistently since the Iran War – see the chart below). Trump has also argued that a weaker yen gives Japan an unfair trade advantage, with Japan accounting for 4% of US imports and ranking as its sixth-largest import source.
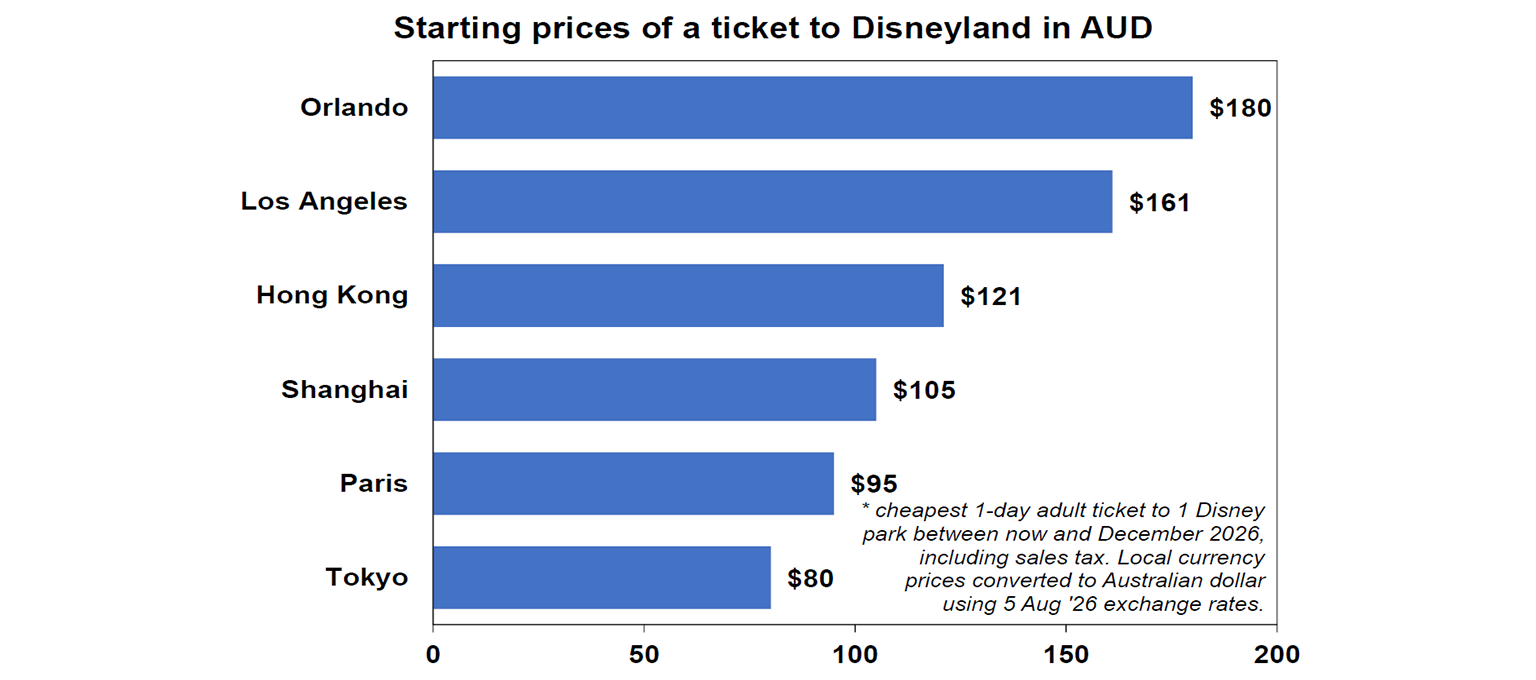
Even if commodity prices could ease if a sustainable Iran deal is reached and Japan’s wages costs have been picking up lately, the country’s weaker fundamentals and low inflation are long-term issues, so BOJ rates will only rise to around 1.5% by the end of the year. Meanwhile, the Fed is also still likely to raise rates further and we think the yen could stay weak in the next few months. This is also reflected in my own Disneyland index (arguably a much better measure than the Big Mac index), which compares starting prices for a one-day adult ticket at Disney parks: Tokyo still looks very attractive at around A$80 a day, compared with A$95 in Paris, A$105 in Shanghai, A$121 in Hong Kong, A$161 in Los Angeles and an eye-watering A$180 in Orlando.
Major global economic events and implications
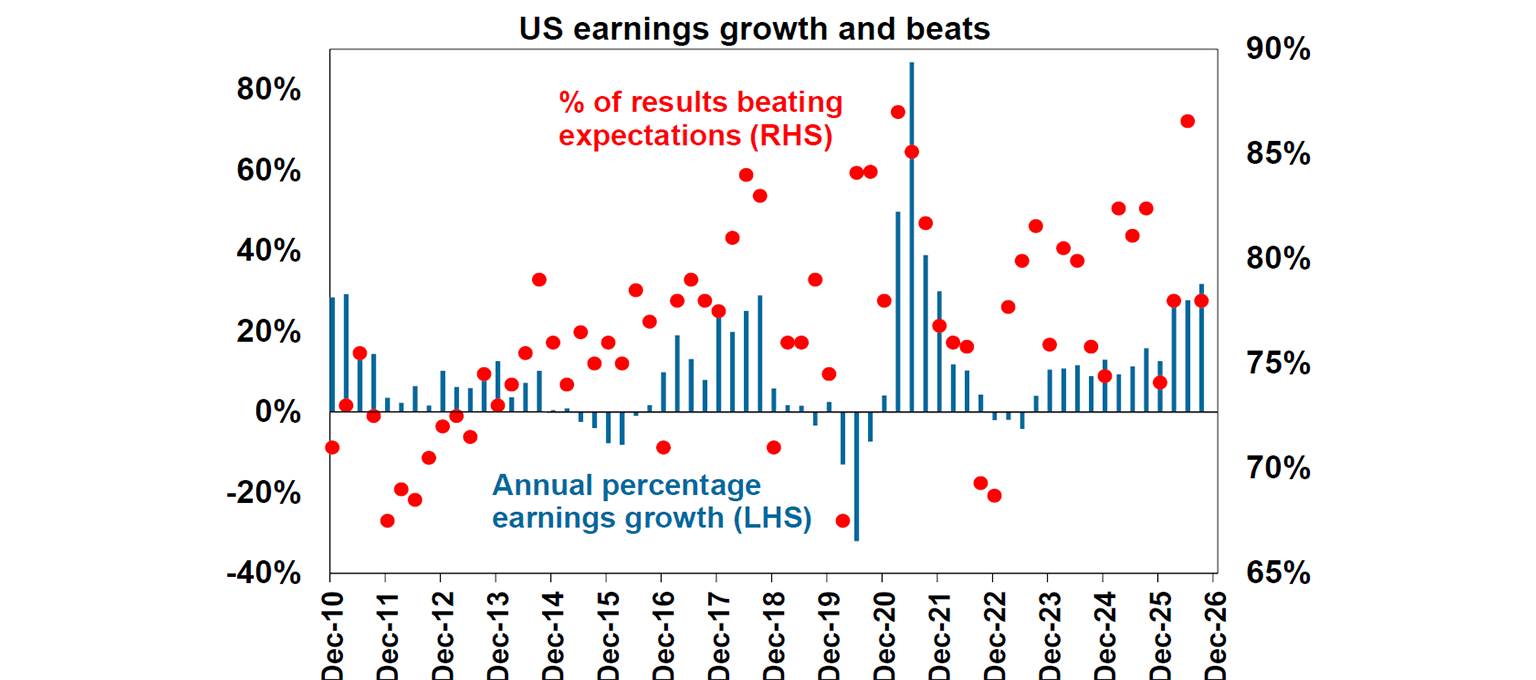
73% of the US S&P 500 companies have reported with 78% of them beating expectations, while earnings growth projection remained very solid at 31.8%yoy. Unsurprisingly tech earnings projection is a whopping 49.1% annual growth so far, but energy is the real outperformer at 135%yoy given elevated commodity prices.
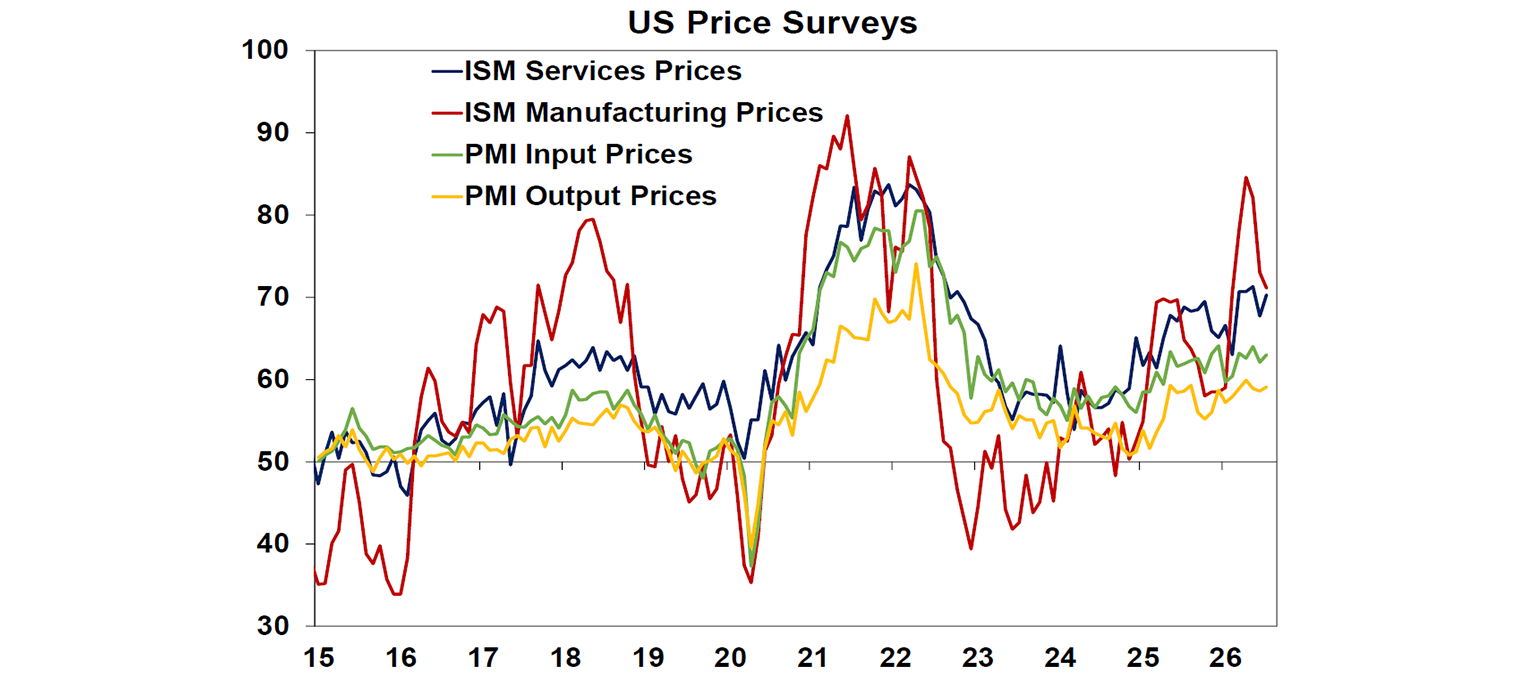
Both manufacturing and services ISM surveys for July continued to show strong cyclical momentum in the US economy. Both indices rose over the month to 55.6 and 54.1, respectively, pushed up by new orders, production/business activity, and suppliers’ deliveries; while employment surveys remained softer below 50, the neutral level. Price pressures also eased a bit over the month (though the level remained quite elevated).
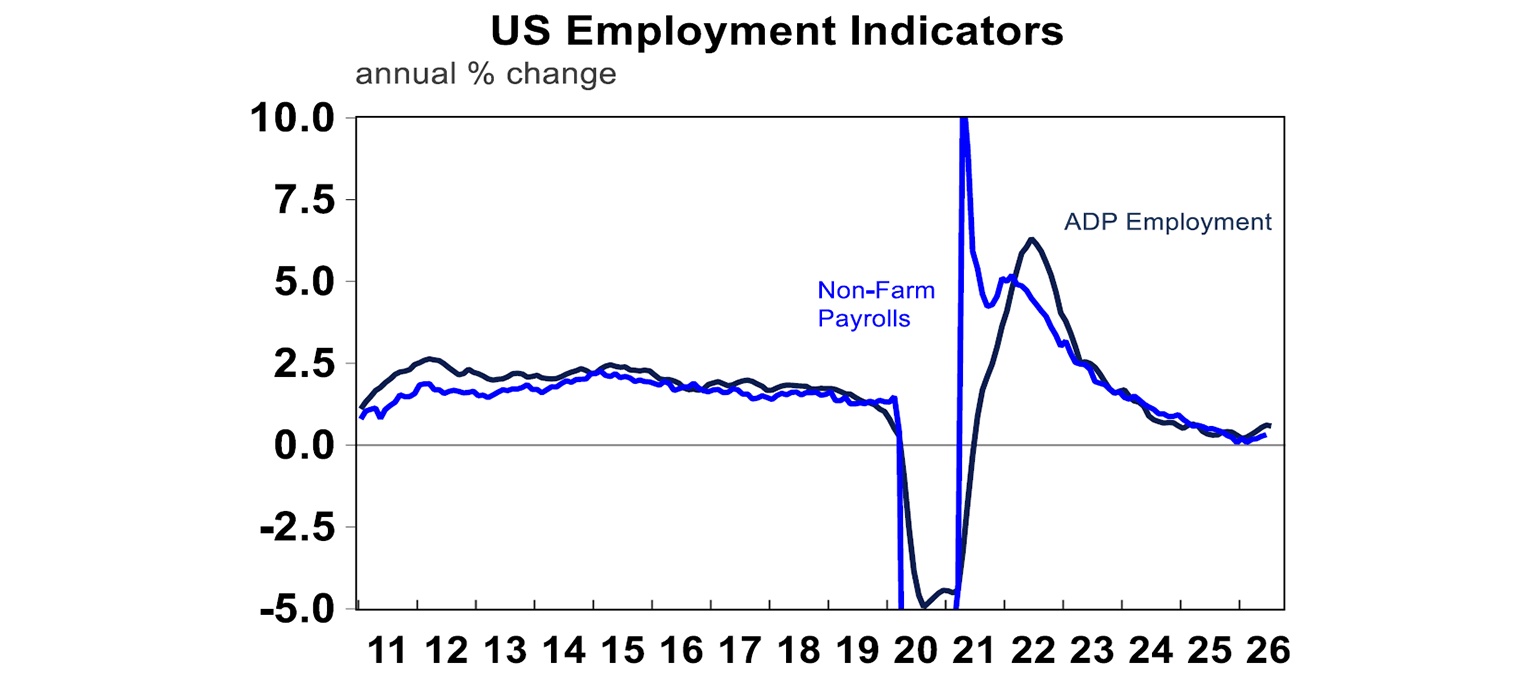
US jobs growth was much softer than as expected, with official nonfarm payrolls falling by 23k (expectations were for a 80k rise). But declines were concentrated in retail (-19k) and hospitality (-40k), likely related to the end of big events including the World Cup and America’s 250th celebrations. Note that the annual trend has been picking up since the beginning of this year and the unemployment rate fell over the month to just 4.1%,…
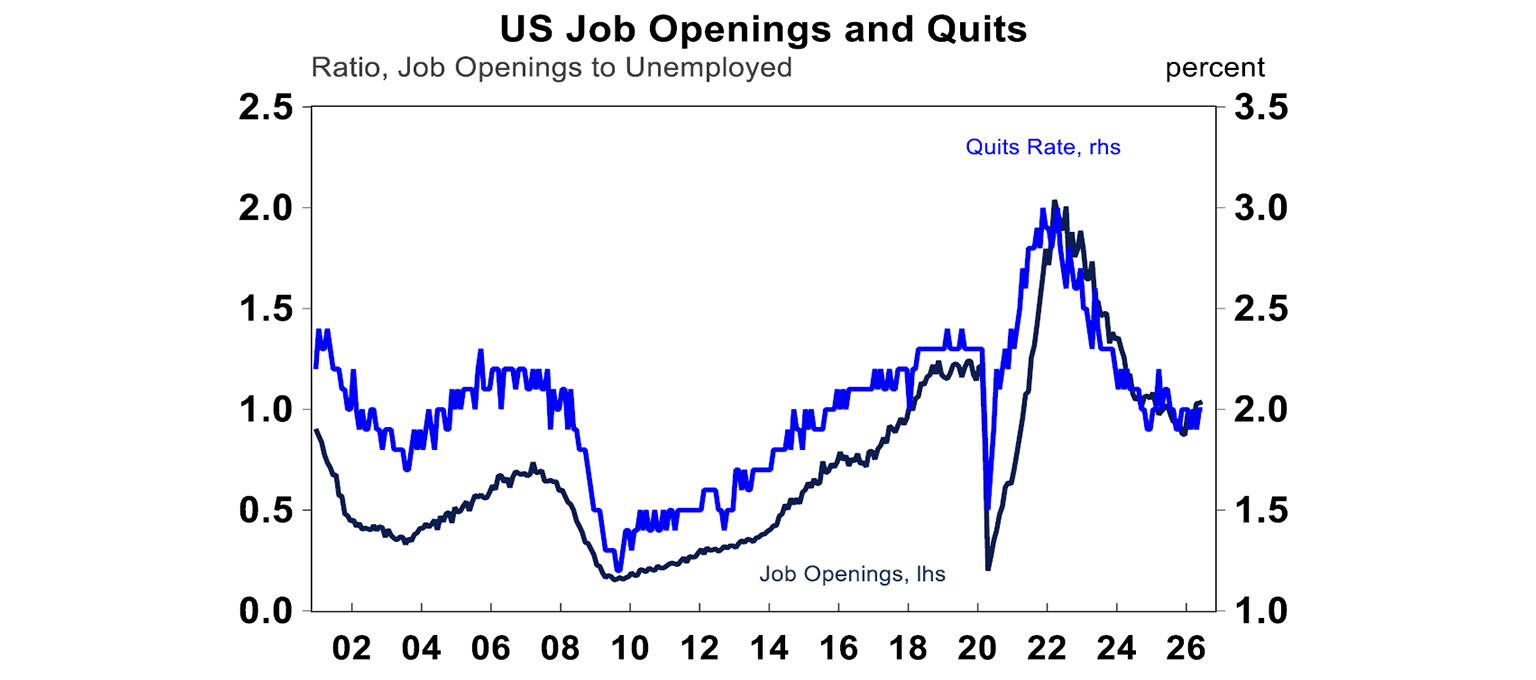
…which is similar to labour market readings from the Jobs Openings report. Job openings to unemployment ticked up above 1 (meaning there is more than one job for every unemployed person), while quits rate remained stable at 2% in recent months.
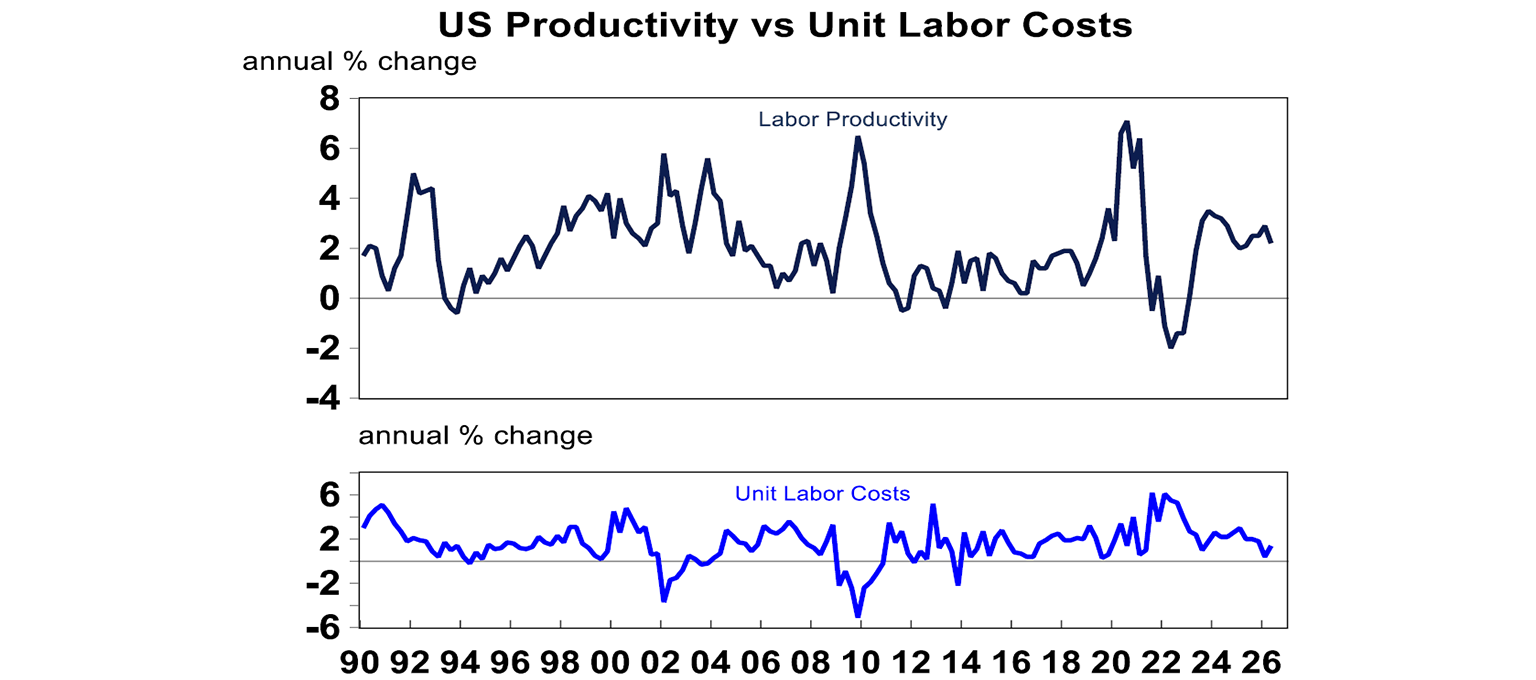
As a whole, US economic data for the week pointed to goldilocks conditions where growth is still strong driven by solid productivity and the labour market is okay but not heating up too much to feed into “sticky” inflation. Q2 nonfarm productivity rose by 1.4% on an annualised basis (much higher than 0.6% expected, while Q1 figures were significantly revised upward to 0.8% from 0.3%). Meanwhile, unit labour costs (aka compensation for employees per unit of output) were stable at 1.3%yoy, lower than 2.3% forecast by economists. These prints lower the pressure on the Fed to tighten rates immediately and market probability for a September hike fell significantly to just 56% this week from 72% last week.
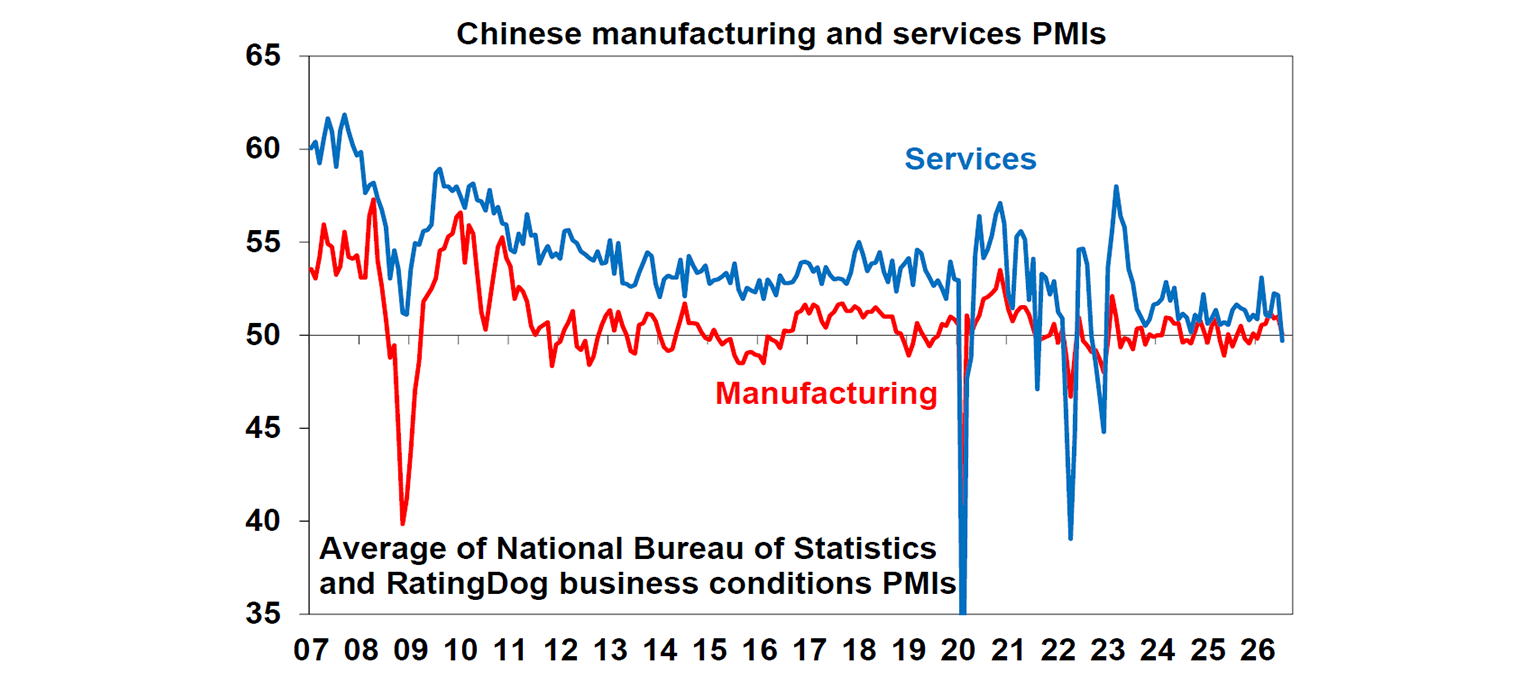
By contrast, China’s purchasing managers’ surveys were weak, with the National Bureau of Statistics’ measures, which cover larger and state-owned firms, falling into contractionary territory below 50. The RatingDog surveys, which focus more on smaller, export-oriented firms, remained above the neutral 50 mark but also softened through July. Overall, the surveys point to weaker domestic growth relative to external demand and we expect some stimulus to restart in the coming months.
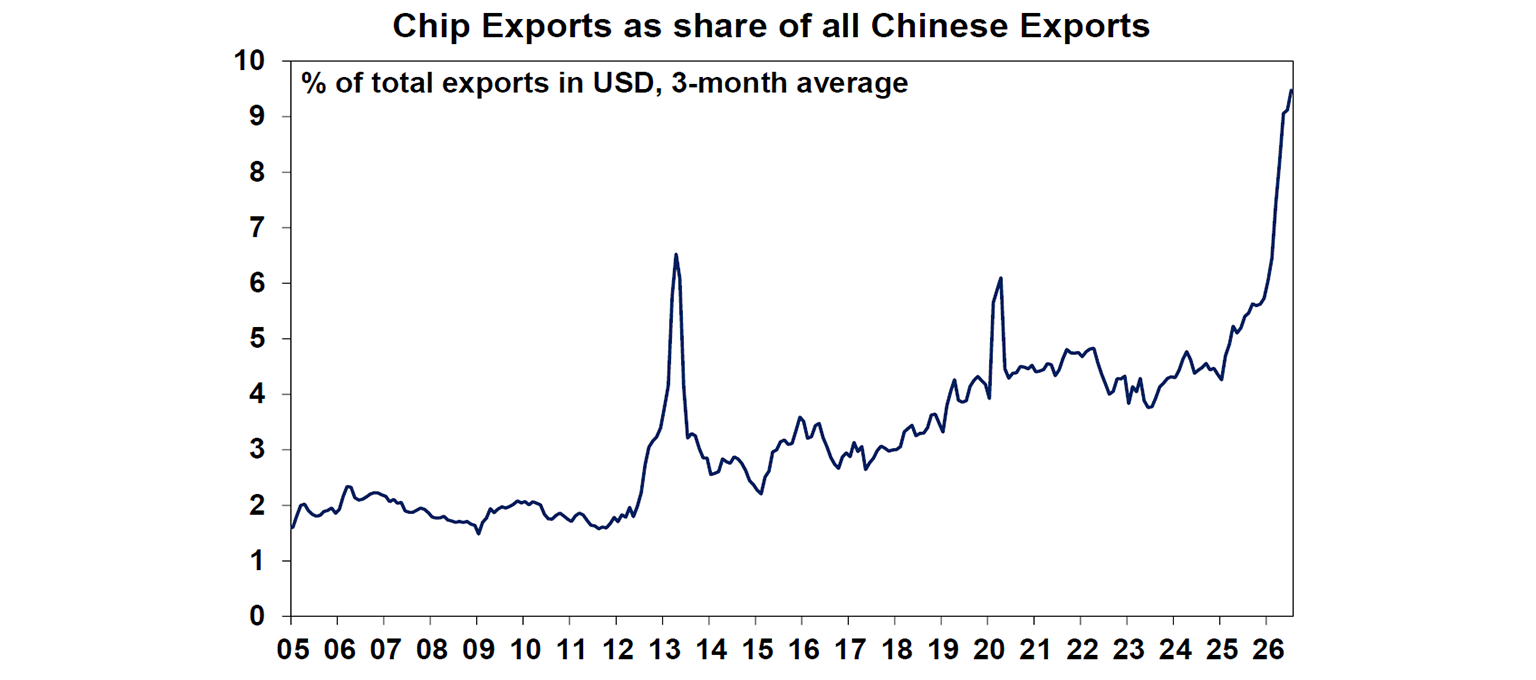
Strong global demand was confirmed by Chinese trade data for July. Exports rose by 23.9% over the year while imports also rose 27%. Exports have been driven by chips, batteries, and other high-tech products.
Australian economic events and implications
The Australian 1H earnings season has started with only 15 companies in the ASX 200 reporting this week so far – usually companies with good results report earlier so take the results this week with a grain of salt. Consensus expectations are for profits to be the strongest in four years at 12% annual growth rate, but profits are likely concentrated in mining (from higher commodity prices and booming AI capex) and financial services (from higher deal activities and favourable operating conditions in the past year). But looking forward, rate hikes will bite with slower consumer spending and declining housing momentum in the second half, so profits growth will slow from here especially for banks, consumer discretionary, and real estate.
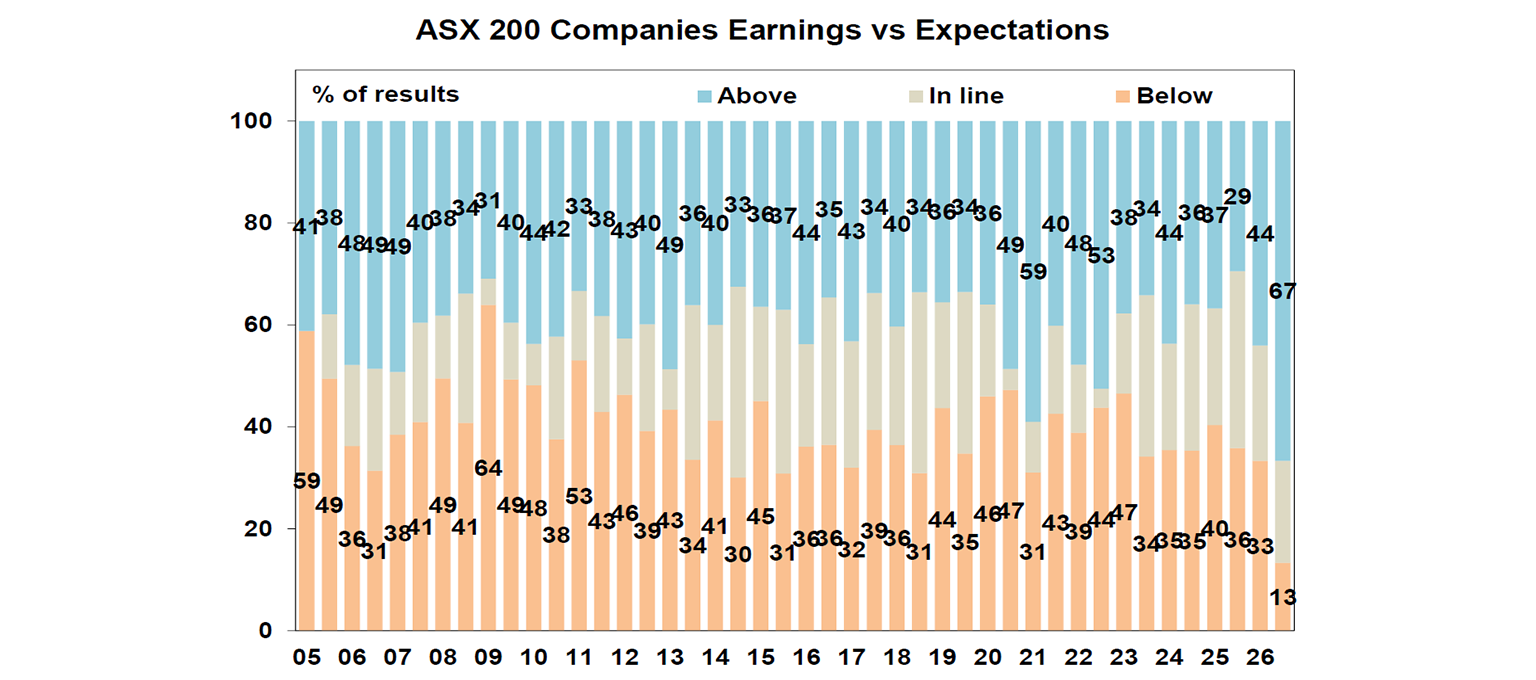
So far, 67% of results surprised expectations on the upside while only 13% underwhelmed, much better than the historical average of around 40% each. But remember that it’s still early days!
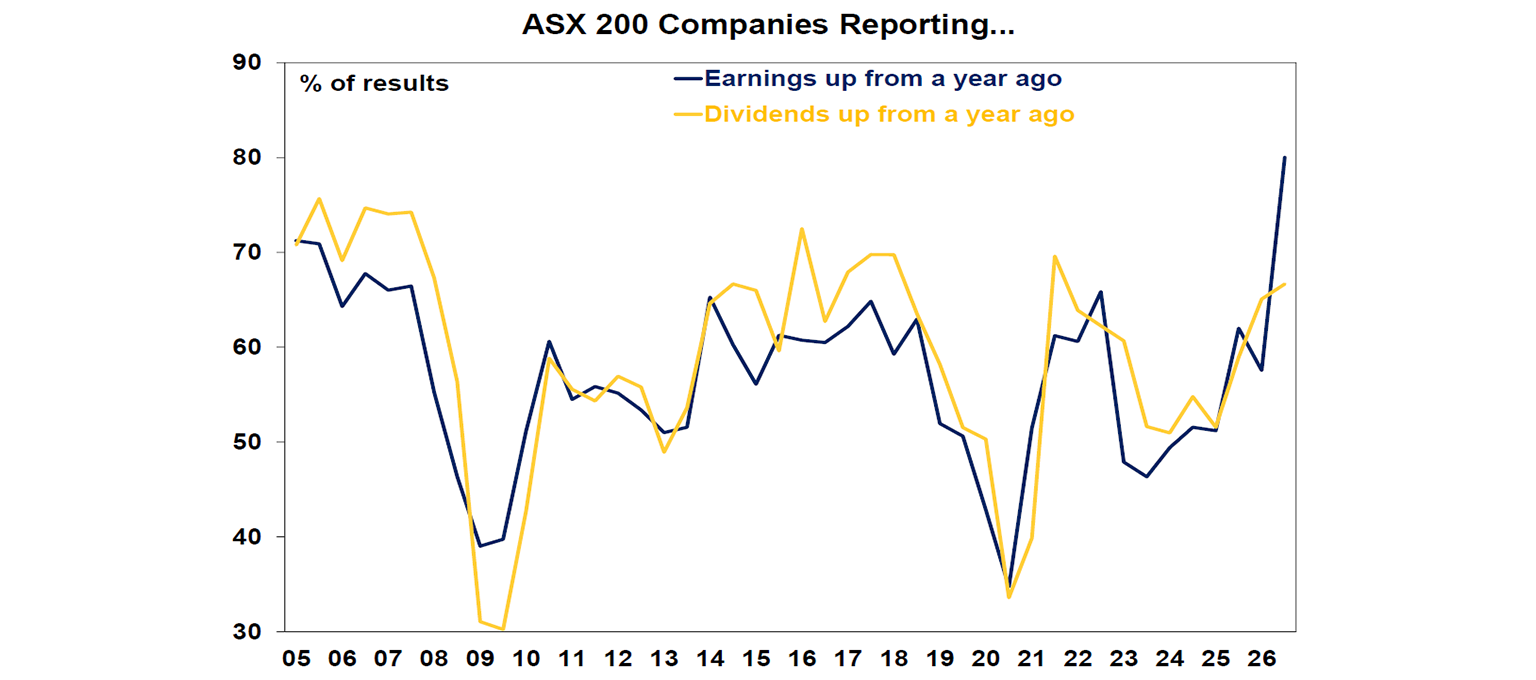
67% of companies have increased their dividends this earnings season, the highest since 2021, which is a good sign as it shows that companies have confidence in their cash flows to do so! But it’s lower than the percentage of reported companies which have seen historical earnings rise at 80%.
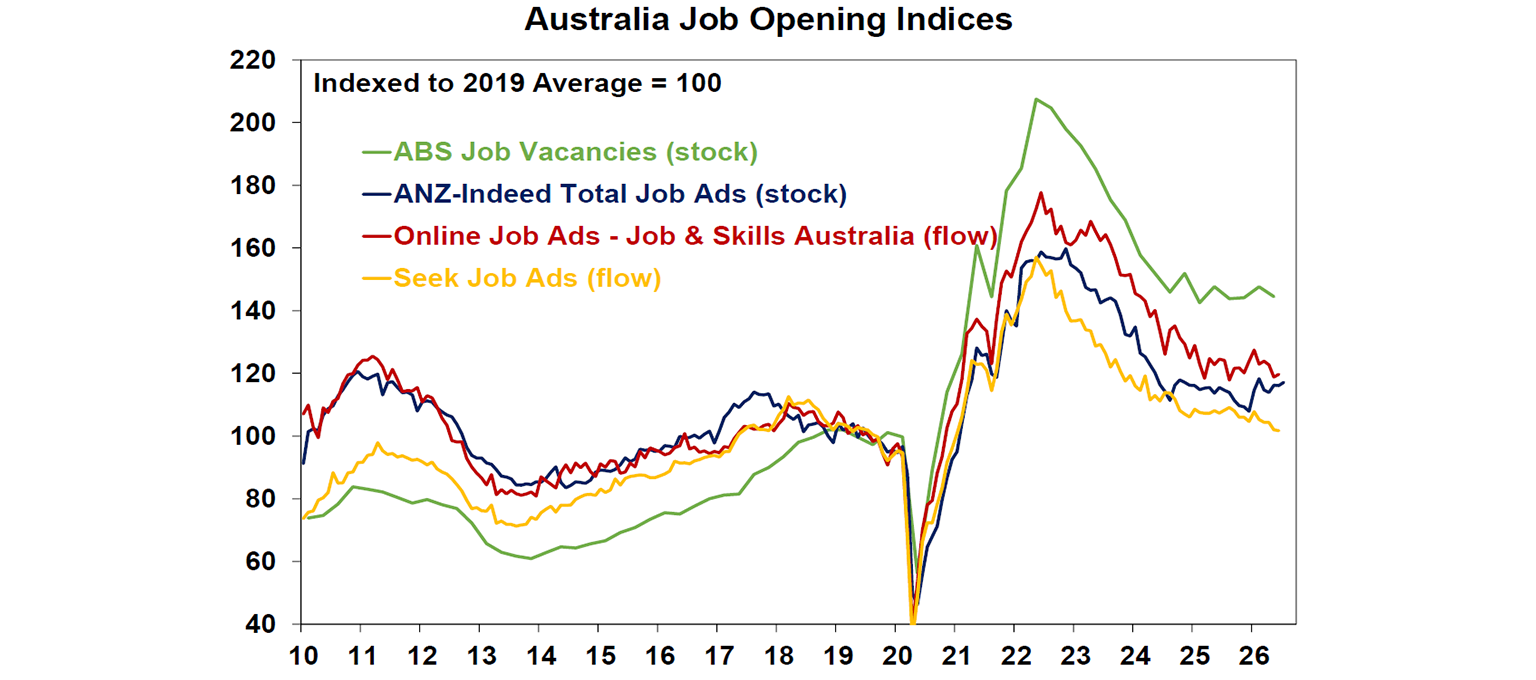
ANZ-Indeed job advertisements have been steadily rising since April (blue line below). Job ads rose another 0.8% in July and are now 1.9% higher over the year, pushing back against concerns that a slightly higher unemployment rate signals a rapid weakening in the labour market. High-frequency jobs indicators are now mixed, but the stabilisation in the ANZ-Indeed index lines up with Michelle Bullock’s recent comments that some firms have resumed hiring after the initial concerns around the Middle East war.
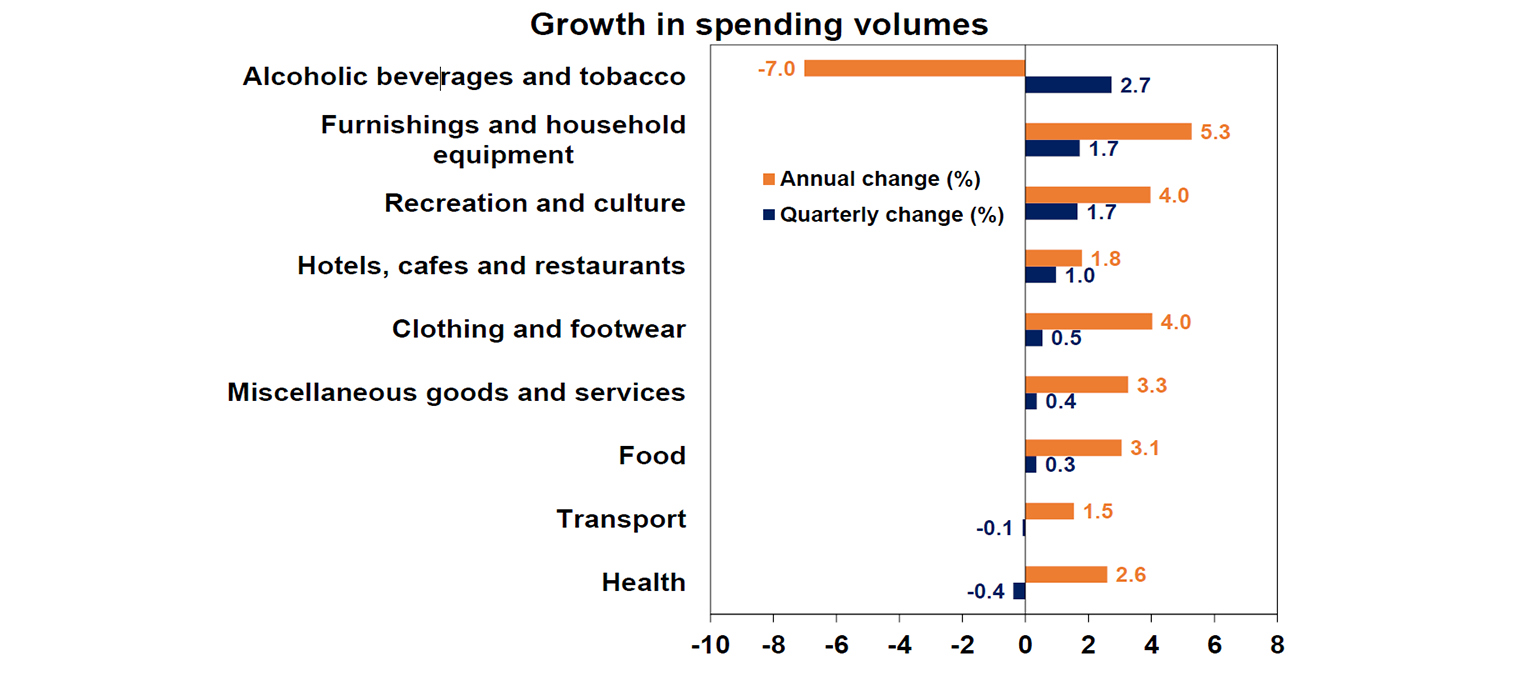
Household spending in Australia was remarkably strong – so much for the cost-of-living crisis!? Nominal spending rose 0.8% in June and 6.0% over the year, partly fuelled by households buying EVs, which were, in turn, fuelled by fuel shortage concerns! But even in volume terms, the spending indicator was up by a strong 0.7% through the June quarter (or 2.4%yoy), concentrated in discretionary spending including electronic equipment, recreation and cultural events, hotels and restaurants, and clothing. Clearly the three rate hikes haven’t yet materially dampened aggregate demand, which makes it easier for businesses to pass through any input price hikes in the next quarter.
The Melbourne Institute trimmed mean inflation gauge remained high at 3.4%yoy in July. It’s not too different from the official monthly trimmed mean figure in the second quarter, where inflation came in below forecasts but hasn’t decisively trended down either. In other words, it is too high versus the 2.5% target.
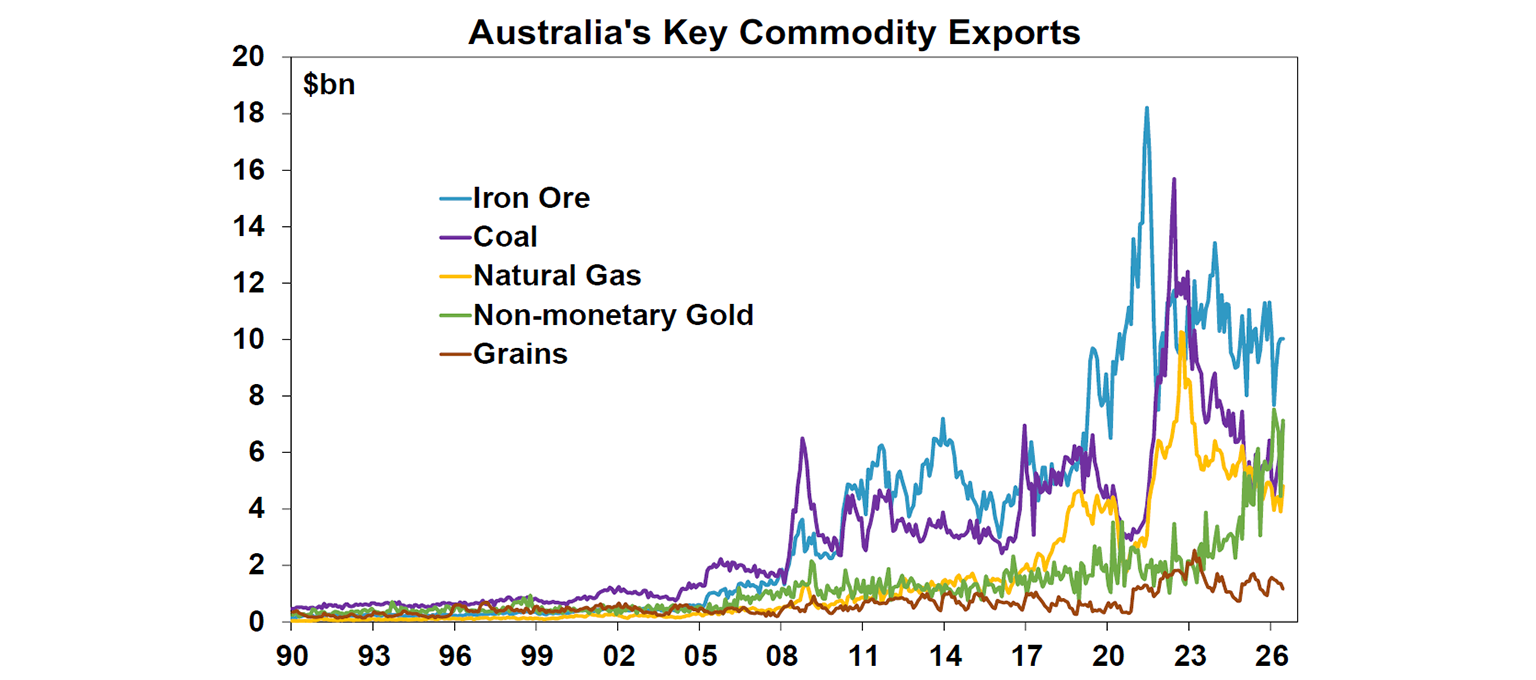
Australian trade balance tipped back into surplus of $1.9bn in June (from -$1bn prior), thanks to large jumps in commodity revenues. Imports dipped slightly by 0.2% over the month, while exports rose 9.6%mom thanks to non-monetary gold (+60%), gas (+23%), and coal (+15%). Nominal trade data has been volatile, but large imports of cars and data processing equipment this quarter points to a flat to slightly negative contribution from net exports volume to GDP.
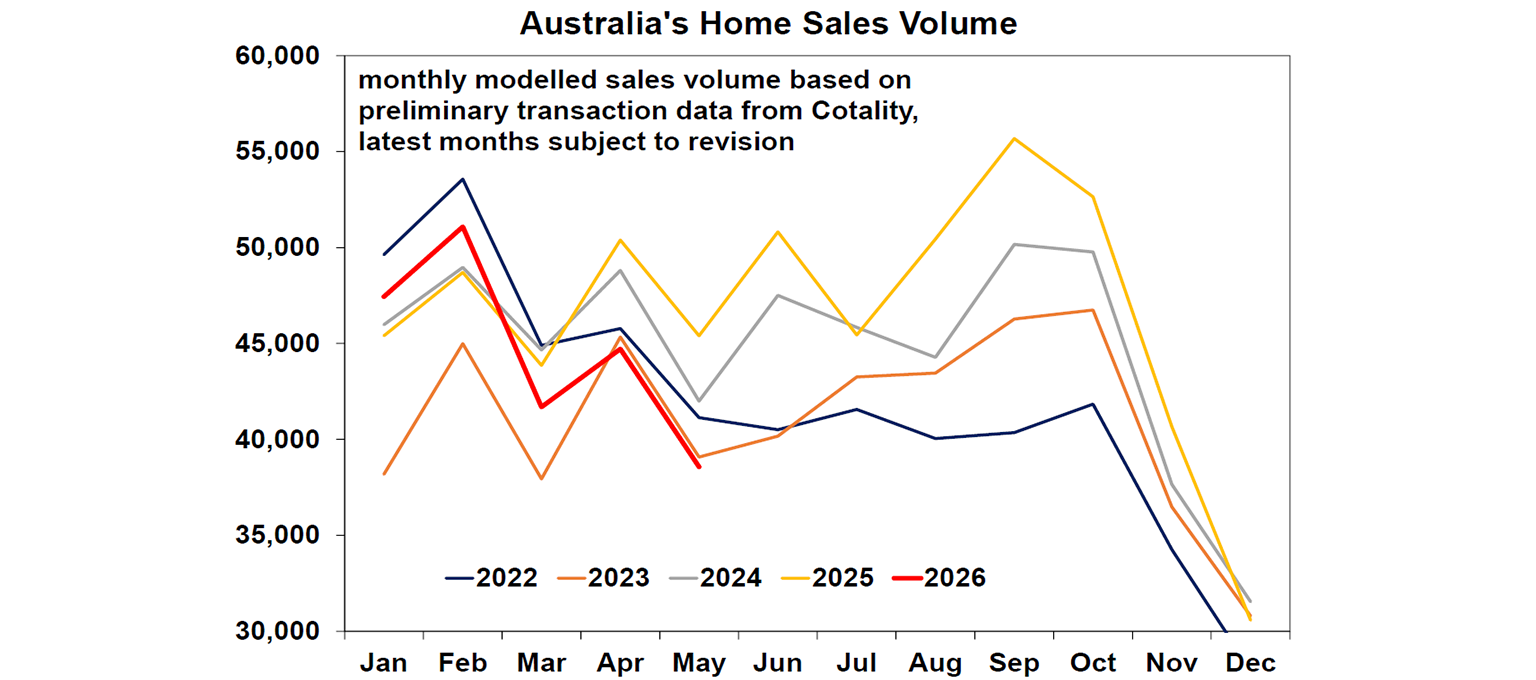
Australia’s home price downturn deepened in July, with prices now around 2% below their peak while Sydney and Melbourne have seen larger falls around 5–6%. National prices fell 0.7% in this month, and we expect further weakness given the double whammy of rate hikes and investor tax changes. Home sales volumes have unsurprisingly trended lower, similar to levels seen during the 2022-23 downturn. By next year, national prices are expected to fall around 7% before rebounding as monetary policy eases in the second half of 2027 and the structural supply shortage remains.
What to watch over the next week?
US inflation data for July is out Tuesday which covers the period when oil prices rebounded after the collapse of the June MOU. Headline CPI is expected to increase by 0.2% over the month and 3.5% over the year, driven by gasoline prices. Core measure is also expected to remain steady at 0.2%mom or 2.5%yoy, but any upside surprise will tilt the Fed towards a hike in the next meeting. Retail sales on Thursday will likely show consumer spending continuing to pick up on a nominal basis (+0.3%mom), and a suite of high frequency housing indicators (existing home sales & mortgage applications) together with UMich consumer sentiment will be consistent with a still resilient economy.
In Australia, the RBA will likely hold rates unchanged but keep a hawkish tone on Tuesday (see the preview above). Expect the NAB Business confidence (also Tuesday) to hover around neutral as rate hikes dampen sentiment but strong consumer spending will likely keep conditions steady. New housing loan commitment data for the June quarter on Friday will soften slightly (-1%qoq) as home sales volume declined in recent months.
UK GDP (Thursday) is expected to expand by 0.4% in 2Q, but annual growth will remain soft at 1.1%.
Outlook for investment markets
Global and Australian share markets are likely to remain volatile with the risk of another correction given the resumption of the Iran War and surging oil prices, stretched valuations, sticky inflation, political uncertainty associated with Trump & the midterm elections and worries about the impact of AI and whether there is an AI bubble. However, returns should still be okay for the next 12 months as a whole thanks to continuing economic growth with recession avoided and solid profit growth.
Bonds are likely to see returns around running yield or a bit less.
Unlisted commercial property returns are likely to be solid helped by strong demand for industrial property associated with data centres.
Australian home prices are expected to fall around 7% top to bottom, of which they have already done around 2%, out to the June quarter next year as a result of poor affordability, RBA rate hikes, reduced investor demand flowing from the winding back of negative gearing and the capital gains tax discount and poor confidence.
Cash and bank deposits are expected to provide returns around 4-5%.
The $A is likely to rise reflecting the wider interest rate differential to the US, although a move to Fed hikes may limit this. Fair value for the $A is around $US0.72.
My Bui,
Economist, AMP


You may also like
-

What are AI shopping agents, and are they safe to use As agentic commerce agents become an increasingly common way to shop, learn the risks that may come with them, and some ways to use them more safely. -

Weekly Market Update - 02-10-2026 - AMP -

Weekly market update - 25-09-2026 Global share markets mostly rose over the last week helped by strong US economic data, a return of AI optimism and renewed hopes for a diplomatic solution to the Strait of Hormuz blockage.
Important information
Any advice and information is provided by AWM Services Pty Ltd ABN 15 139 353 496, AFSL No. 366121 (AWM Services) and is general in nature. It hasn’t taken your financial or personal circumstances into account. Taxation issues are complex. You should seek professional advice before deciding to act on any information in this article.
It’s important to consider your particular circumstances and read the relevant Product Disclosure Statement, Target Market Determination or Terms and Conditions, available from AMP at amp.com.au, or by calling 131 267, before deciding what’s right for you. The super coaching session is a super health check and is provided by AWM Services and is general advice only. It does not consider your personal circumstances.
You can read our Financial Services Guide online for information about our services, including the fees and other benefits that AMP companies and their representatives may receive in relation to products and services provided to you. You can also ask us for a hardcopy. All information on this website is subject to change without notice. AWM Services is part of the AMP group.