


Weekly market update
Investment markets and key developments
Over the past week, the US S&P500 gained 0.9%, even as technology stocks came under pressure mid-week following news that OpenAI was going to miss some financial targets.
22 min read

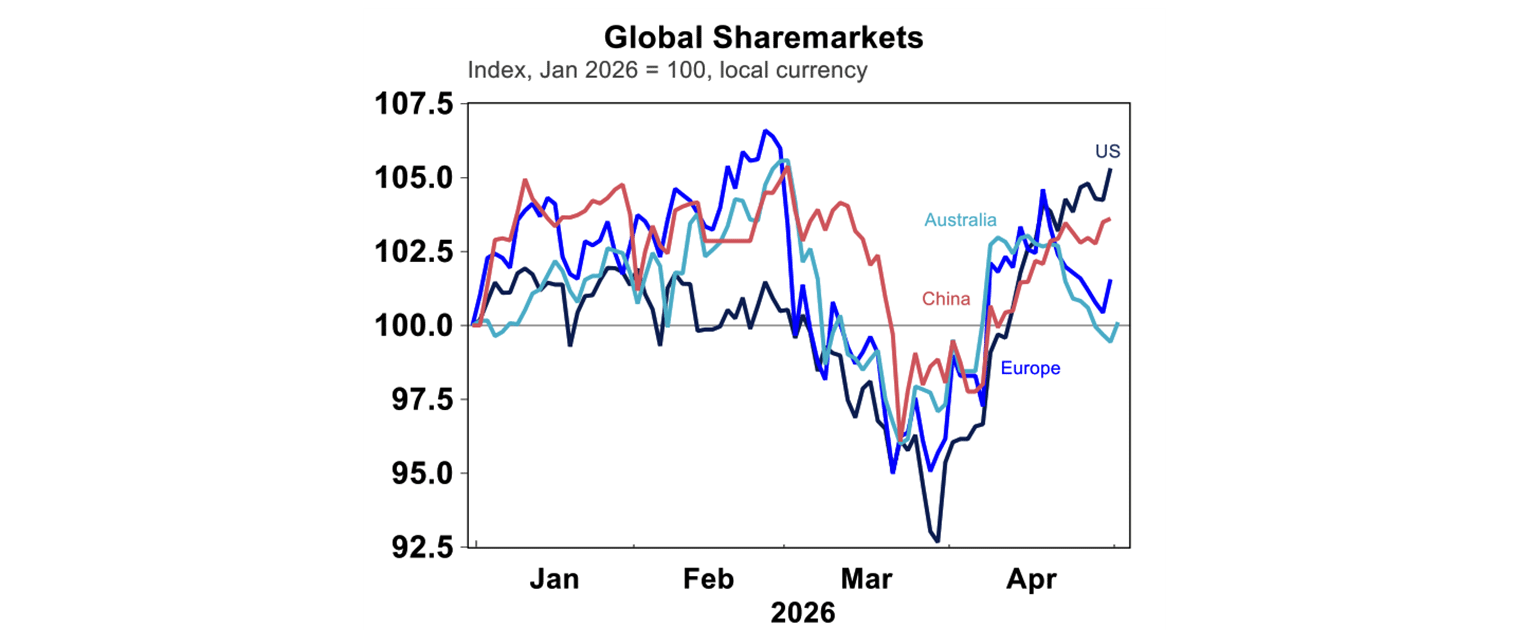
Solid economic data, enthusiasm around the AI‑driven growth outlook and strong earnings results pushed US equities higher this week, with the S&P 500 once again reaching a record high. The index rose more than 9% in April, rebounding sharply from a 5% decline in March and marking its strongest monthly performance since the Covid‑related sell‑off in 2020. This rally has occurred despite ongoing geopolitical tensions and no clear resolution to the US-Iran impasse.
Over the past week, the US S&P500 gained 0.9%, even as technology stocks came under pressure mid-week following news that OpenAI was going to miss some financial targets. The news weighed on the broader tech sector, including semiconductor stocks, highlighting the increasingly interwoven nature of the industry.
In contrast, Australian equities were down by 0.7% this week, with a decline in consumer staples, healthcare, utilities and tech. Energy stocks were the notable outperformer. Overall, US equities continue to outperform other major markets this year.
Why are markets so blasé about the war? There is clearly an expectation that some form of resolution will emerge, particularly as missile attacks have eased in recent weeks. However, we think markets are underestimating the risks - especially in the oil market.
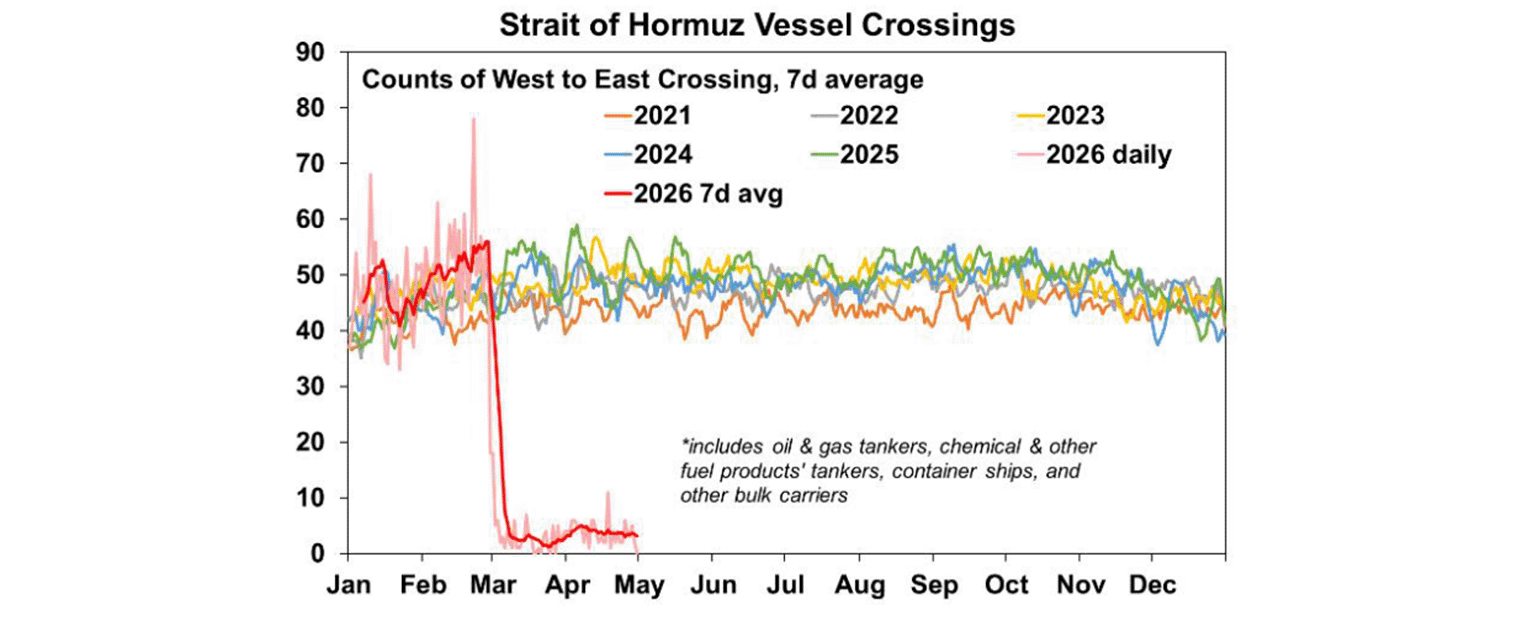
The Strait of Hormuz, a critical global chokepoint through which around 20% of the world’s oil supply normally flows, is effectively still closed. Oil prices remain roughly double their pre‑war levels, despite the relative calm in headline conflict. While there were some positive signs on negotiations earlier, talks now appear to have stalled, leaving the situation stuck in a geopolitical “no man’s land”.
Little traffic is currently moving through the Strait of Hormuz (see chart below), and the US blockade of Iranian ports remains in place - factors that continue to pose significant upside risks to energy prices, even if financial markets appear largely unfazed for now.
The US is pushing for an agreement that curbs Iran’s nuclear programme - something Iran is resisting - while Iran, for its part, wants the US blockade lifted as the economic costs begin to bite. It’s difficult to see how these competing objectives are resolved quickly.
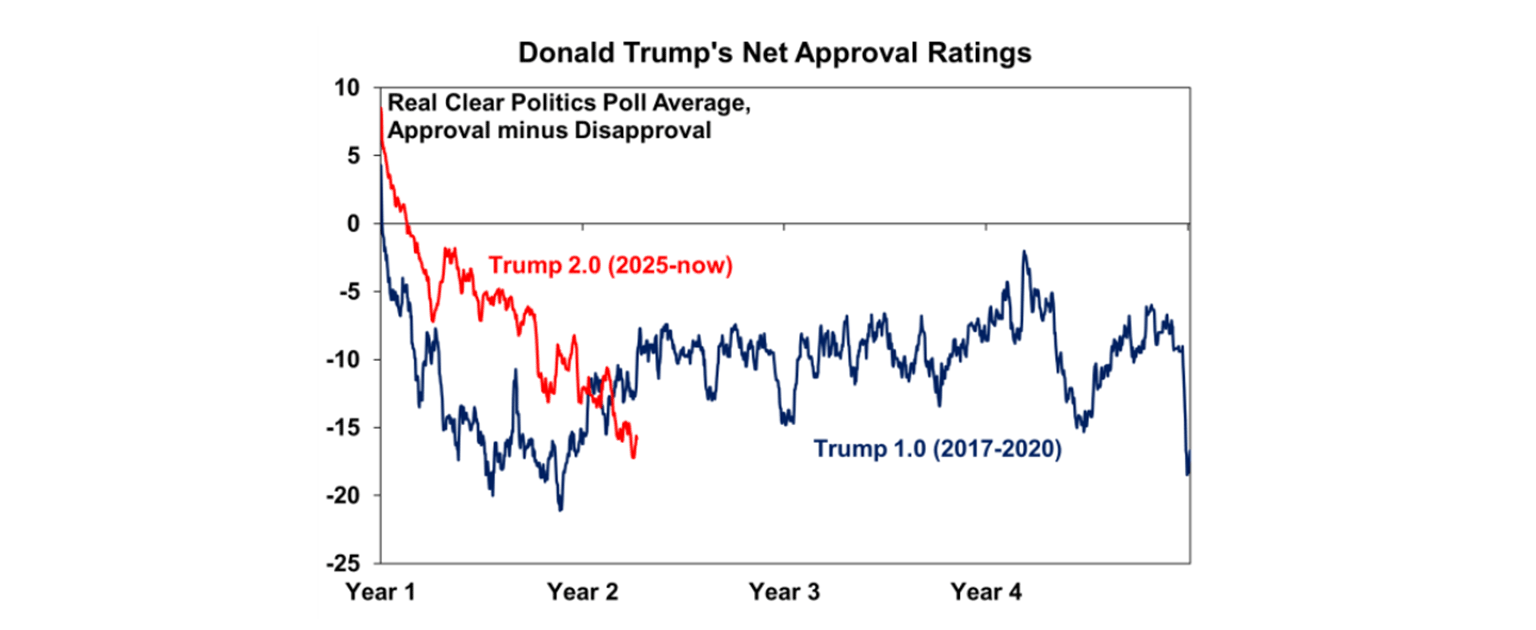
Perhaps more social media posts from Donald Trump will help. This week he shared an image of himself holding a weapon in front of a city being blown apart, captioned “No more Mr Nice Guy”. But tough rhetoric aside, Trump’s domestic approval ratings remain under pressure (see chart below), limiting how much political capital he has to escalate or de‑escalate the situation decisively.
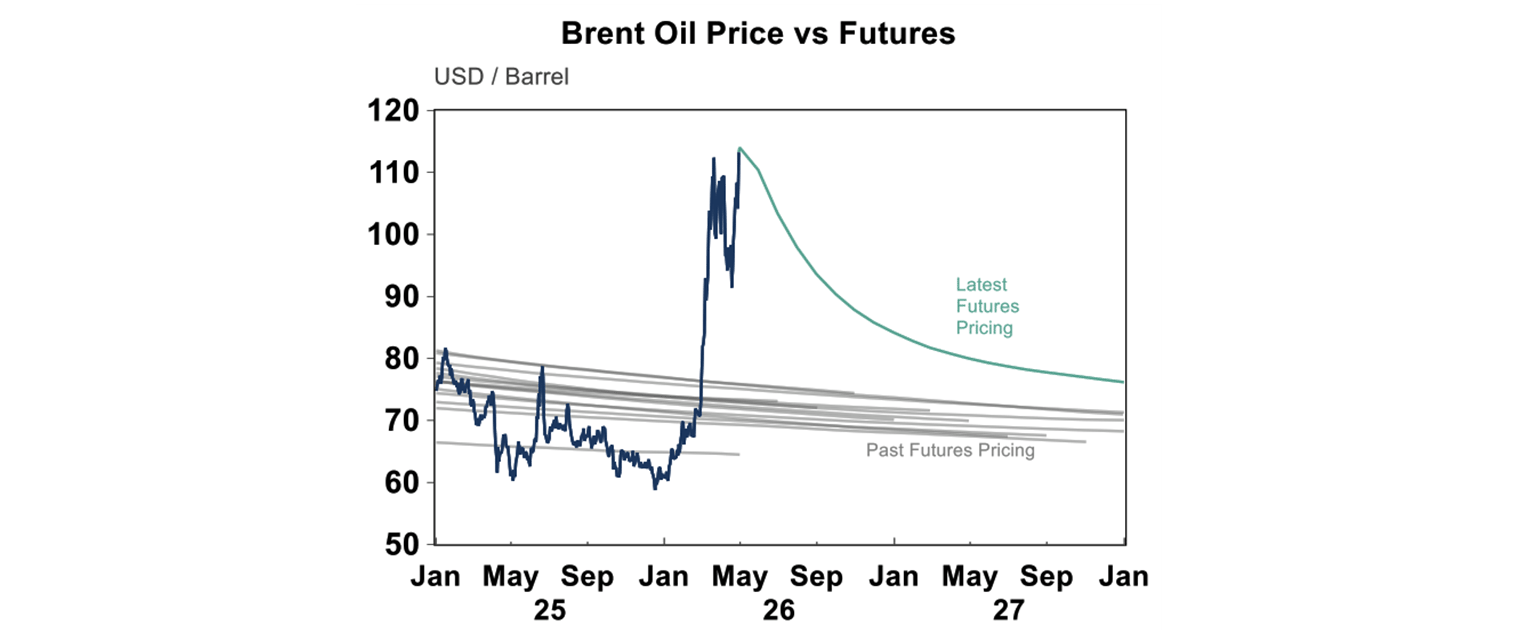
In any case, we are watching oil flows through the Strait of Hormuz very closely. Oil prices rose again this week, returning to their war‑time highs, with Brent trading above US$110 per barrel. This raises the risk that global sharemarkets could once again become unsettled in the coming weeks - as investors reassess the implications of higher oil prices for inflation and economic growth - potentially leading to a modest equity pull‑back.
That said, it is also difficult to be overly negative on the outlook. If markets were to sell off sharply, Trump would likely step back, lift the blockade and still declare victory. As a result, while near‑term volatility remains a risk, a more sustained downturn in markets is unlikely unless we see clearer signs that high energy prices are beginning to materially slow economic growth.
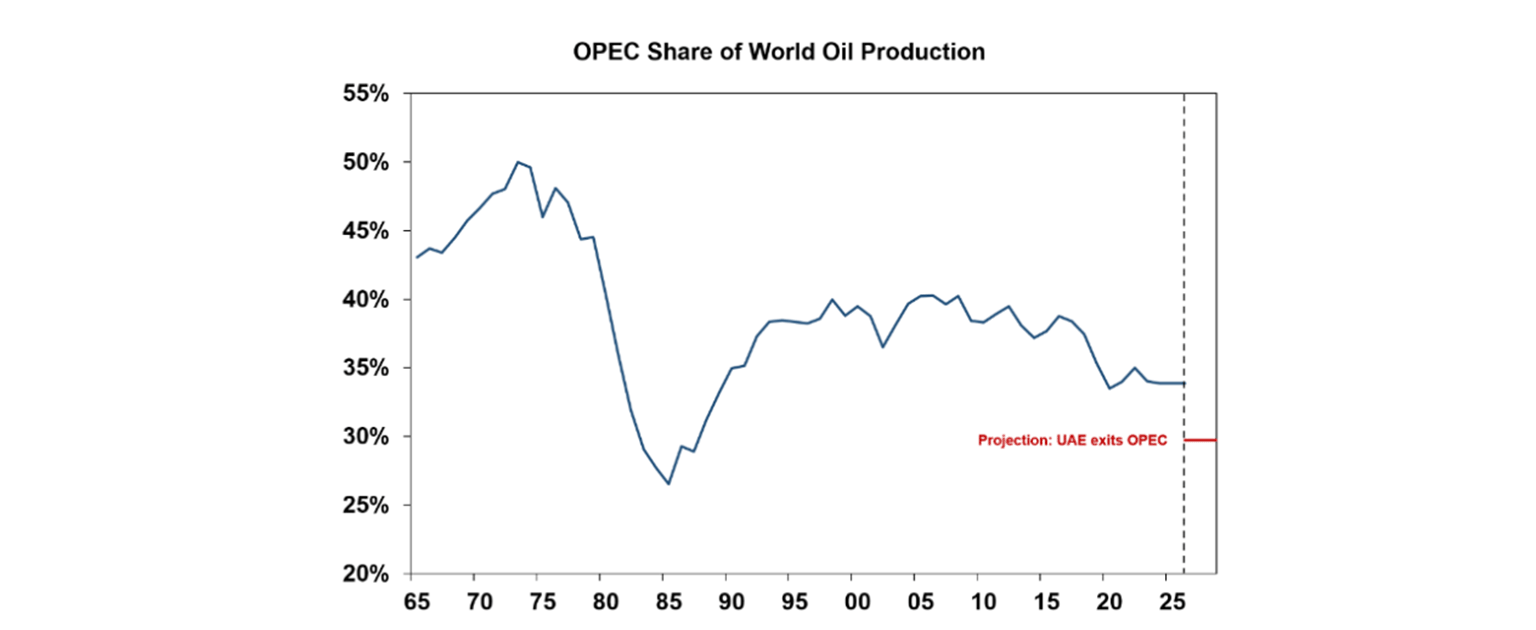
Another development in oil markets this week was news that the United Arab Emirates would be leaving the Organisation of the Petroleum Exporting Countries (OPEC), which is a group of oil-producing countries that control how much its members produce, to influence oil markets. It does this by setting production quotas to stabilise prices and ensure supply to consumers and reliable income sources for exporting nations.
OPEC controls around a third of global production (see the chart below), but this share has fallen over time as non-OPEC supply (mostly the US) has grown.
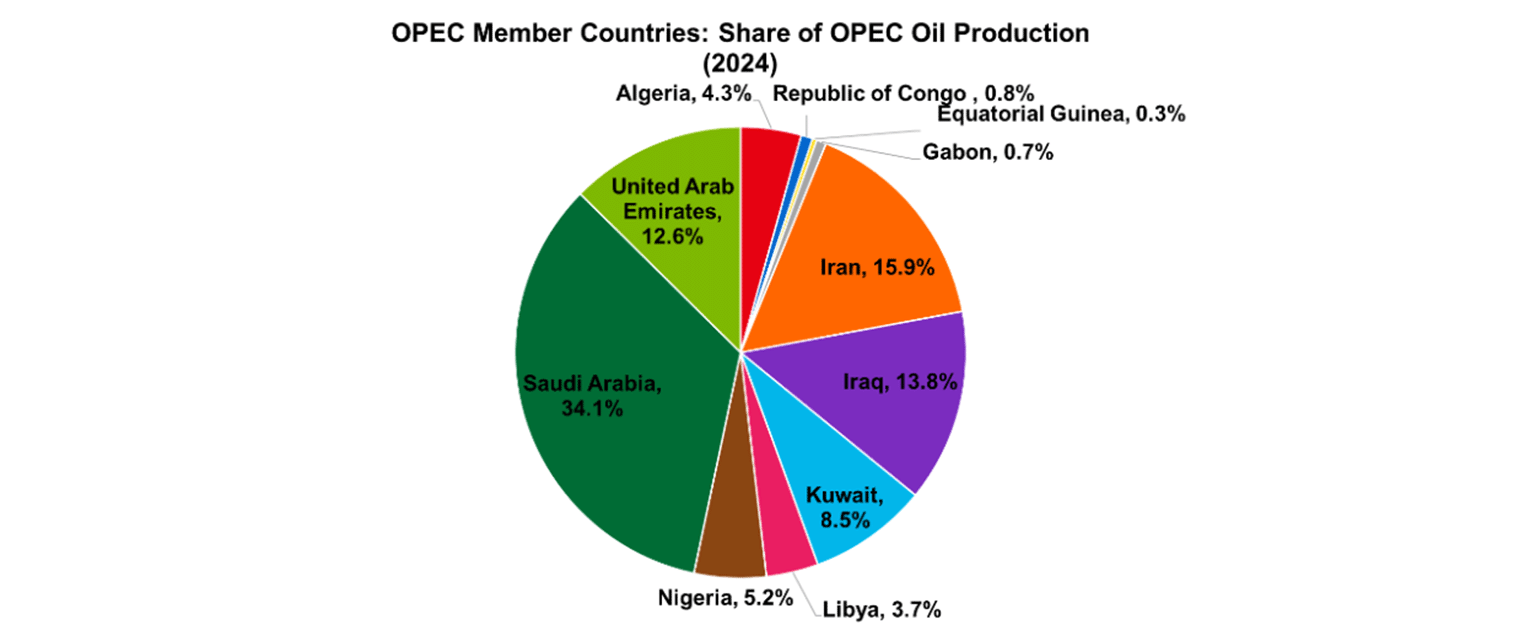
The UAE was the fourth‑largest member of OPEC, accounting for close to 13% of the group’s total oil production (see chart below). Its decision to leave OPEC reflects a long‑running clash with Saudi Arabia - OPEC’s most influential member - particularly over the enforcement of production quotas.
The UAE has spent years investing heavily in expanding its oil production capacity and is increasingly unwilling to be constrained by output limits set by the group. These tensions have been further intensified by the current crisis in the Gulf, which has sharpened differences over how production policy should respond to geopolitical risks.
UAE’s exit weakens OPEC and means OPEC will control less of the oil market. Without the current Gulf war, the decision probably would have put downward pressure on oil prices, but this impact is being overshadowed by the current supply shock.
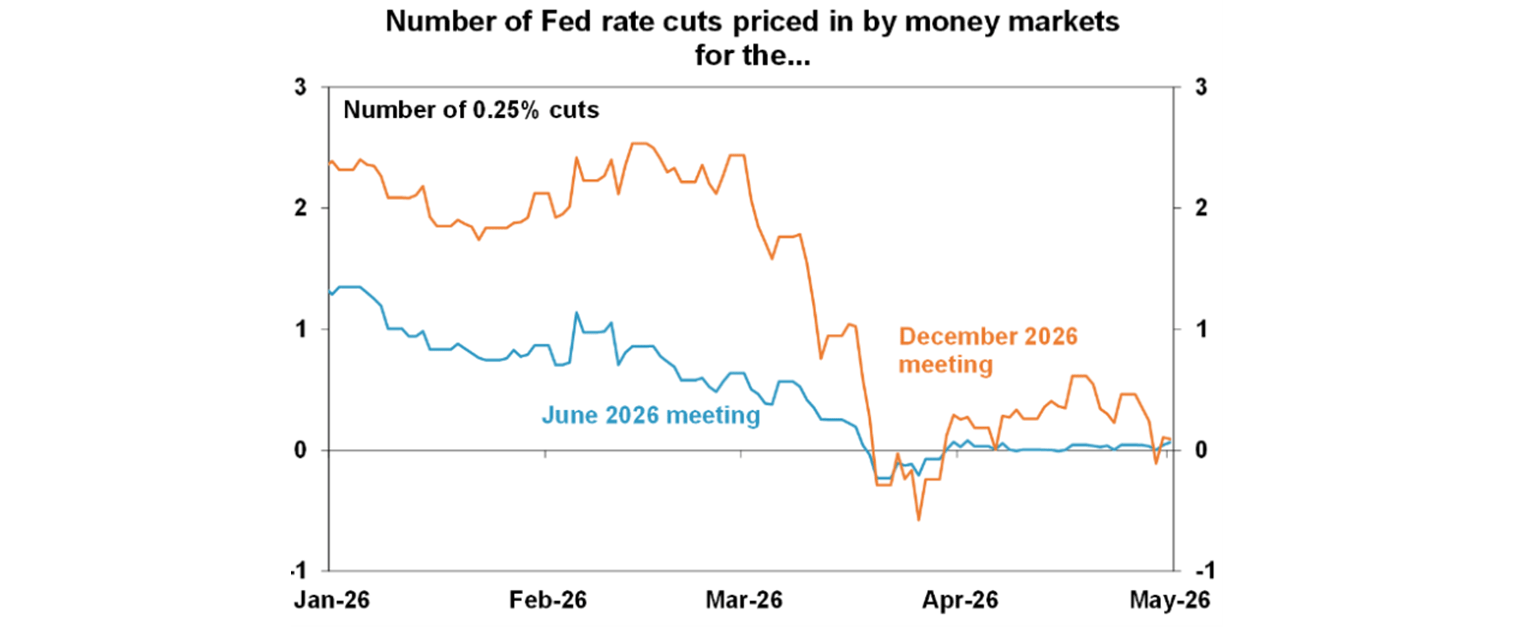
It was a week of central bank meetings. The US Federal Reserve kept rates unchanged at 3.5-3.75%. The last move from the Fed was a 25 basis point cut in December. The April decision was voted with an 8-4 majority, there was 1 dissent to the rate decision (Miran) who wanted to see a rate cut and 3 regional president dissents (Hammack, Kashkari and Logan) who voted against the easing bias in the statement. I thought the statement was quite neutral in its commentary and showed that the Fed is attentive to risks on all sides. The Fed is in no rush to cut rates again and the lift in oil prices and impact on other sectors means inflation will go up at a time that inflation is already a tad elevated.
The market is assuming basically no change in US interest rates this year (see the chart below), a big change from early this year when more than 2 rate cuts were priced in.
This meeting also marked Jerome Powell’s final Federal Reserve meeting as Chair, with his term due to expire in mid‑May after serving two four‑year terms. Powell confirmed that he intends to remain on the Fed’s Board as a regular governor for a period yet to be determined, contingent on a clear resolution of the legal scrutiny surrounding cost overruns linked to the renovation of the Fed’s Washington DC headquarters.
While the US Department of Justice dropped its investigation last week - clearing the way for Kevin Warsh to be confirmed as the next Fed Chair - the matter has since been referred to the Fed’s inspector general for further review. The prosecutor also noted that the case could be re‑opened should new information emerge. In his remarks this week, Powell was firm in stressing the importance of protecting the Federal Reserve’s independence from legal and political interference.
It was an interesting Bank of Japan meeting. Interest rates were kept at 0.75% but it was a “hawkish hold” as there were 3 dissents (out of a 9 person board). Japan’s CPI (ex fresh food) is now expected to reach 2.8% in FY26 (from 1.9%). The Bank of Japan’s cautiousness on raising rates is keeping downward pressure on the Yen and Japanese policymakers had to intervene in the market at the back-end of the week, causing the yen to have its largest intra-day gain in almost two years. We expect a rate hike from the Bank of Japan in coming months.
The Bank of Canada held rates at 2.25%, which is a cyclical low. Rates are expected to be held steady if oil prices start to normalise. However, the central bank sounded hawkish and emphasised the upside risks to inflation given movements in oil markets. Markets are pricing in the risk of hikes later this year.
The European Central Bank kept interest rates unchanged at 2%, but warned up upside inflation risks and downside growth risks and there is a high likelihood of a June hike.
The Bank of England held rates at 3.75% with a 8-1 vote. The committee set up multiple scenarios around the impact from higher oil prices and a rate hike is a possibility later this year.
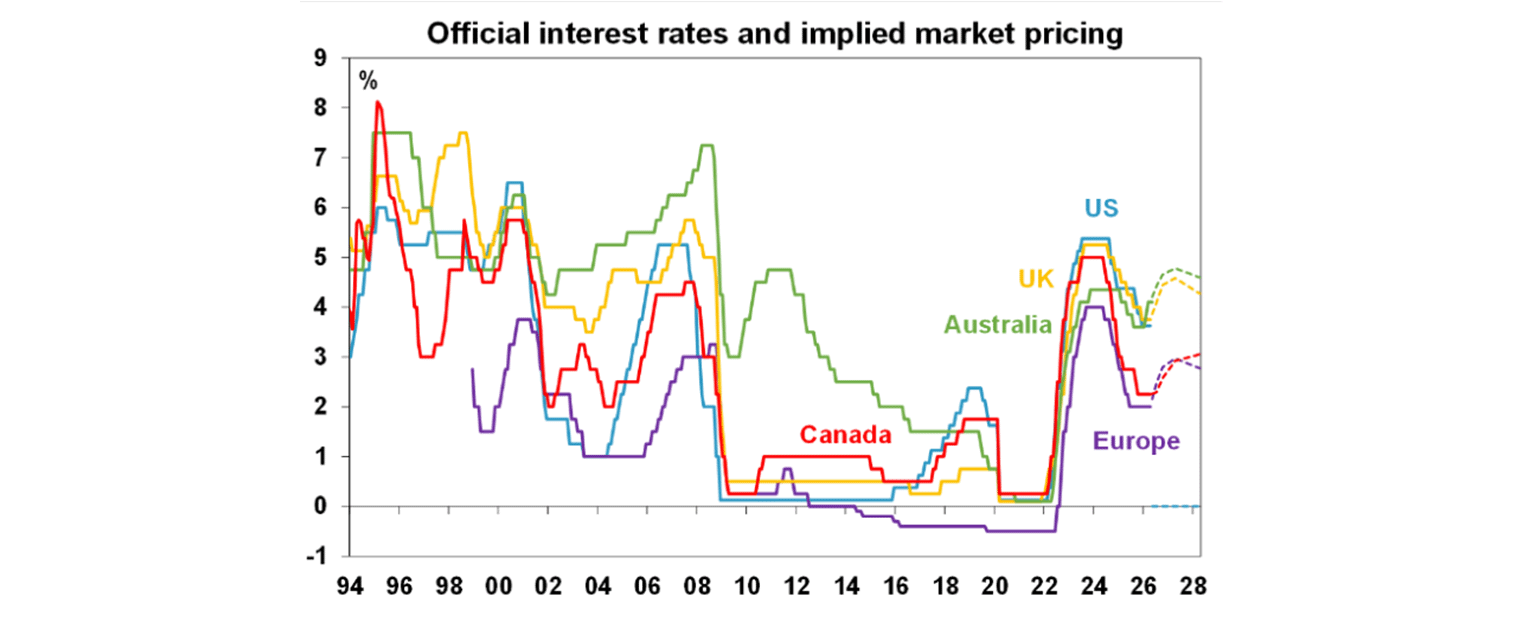
So all up, Australia is still an outlier by being the most aggressive to start the hiking cycle but other central banks may have to follow suit later this year.
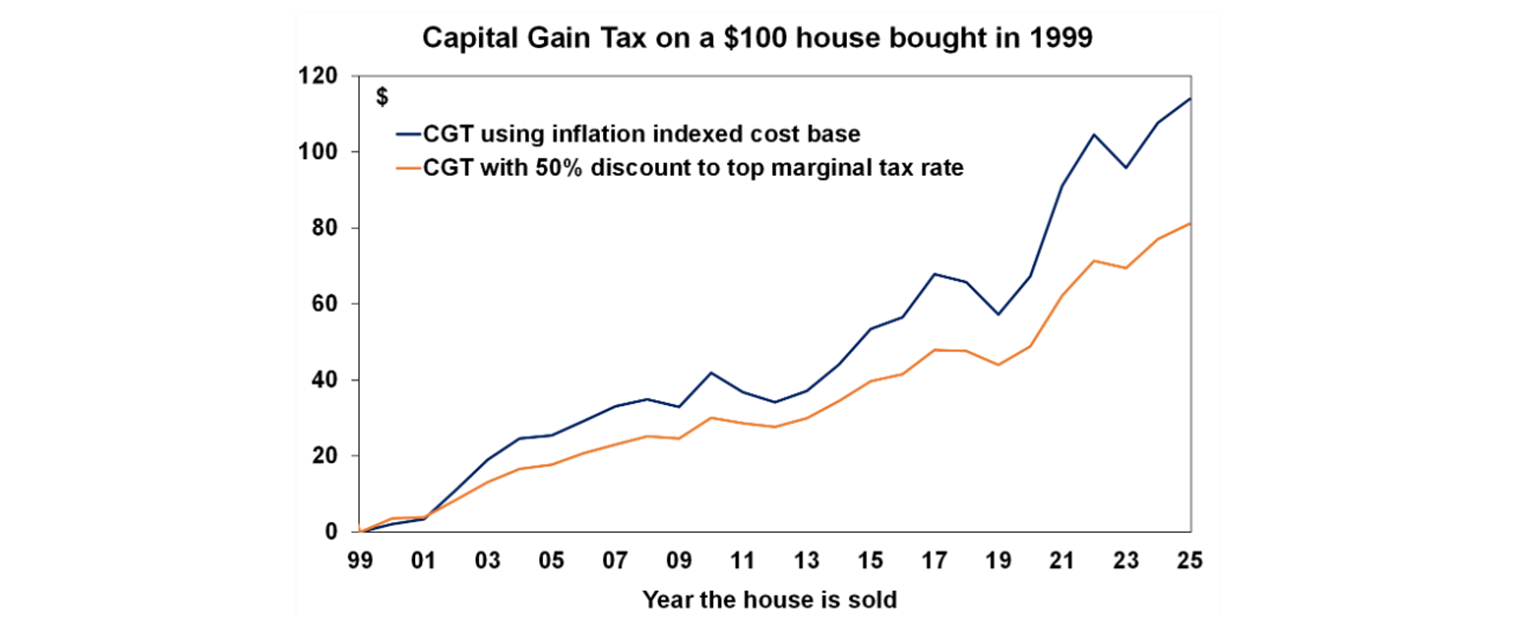
We are less than two weeks away from an Australian Federal Budget and as is common before a budget we are getting dribbles of policy announcements in the news. The government looks to be seriously considering changes to the Capital Gains Tax (CGT) discount. The current rules are that a 50% discount is applied to the capital gain if an asset is held for over 12 months. Before CGT was introduced in 1999, inflation indexation was applied to assets to calculate the capital gains tax implication. Now, the government is talking about reducing the discount from 50% to 30 or 25% due to concern that the current system favours wealthy, older investors, locks younger generations out of housing, and worsens inequality. Let’s take a look at the figures. My colleague My Bui did some analysis on this over the past week.
Investors have benefited from the 50% CGT discount since its introduction in 1999 (orange line in chart 1 which shows the CGT paid), largely because house prices have risen by around 6.2% per year, far outpacing average inflation of 2.8%.
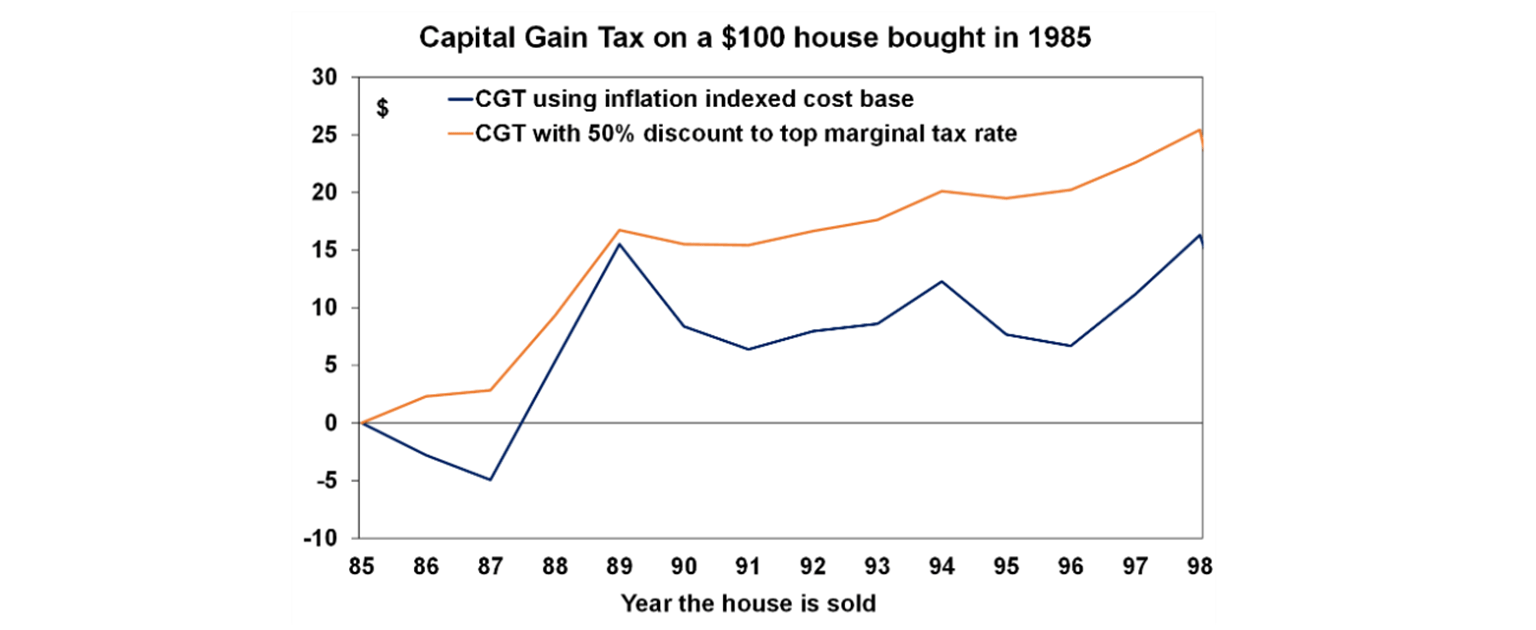
But between 1985 and 1999, investors would have done better under an inflation‑indexation system. Inflation was higher at 4.4% pa, while house prices rose at a more modest 5.9%. So in other words, whether the CGT system favours investors depends less on the tax design itself and more on the economic backdrop.
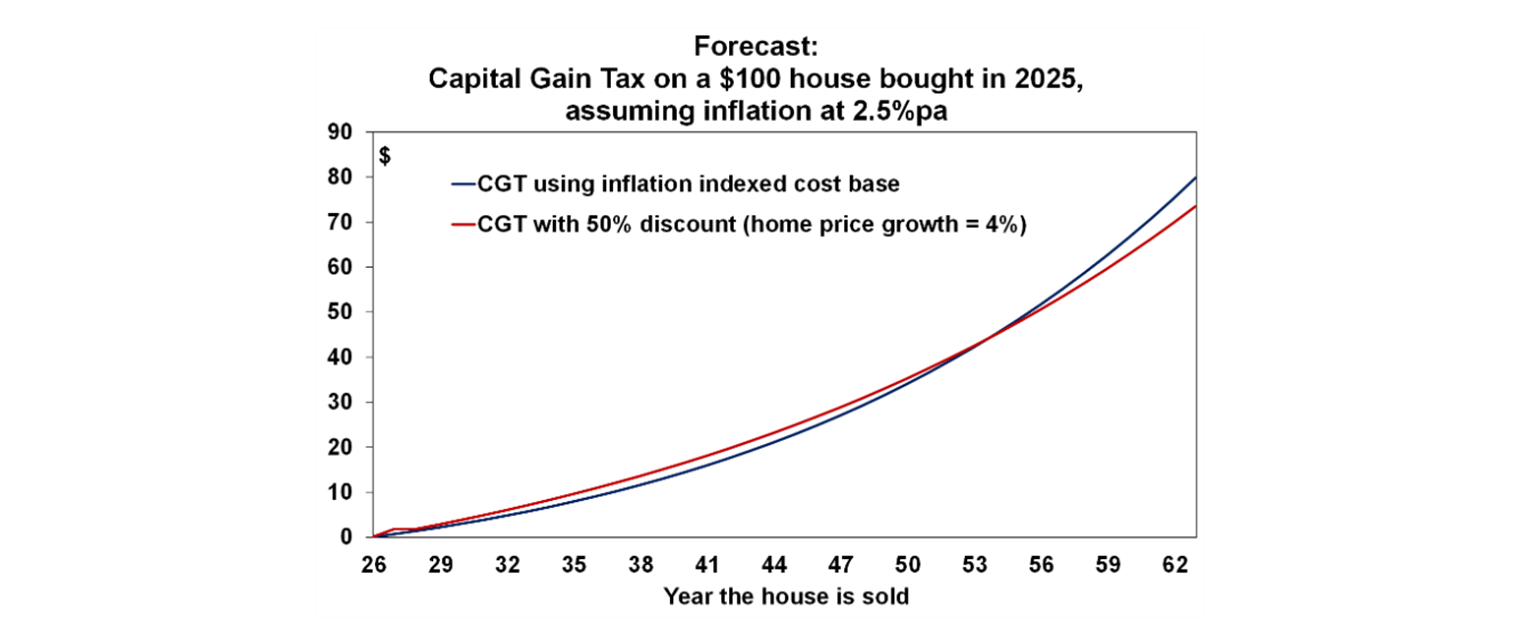
And looking into the future, if home price growth slows to around 4% per year and keep inflation at 2.5%, the 50% CGT discount would actually disadvantage investors who sell within the first 20 years (next chart).
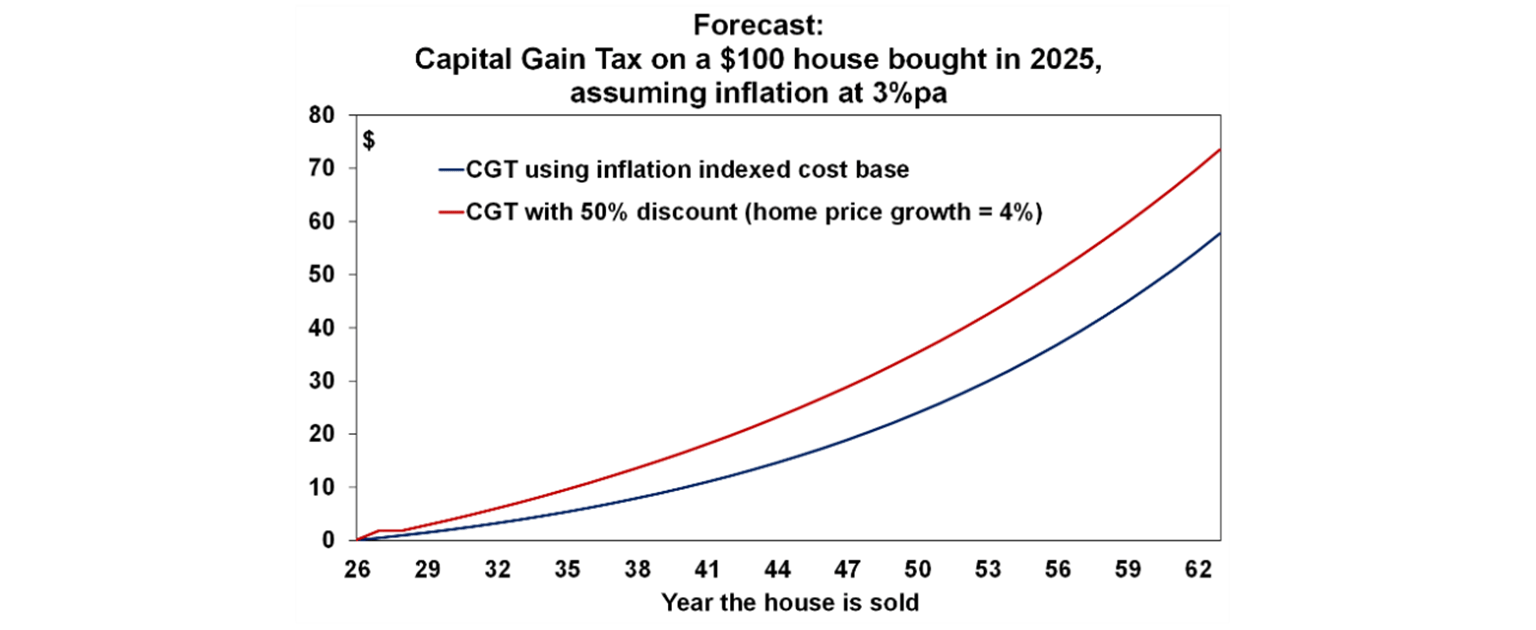
The discount is even worse for investors if inflation is 3% (chart 4), which is not too unrealistic in a world of higher geopolitical risk, aging populations, rising public debt which all tend to be inflationary.
Negative gearing changes also look to be on the table. I doubt the government would consider scrapping the CGT discount or negative gearing concessions entirely as it would cause too much backlash (like the Bill Shorten campaign in 2019 to curb negative gearing) but reducing concessions is probable.
The bottom line is we can debate all day about how best to tax housing investment, but housing inequality won’t be fixed through tax alone. The real solution is to build more homes, which practically means less regulation, faster approvals, faster construction, more tradies, and less government crowding out private construction. A wider tax reform is also necessary and arguably an indexation-based system has merits, but changing CGT alone won’t change the big picture.
Major global economic events and implications
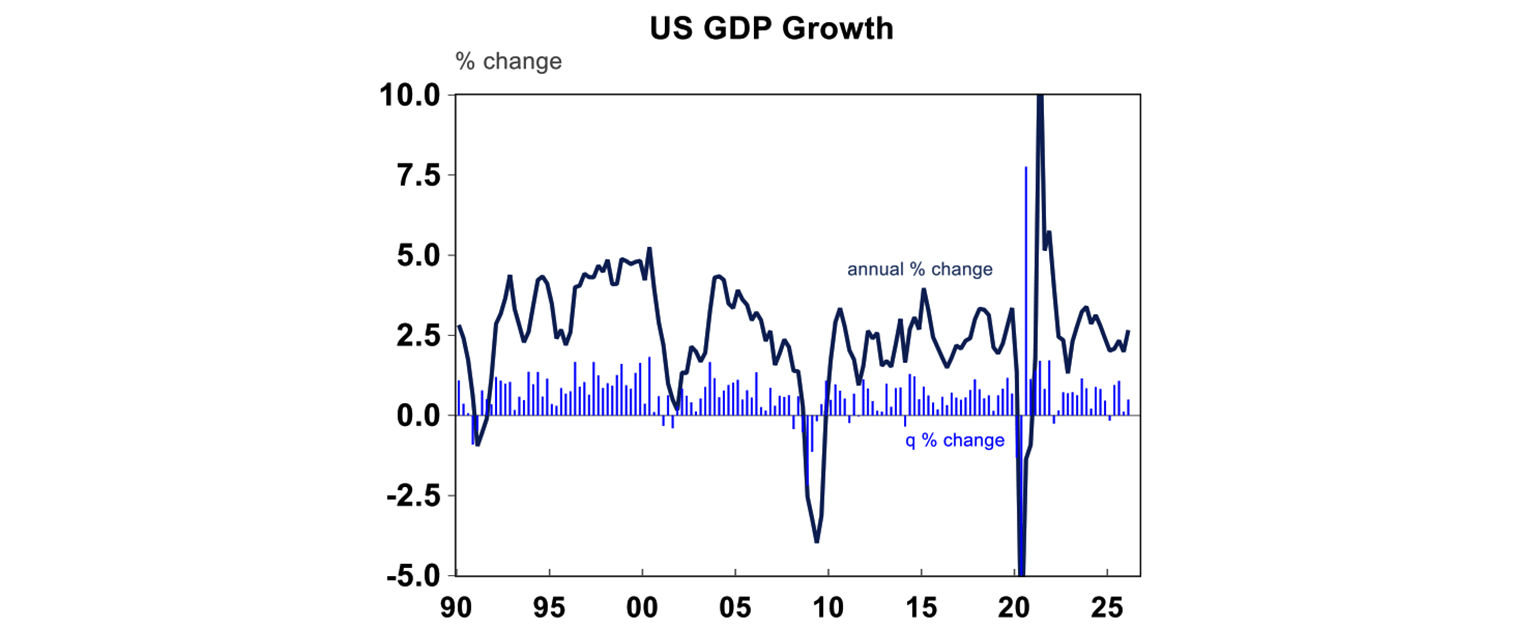
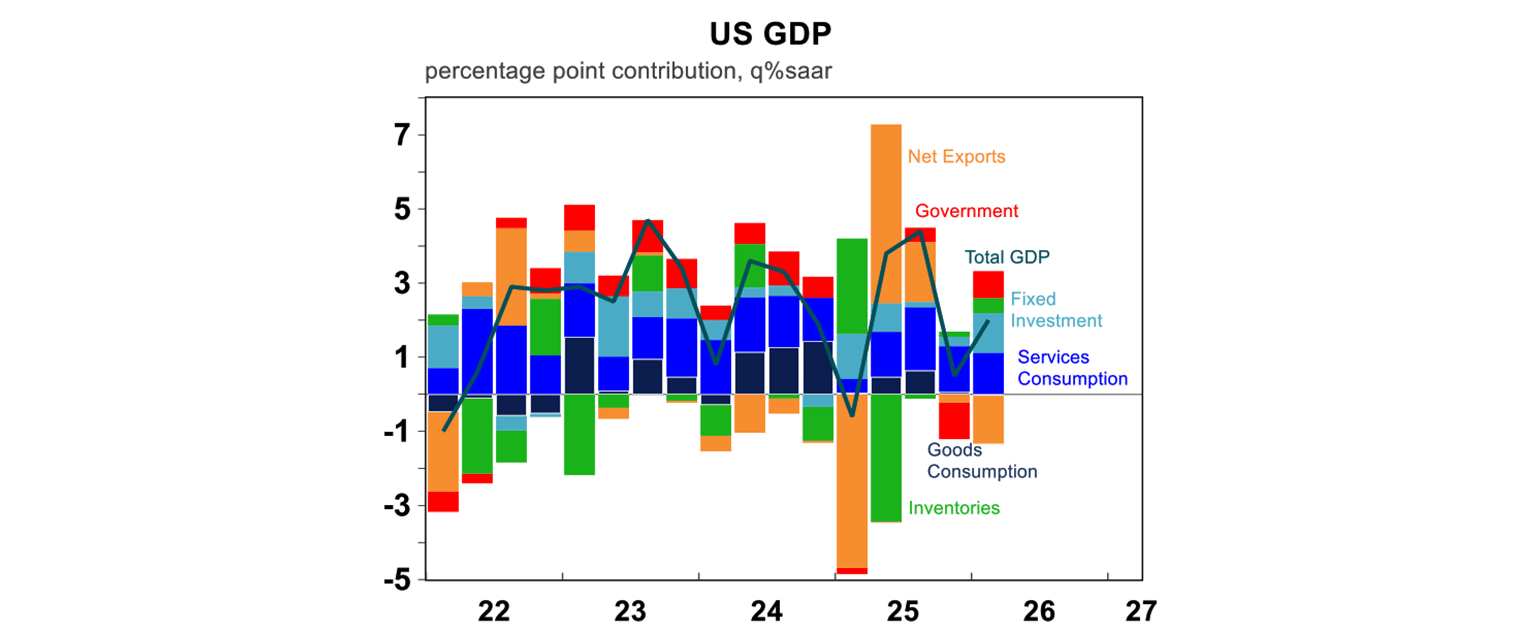
US GDP rose by 0.5% in the March quarter and is 2.7% higher over the year (see the chart below).
The components showed a boost to growth through fixed investment, which was mostly tech driven (information processing equipment and data centres). Tech goods imports were also up strongly (which actually detracts from growth as its an import). Household spending was driven by higher services spending, goods consumption was flat. Government spending was positive after the shutdown-induced fall in the December quarter.
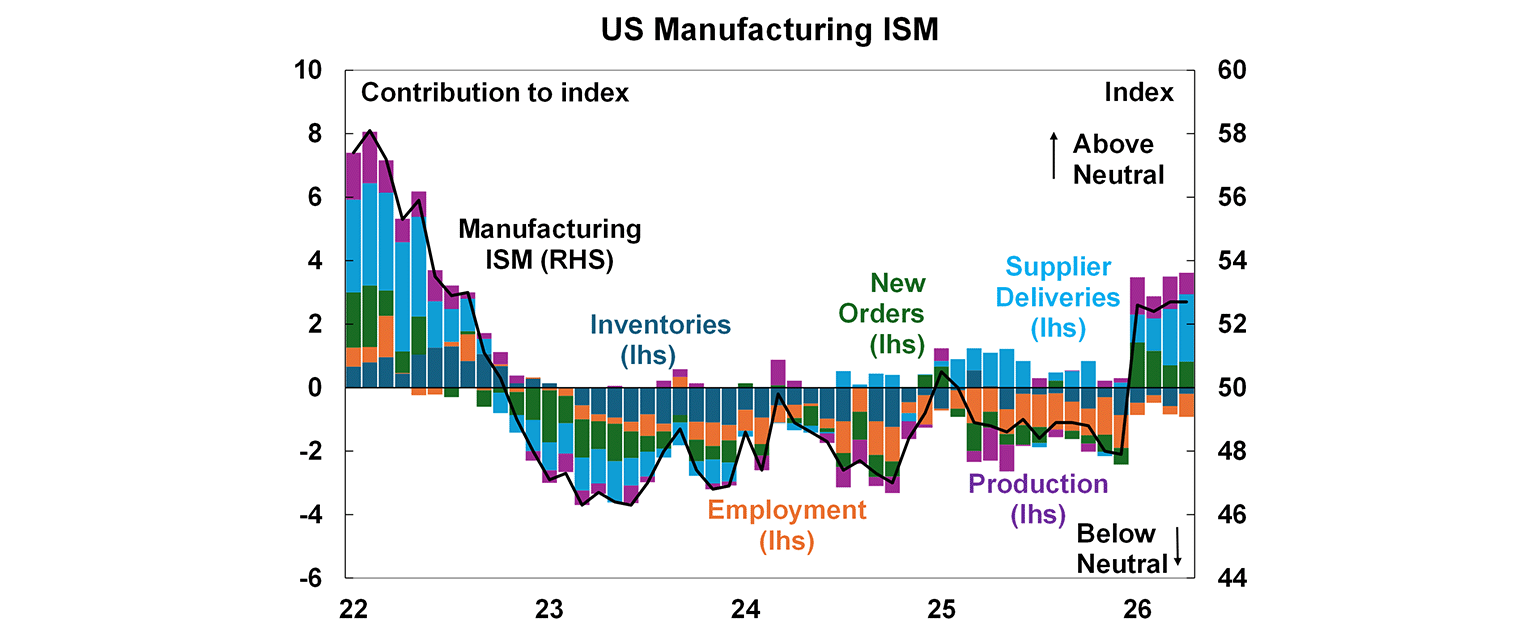
To Trump’s credit, manufacturing has improved in the US. The ISM manufacturing index was unchanged at 52.7 in April, remaining around its highest levels since the 2022 post-Covid boom.
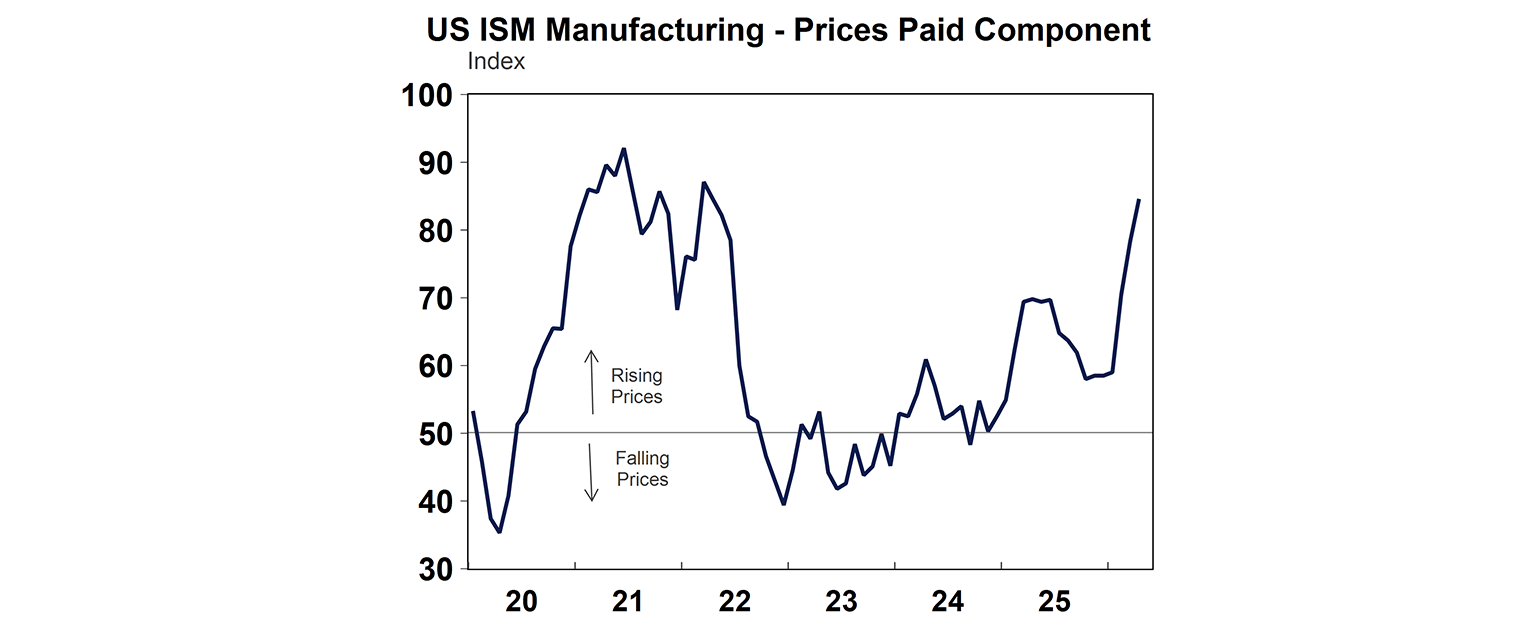
However, prices paid are surging again.
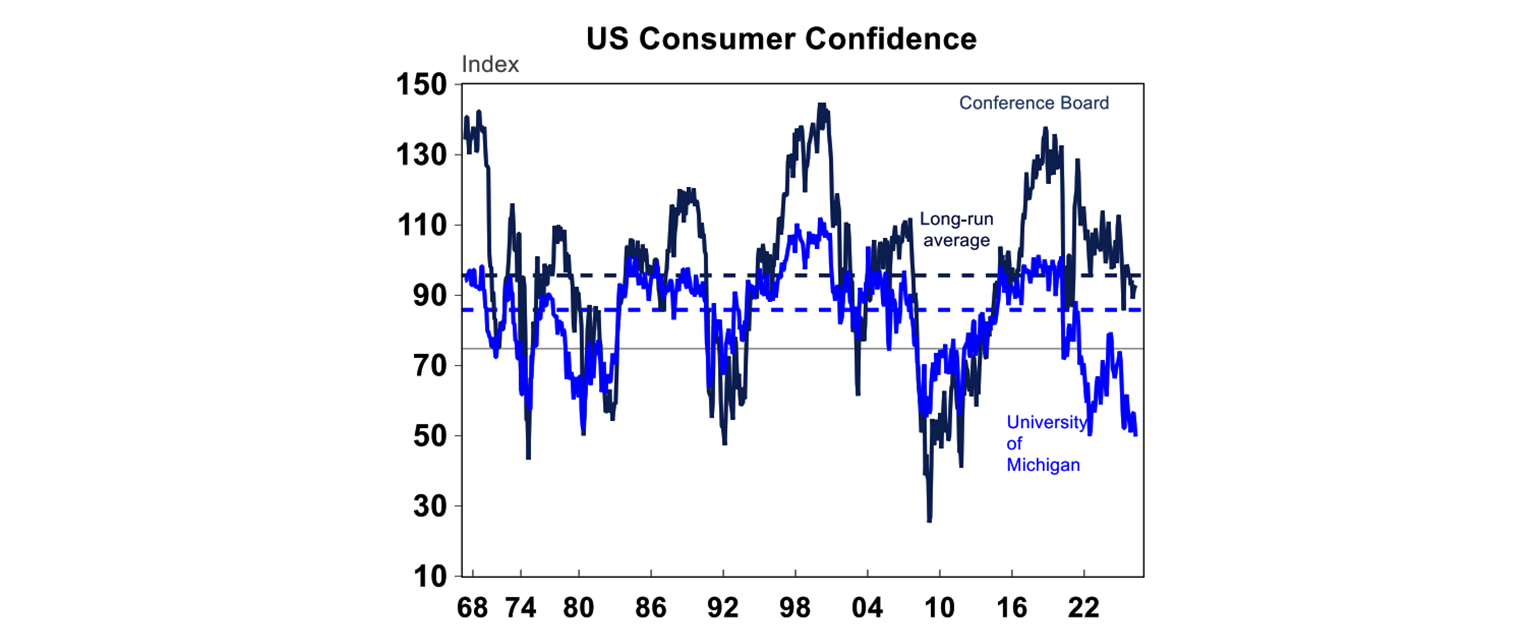
US Conference Board consumer sentiment ticked up in April despite all the policy volatility, although it’s still below its long-run average.
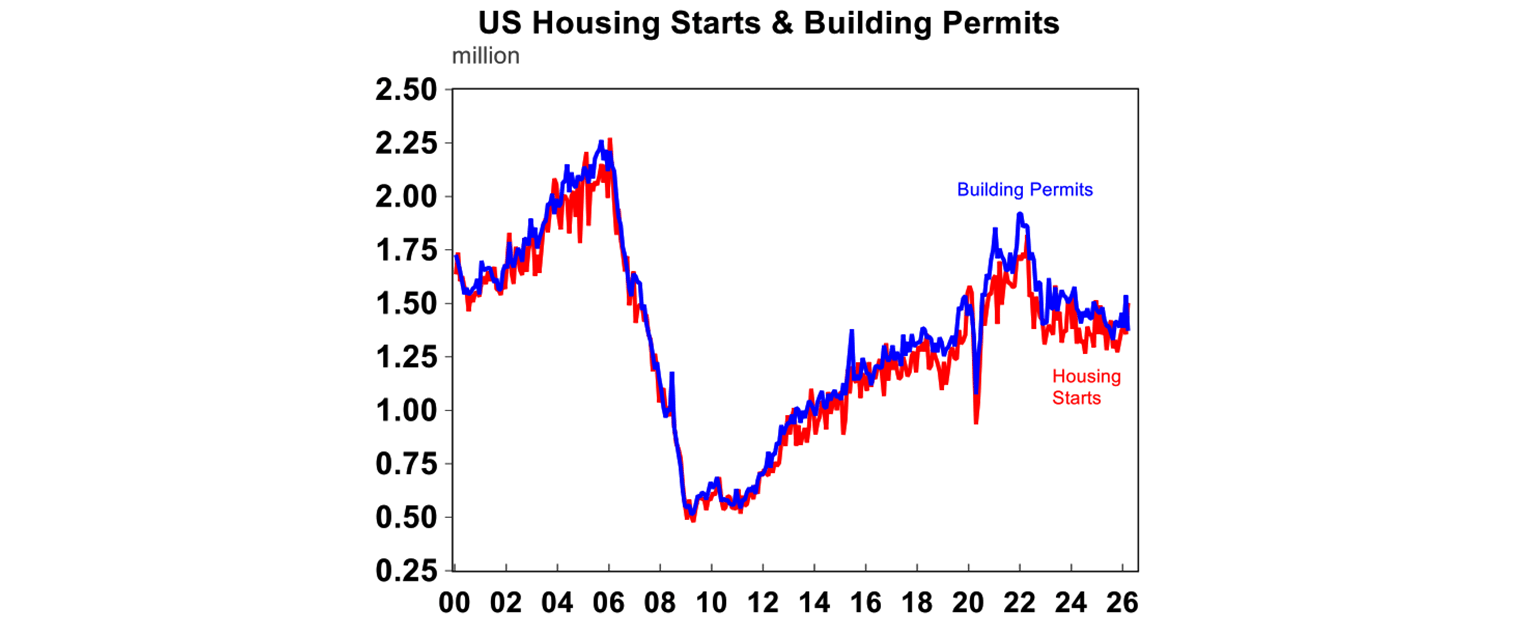
US housing starts rose by 10.8% in March but building permits fell by the same amount! There has been a slight tick up in building activity in the past 12 months (see the chart below) under Trump’s housing affordability push but building levels are still too low.
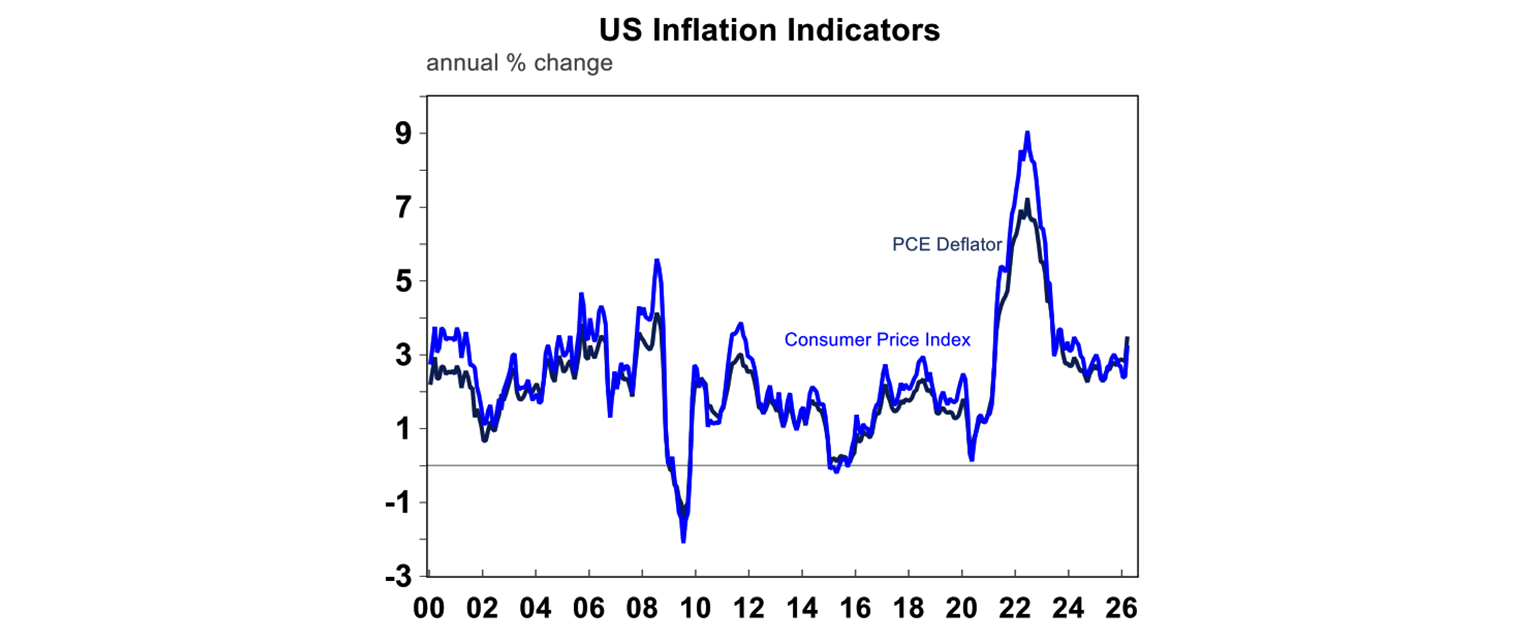
The US core PCE deflator for March, an alterative inflation indicator (and the one the US Fed actually targets) was up by 3.2% over the year to March.
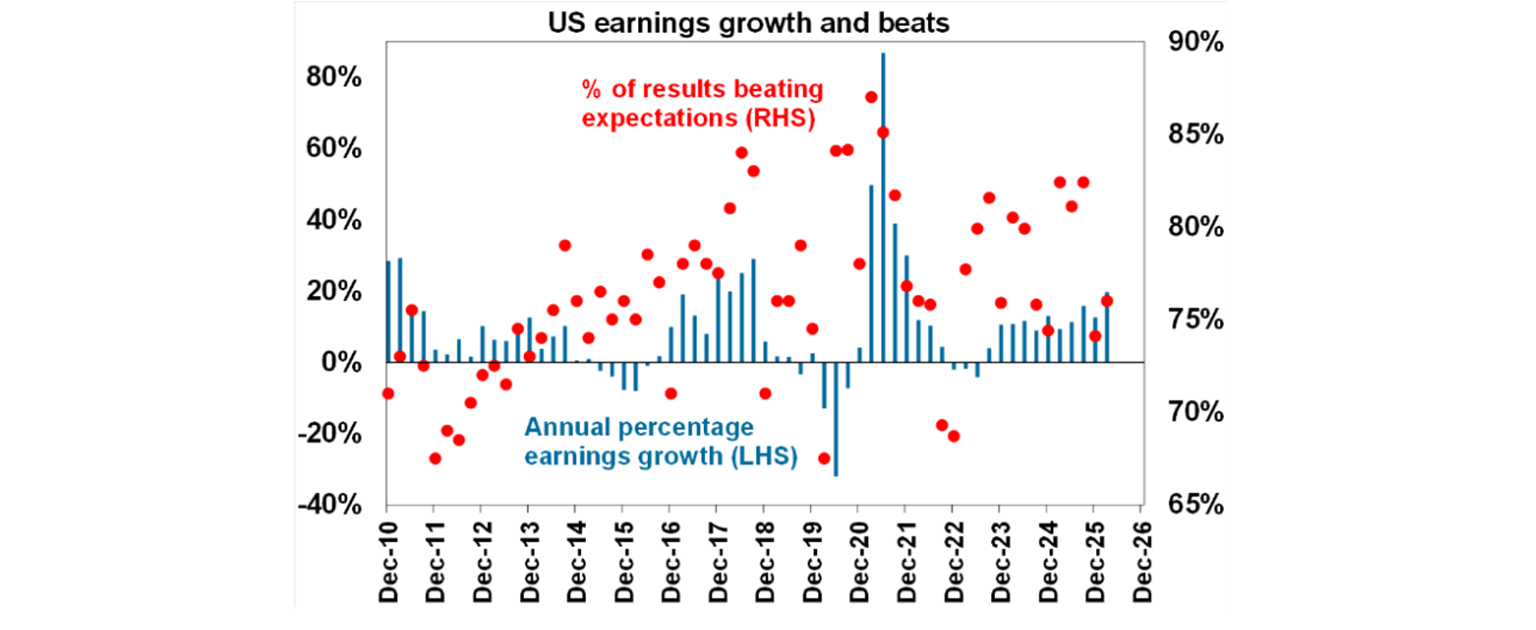
Over 50% of US companies have reported March quarter earnings. Earnings are expected to be up by nearly 20%, well up from 10% expectations just a few months ago with over 75% of results beating expectations.
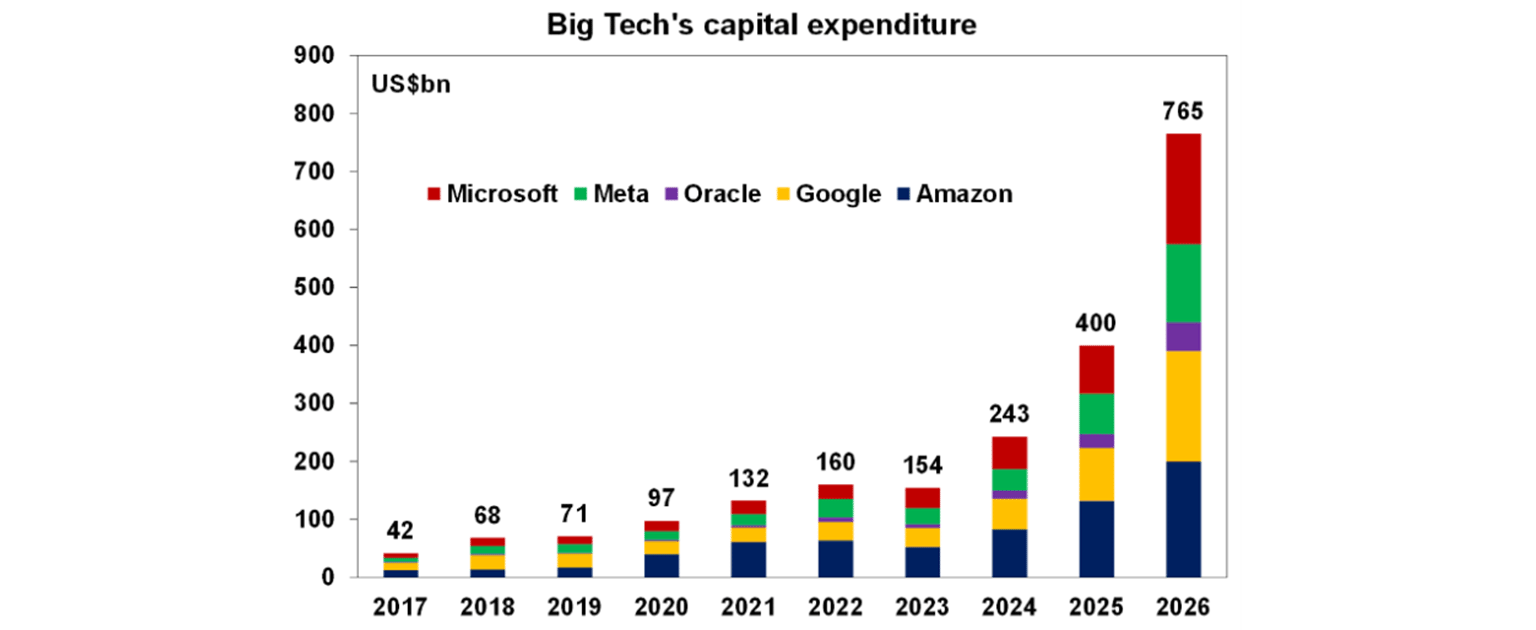
Technology companies continue to dominate the earnings landscape, with profits expected to grow by around 40% compared with last year. Earnings across the tech sector were mixed this week. OpenAI missed its financial targets, while Meta raised its spending outlook for the year. Alphabet reported revenues and profits above expectations, Amazon’s cloud division delivered its fastest quarterly growth in more than three years driven by new data‑centre capacity, and Microsoft posted strong growth in its cloud‑computing business on continued demand for AI‑related services. Apple also provided a solid revenue outlook for the June quarter.
Taken together, capital spending across Microsoft, Meta, Oracle, Google and Amazon is now expected to reach around US$765 billion in 2025 - nearly double last year’s level. As a result, despite very elevated valuations, it remains difficult to be overly negative on the outlook for the technology sector.
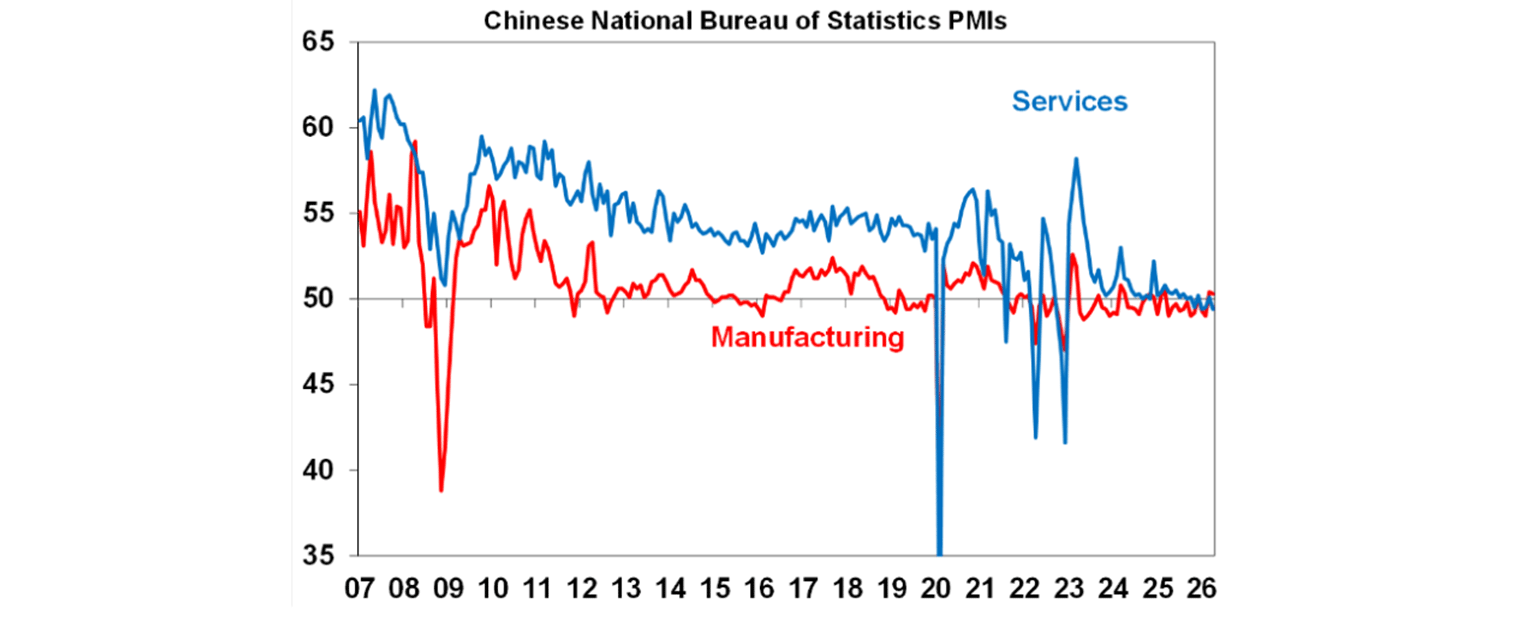
China’s official PMI data for April was positive 50.3 for manufacturing, while non-manufacturing was a bit weaker at 49.4. This is more or less in line with recent months and shows stable economic growth.
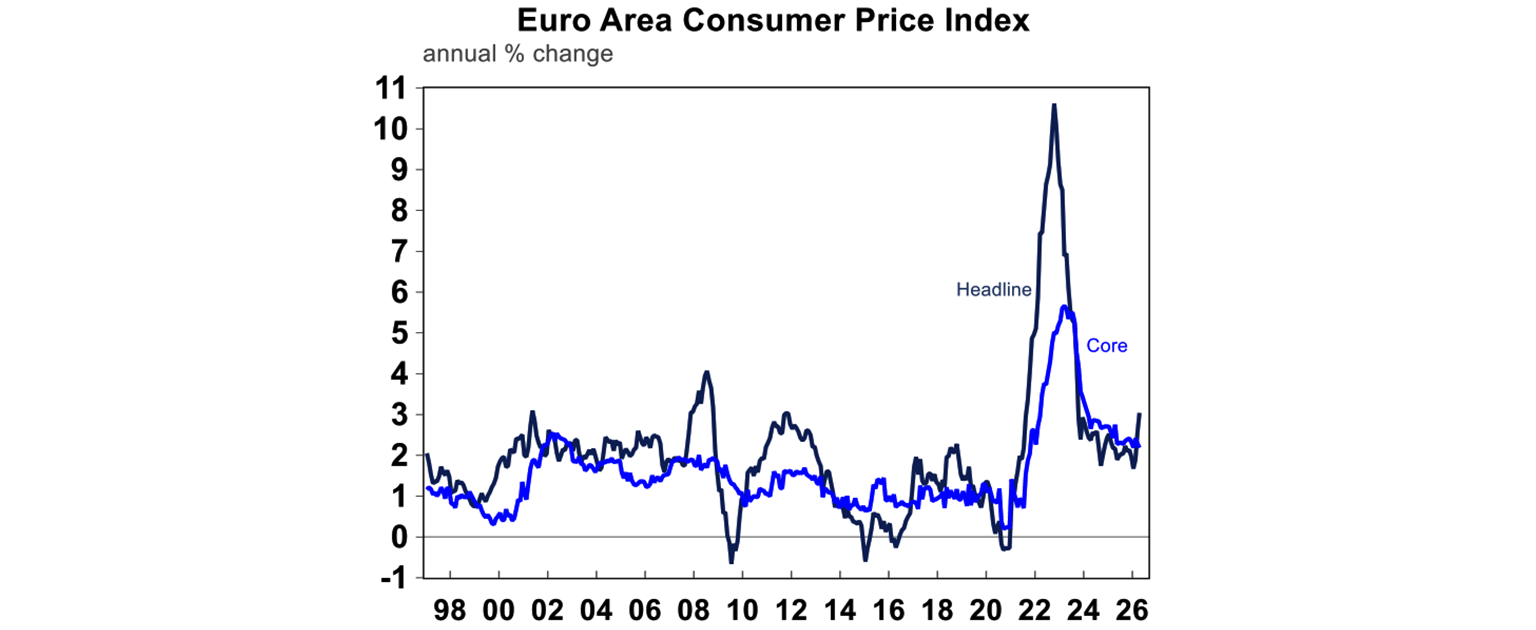
Eurozone CPI was up by 2.2% on the core measure and 3% on headline – a decent tick up from last month.
Australian economic events ad implications
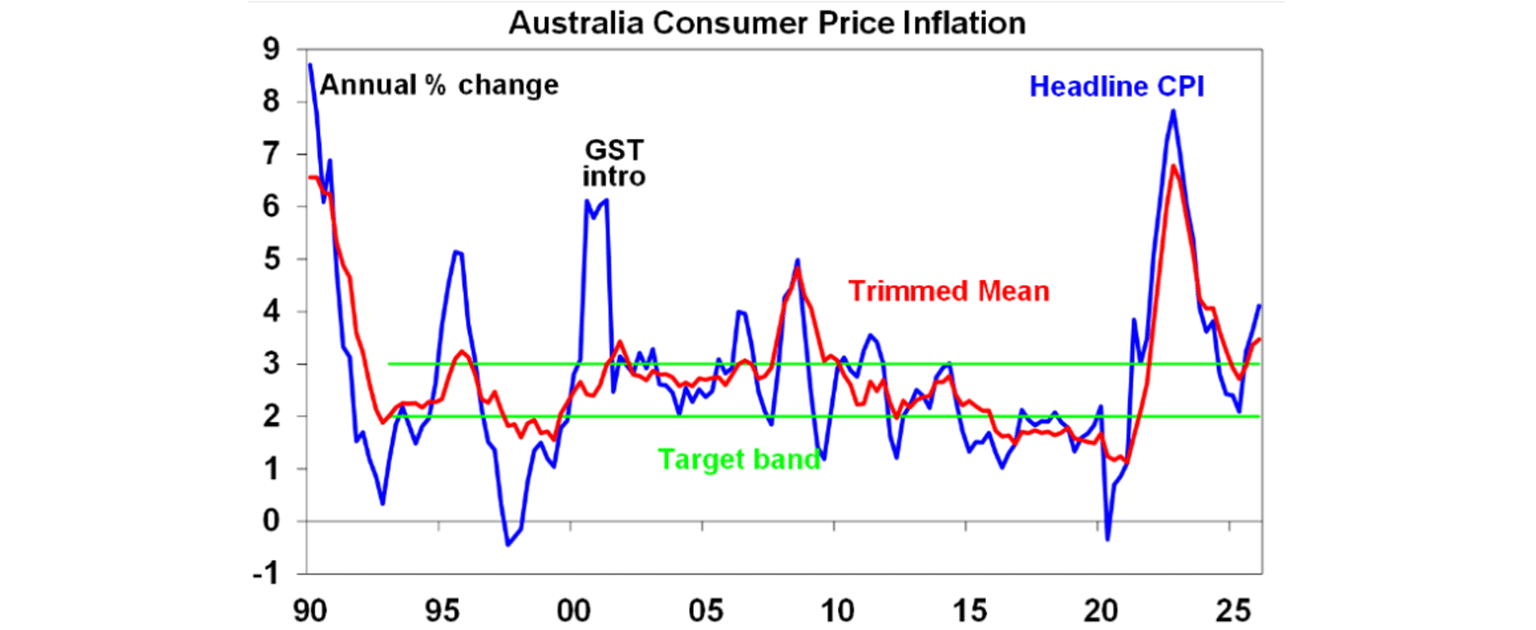
The March inflation data was good from the point of view it was a bit lower than expected. Over the month of March, prices rose by 1.1% and annual growth was 4.6%, and economists were looking for 4.8%. The trimmed mean rose by 0.8% over the March quarter (below economist and RBA expectations of 0.9%). The bad news is that inflation is very high!
This is mostly the impact of higher automotive fuel prices (petrol and diesel) as a result of the war in the Middle East. In the absence of that shock – if oil prices had not risen - monthly headline inflation would have been flat and annual growth would have gone down to ~3.4% year on year (from 3.7% last previously), rather than accelerating to 4.6%. The inflation problem in Australia is evident in administered and indexed services items and rents and construction costs. And the war-fuelled oil impact will add to that. So, the inflation problem has not gone away unfortunately which means interest rates are likely to move up again.
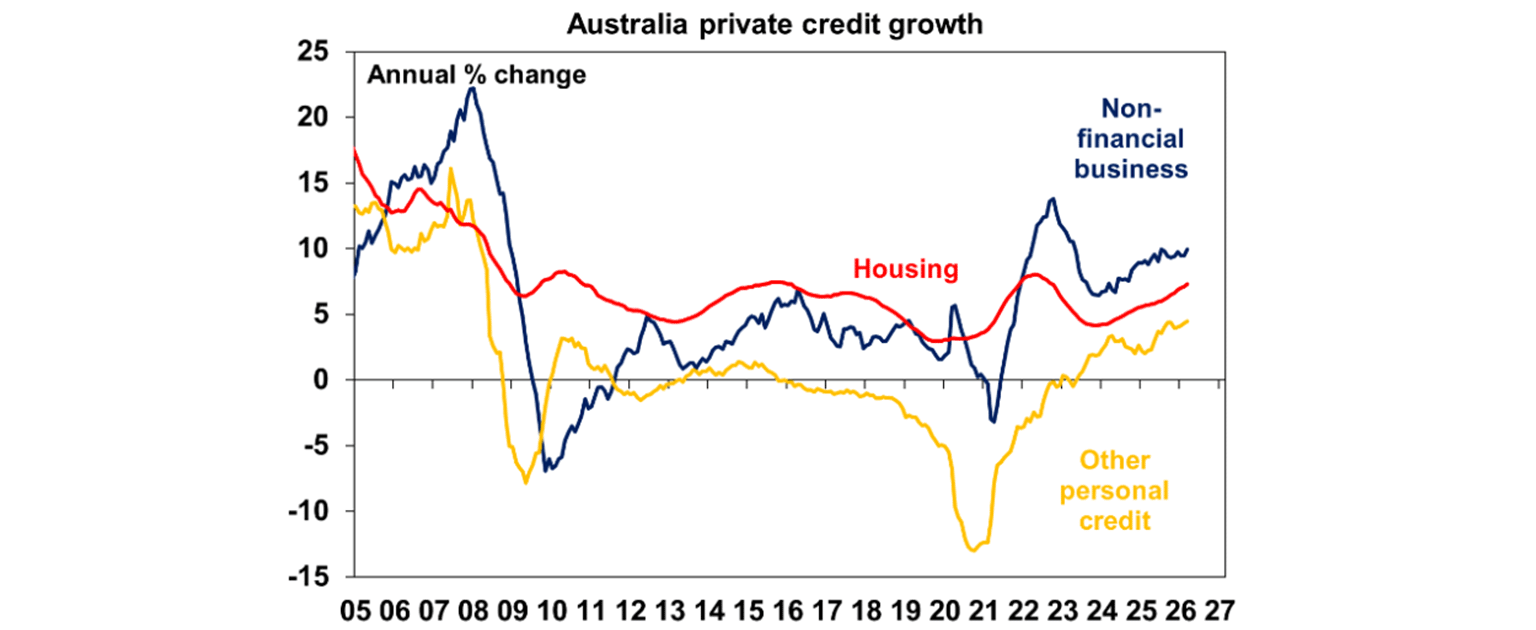
Strong credit growth continues in Australia, up to 8.1% over the year (the fastest since 2022), a sign that lending conditions are not tight and households and businesses are taking out loans. Housing credit was up 0.6% and is 7.3% higher over the year, personal finance lending is 4.5% over the year and business credit is 9.9% higher.
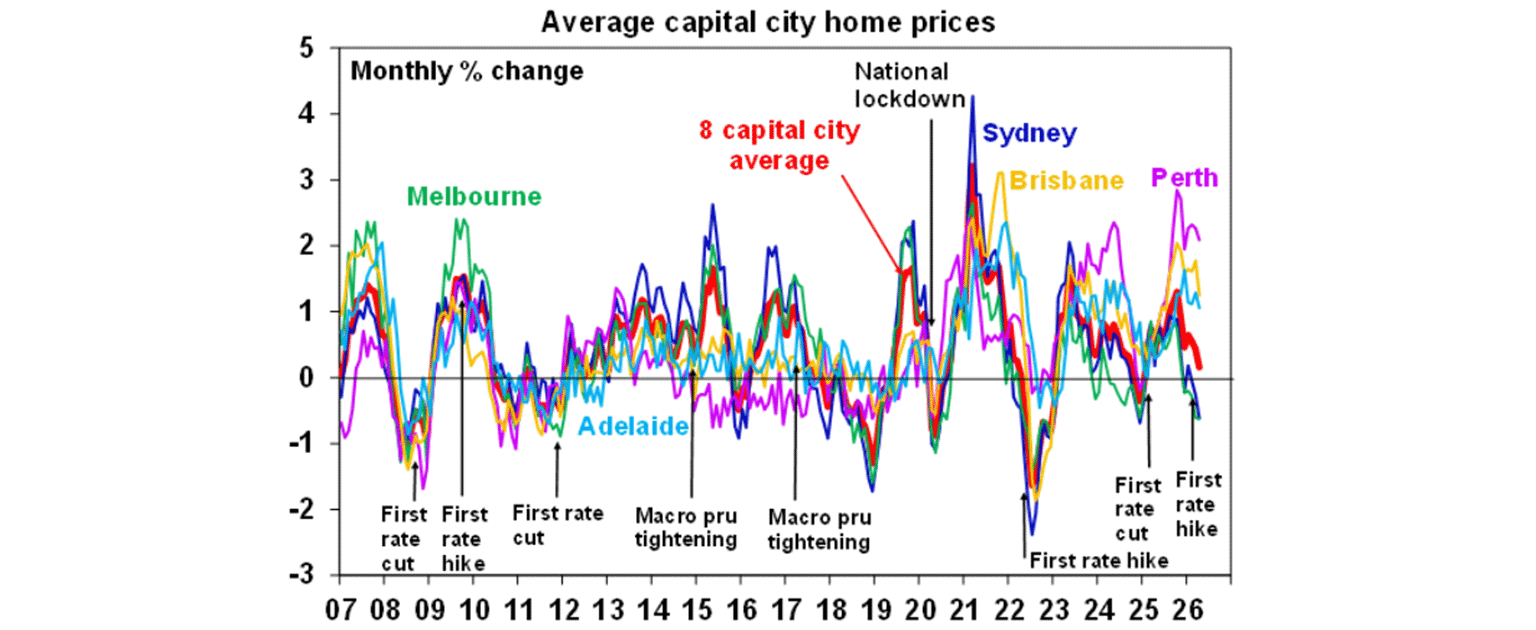
Cotality home price figures were softer for April, rising by just 0.3%, the slowest monthly pace since January last year. This isn’t too surprising as there have been two rate hikes this year and the expectation of more hikes which dents buyer sentiment, the market has already performed very strongly (nationally) over the last 12 months, so it’s hard to maintain the same momentum and there is uncertainty around potential tax changes to housing in the May Budget. Brisbane, Adelaide and Perth are still outperforming but the pace of growth is cooling. We expect national price growth of around 3% this year, with the risk on the downside. The main factor supporting home prices is the persistent undersupply of dwellings.
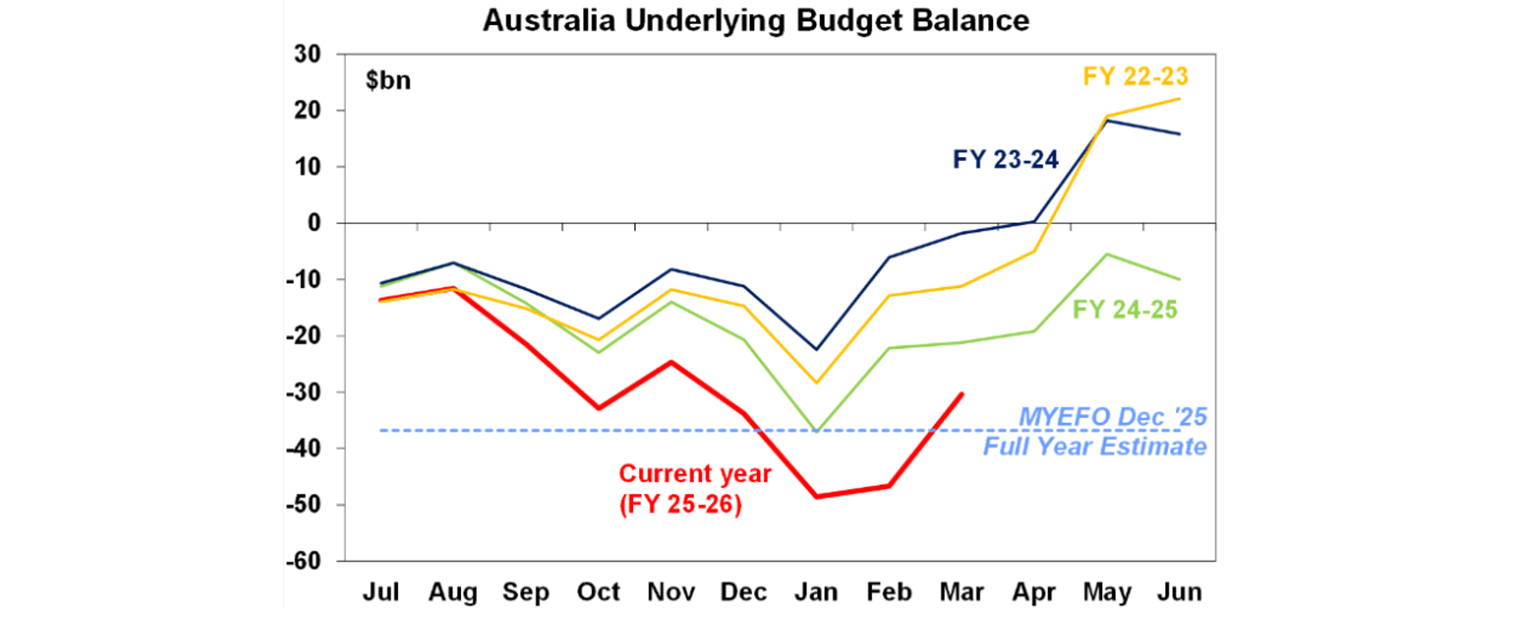
The monthly Australian government budget figures show the budget is running around $17bn better than its profile in the Mid-Year Economic and Fiscal Outlook (see the chart below) published in December which forecast a deficit of $37bn for 25/26. We think the actual outcome will be around $25bn this year, given cost of the fuel excise and potential of other relief measures announced in the Budget. In the years ahead, the budget is likely to show a lift in the deficit again.
What to watch over the next week?
In Australia the Reserve Bank Board meeting is the main event. We expect a 25 basis point increase to 4.35%, which is back to where interest rates peaked in 2024. The Board was split in its last decision to rate interest rates (with 5-4 members voting for a rate increase), although Governor Bullock said this was a question of timing rather than direction. We expect another split Board decision in May so we don’t think a rate rise is necessarily a “done deal”. The March inflation data was actually a bit better than the RBA expected but June quarter inflation is likely to tick up again and trimmed mean inflation is likely to be over 3.5% - too far above the RBA’s 2.5% target. The risk of another rate hike is that it would take interest rates back to their post-Covid highs and could weaken private sector growth at a time it was improving. This is on top of the increase in fuel prices which we estimate to be worth around 1 interest rate increase. Basically, the RBA Board need to weigh up if the upside inflation risks are more of a problem than a slowing in economic growth. We think the RBA’s concern around inflation, which already existed before the war started, will lead them to decide to hike again.
The RBA also release their quarterly Statement on Monetary Policy which is an update to its forecasts. Near-term headline and trimmed mean inflation forecasts will be revised up, another reason for the Board to maintain its concern around inflation. But GDP growth is likely to be revised down further due to the increase in market pricing for further rate increases in 2026 and the impact from higher fuel prices.
In other Australian data we expect a 1.5% increase in the March household spending indicator, taking annual growth to 6.1% but this is being boosted by a big lift in fuel spending, as the indicator is impacted by rising prices. Building approvals are likely to fall 29% in March, nearly reversing the 30% increase last month. Approvals are very volatile due to lumpy apartment project approvals. The March trade balance is expected to remain in surplus at over $5bn.
Next week in the US we get the services ISM index (expected to be in positive territory at 53.7 from 54 last month), March jobs openings (expected to be a touch lower as labour demand has slowed) and labour turnover survey, ADP employment, consumer inflation expectations, March quarter labour costs, University of Michigan consumer sentiment (likely to remain constrained) and the week ends with April non-farm payrolls (consensus expectations are for a 60K lift from 178K last month).
The Reserve Bank of New Zealand release their Financial Stability Report, around potential risks in the system and there is also March quarter unemployment (expected at 5.4%, unchanged on last quarter).
In China, there is the RatingDog services PMI and its expected to remain positive at 52 (means expanding activity) in line with other better monthly activity data.
And of course markets will be watching any news around the US/Iran impasse.
Outlook for investment markets
Global and Australian share markets have likely seen the worst from the War and oil shock if the flow of oil quickly resumes but the risk of further falls taking us to a 15% top to bottom correction remains high given uncertainty around the peace talks and flow of ships through the Strait along with still stretched valuations, political uncertainty associated with Trump & the midterm elections and increasing worries about private credit and the impact of AI. However, returns should still be positive for the year as a whole thanks to Fed rate cuts likely later in the year, Trump still likely to pivot to consumer-friendly policies ahead of the midterms and solid profit growth.
Bonds are likely to provide returns around running yield.
Unlisted commercial property returns are likely to be solid helped by strong demand for industrial property associated with data centres.
Australian home price growth is likely to slow to around 3-5% due to poor affordability, RBA rate hikes and the hit to confidence from higher fuel prices and the War.
Cash and bank deposits are expected to provide returns around 4.25%.
The $A is likely to rise as the interest rate differential in favour of Australia widens as the Fed cuts and the RBA hikes. Fair value for the $A is around $US0.72.
You may also like
-

Weekly market update - 17-07-2026 Following the renewed escalation in the US/Iran conflict, the Strait of Hormuz is effectively closed again with Iran attacking ships and the US attacking Iran and blockading its ports. Both are now back to attacking energy infrastructure which is a signficant & concerning escalation. -

Oliver's insights - Why have Australian living standards “fallen” and how do we fix it? For the last few years there has been much talk of a “cost-of-living” crisis in Australia and of “falling living standards”. This has flared up again lately with the pickup in inflation resulting in a renewed fall in real wages. -

Weekly market update - 10-07-2026 Ceasefire over but markets are also over the war, Why oil prices can't go too low or too high, Is AI adding to inflation risk or taking it away, and Australia’s wage problem.
Important information
Any advice and information is provided by AWM Services Pty Ltd ABN 15 139 353 496, AFSL No. 366121 (AWM Services) and is general in nature. It hasn’t taken your financial or personal circumstances into account. Taxation issues are complex. You should seek professional advice before deciding to act on any information in this article.
It’s important to consider your particular circumstances and read the relevant Product Disclosure Statement, Target Market Determination or Terms and Conditions, available from AMP at amp.com.au, or by calling 131 267, before deciding what’s right for you. The super coaching session is a super health check and is provided by AWM Services and is general advice only. It does not consider your personal circumstances.
You can read our Financial Services Guide online for information about our services, including the fees and other benefits that AMP companies and their representatives may receive in relation to products and services provided to you. You can also ask us for a hardcopy. All information on this website is subject to change without notice. AWM Services is part of the AMP group.