


Weekly market update
Investment markets and key developments
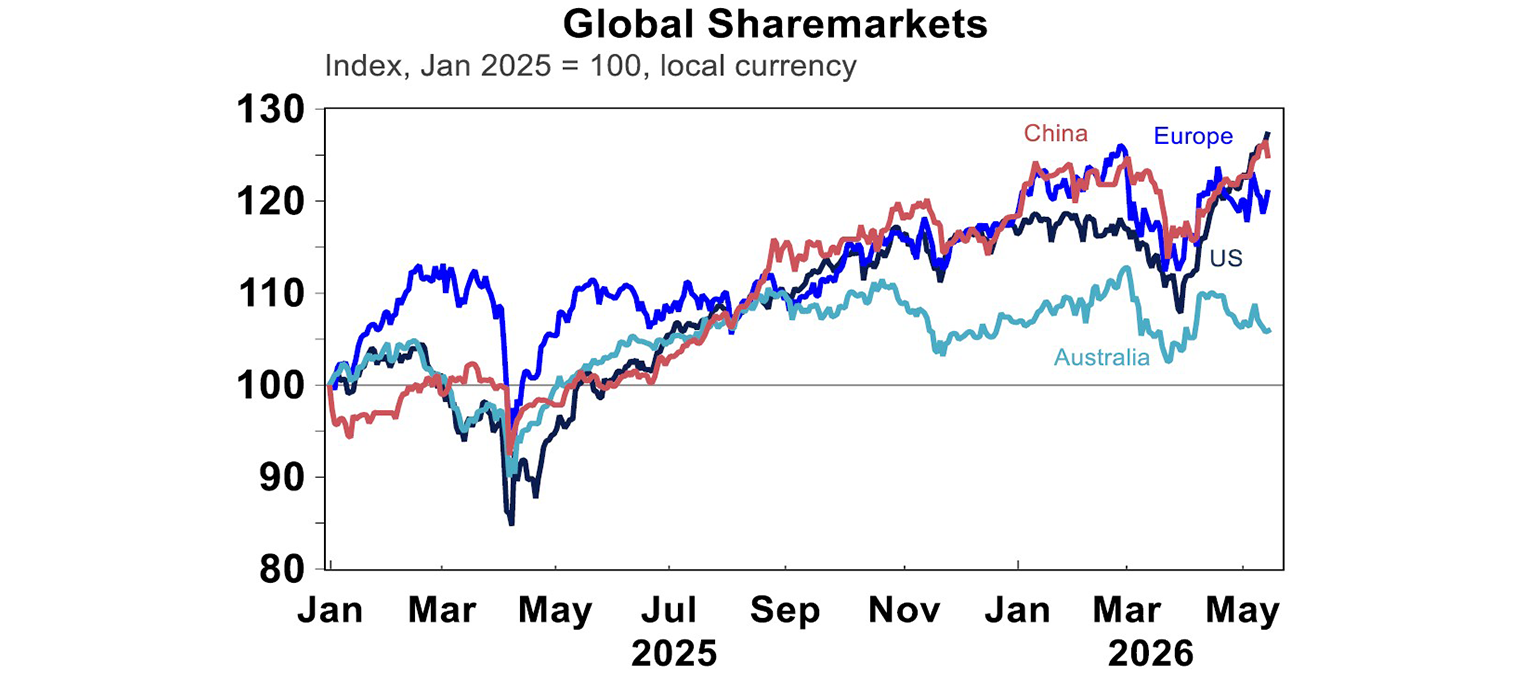
US share markets hit a new record this week but lost most gains on Friday after the Trump-Xi meeting yielded no major deals and Iran tensions remained unresolved. All sectors posted losses over the week except for energy. Around the globe, inflation concerns & rising bond yields also saw major indices in the red, as Eurozone shares fell 1.4%, Japanese shares down by 2.1%, Chinese shares down a smaller 0.25%.
12 min read

US share markets hit a new record this week but lost most gains on Friday after the Trump-Xi meeting yielded no major deals and Iran tensions remained unresolved. All sectors posted losses over the week except for energy. Around the globe, inflation concerns & rising bond yields also saw major indices in the red, as Eurozone shares fell 1.4%, Japanese shares down by 2.1%, Chinese shares down a smaller 0.25%. The Australian market continued to underperform and is now down 1.3% for the week, as banks stocks fell over concerns that budget measures will hurt investors’ demand for loans.
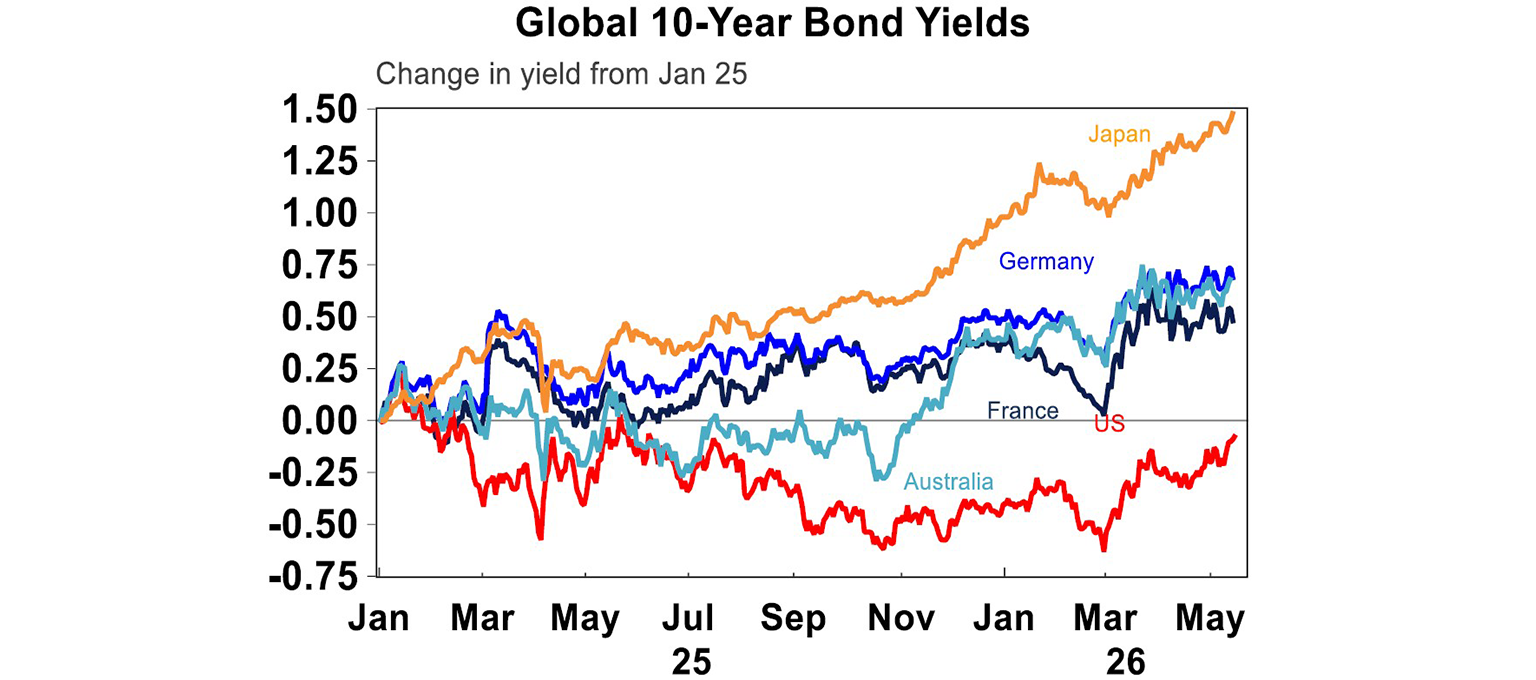
Bond yields rose further this week, continuing their rising trend since February. The US 10 year is now at 4.59% from just 4.35% last week, on the back of better economic data from US consumers as well as hotter than expected inflation numbers.
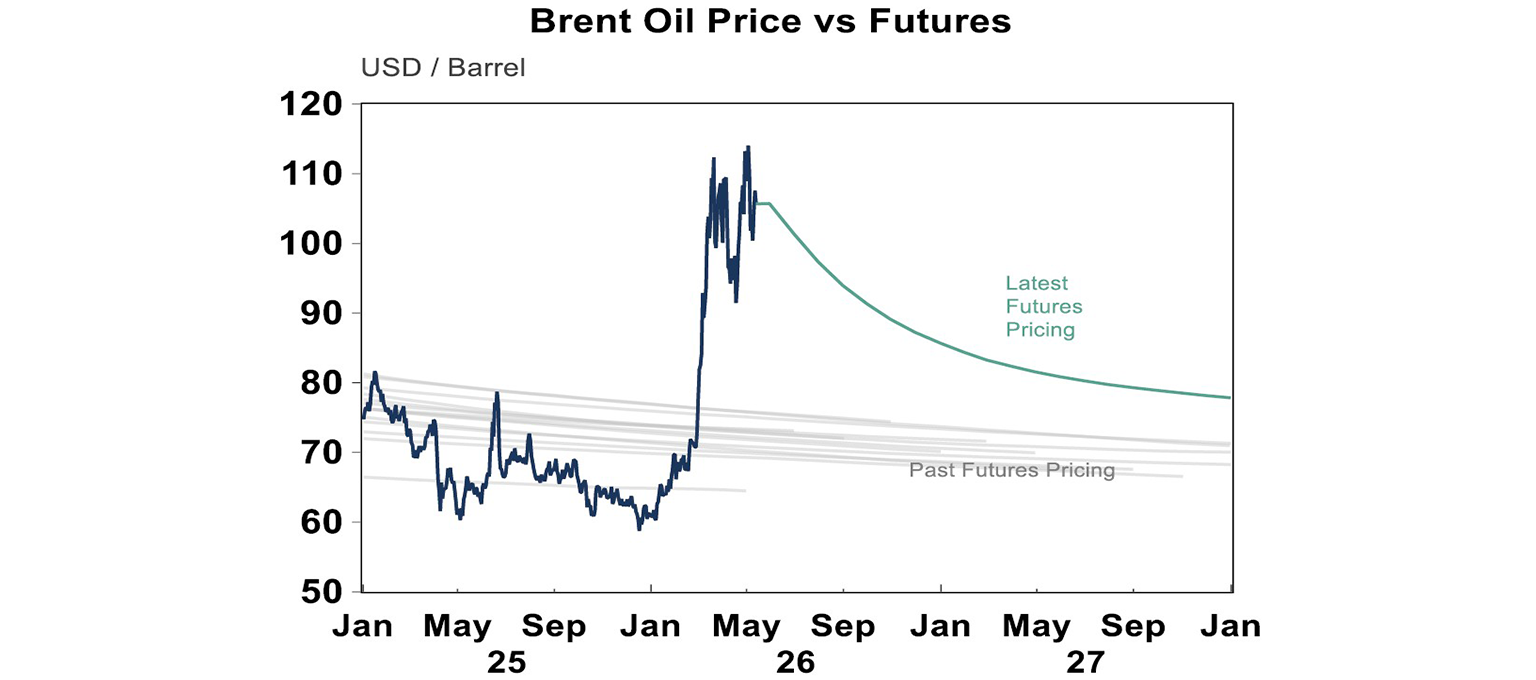
Meanwhile other asset classes have been mostly rangebound, with oil prices hovering between US$100 and US$110/bbl and the futures curve still in deep backwardation. This suggests oil supply remains tight, although markets still expect the situation to ease in the near term.
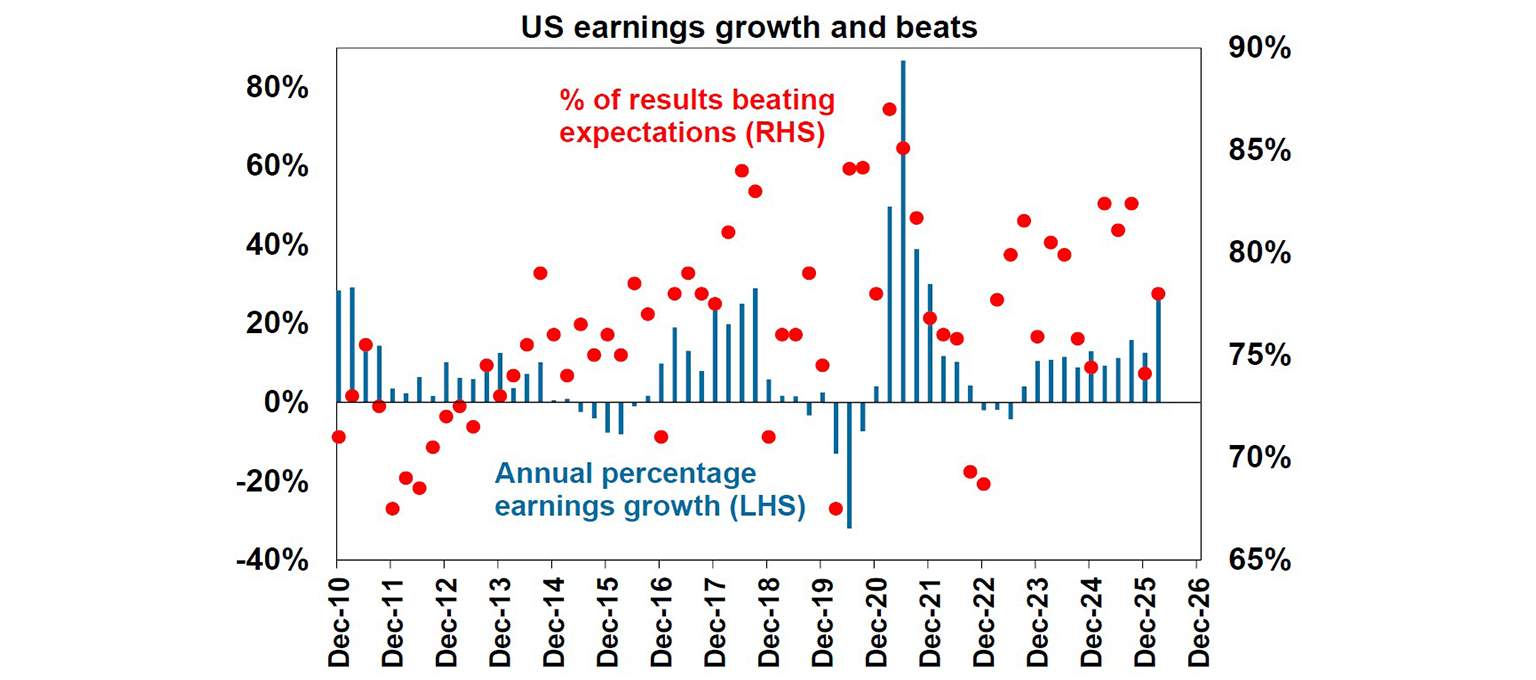
The main driver of markets is certainly booming US profits. With the 1Q earnings season almost over, 78% of US S&P 5000 companies have beaten expectations and consensus earnings growth has reached 28%yoy, which is the highest level in almost five years. Profits are not equally distributed however, with tech shares showing 60%yoy earnings growth while healthcare and telecom are posting earnings declines.
With Hormuz still effectively closed, there is clearly a discrepancy between markets’ optimism and the downside risk to global economic growth. Only about 3% of the pre-war volume of ships is still passing through the Strait over the last week. However, thanks to the diversion of oil to other pipelines, more supply from outside of the Middle East, consumers pulling back demand, and countries starting to use up reserves; the global economy is still coping so far (the International Energy Agency estimated that global supply is now down by around 13% since February in its latest report). However, inventories will be drawn down eventually and oil demand will have to be cut back more significantly if supply does not resume. The IEA also estimates that global markets will remain “severely undersupplied” until end of September, even if the conflict ends by early June – which now seems to be an optimistic forecast! Our base case is still that Trump will TACO more decisively given mounting political pressures in the US, the only issue is that the ball is also in Iran’s court at the moment.
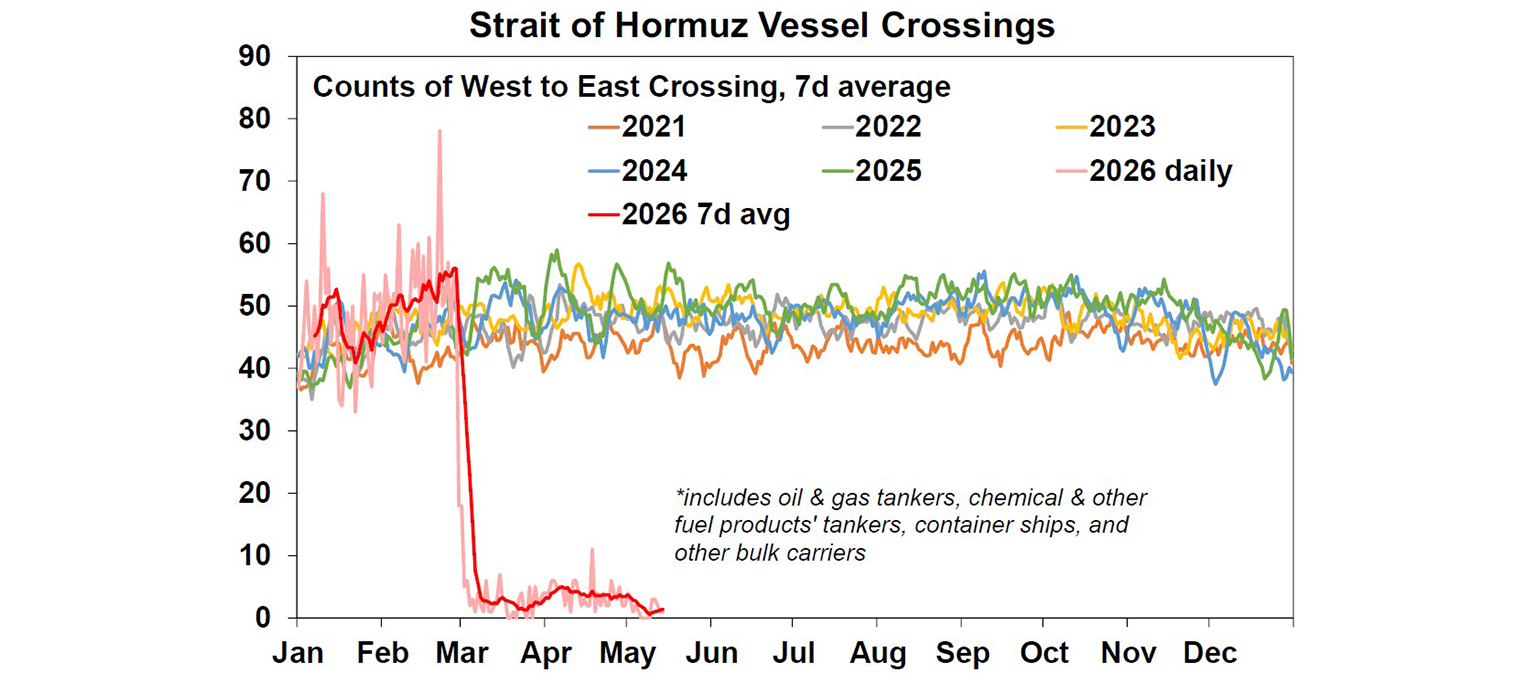
As a result, Trump’s main priority during his visit to China this week was to convince China to pressure Iran to step back and reopen the Strait. Opening Hormuz is clearly in both countries’ interests, especially because half of China’s crude oil imports come from the Middle East, including around 12% from Iran. But China’s large reserves and the much-needed boost that higher energy costs are giving to Chinese inflation both suggest Beijing is not under immediate pressure to act, despite the US Treasury Secretary Scott Bessent stating that China would be working behind the scenes to help reopen Hormuz.
While lacking big ticket announcements so far, the meetings (which included large group of US corporate executives including Tesla’s Elon Musk, NVIDIA’s Jensen Huang, and Apple’s Tim Cook) showed that we are clearly past the worst in terms of trade wars and tariffs. Readouts from both sides included notes on more investment opportunities with a new “Board of Trade”, there were talks of China buying more beef and energy from the US, and the US could potentially ease more tech controls as well as remove tariffs for “non-critical areas and areas that [they’re] not trying to reshore”. My favourite quote coming out of this round of meetings is surprisingly not from Trump (who went quiet for 20 hours on Truth Social which is unheard of!), but from Scott Bessent: “Something like fireworks are very low-end consumer goods that are going to keep coming from China no matter what — so we can un-tariff those”! It really shows that even though the US has significantly reduced its goods trade deficit with China, through a combination of diverting goods and importing through other countries, there is always a degree of dependency between the US and China, because of their long-established strengths in different industries.
The lack of progress on Taiwan also suggests that, once tariff and Hormuz issues ease, the next global chokepoint is likely to involve Taiwan (which produces 60% of the world’s semiconductors) or the Taiwan Strait (which carries more than one-fifth of global maritime trade).
The most “ambitious” budget in years, aiming to tackle poor productivity, low economic growth, high inflation, low housing affordability, and generational inequity is finally out! (you can read our detailed analysis here or get them in our latest podcast episode). Whether or not you personally benefited from the policy changes, it’s hard to deny these were the most exciting in a long time, especially with significant tax tweaks to gear investors away from the established homes market and towards startups and new builds – areas that showed the Government is willing to use its political capital to do tax reforms. Specifically, negative gearing to offset other income is no longer permitted for existing homes; it is now restricted to new residential properties, shares, and commercial real estate. Meanwhile, the 50% capital gains tax discount for all assets except new homes is going to be replaced by the full taxation of real gains, at a minimum tax rate of 30%.
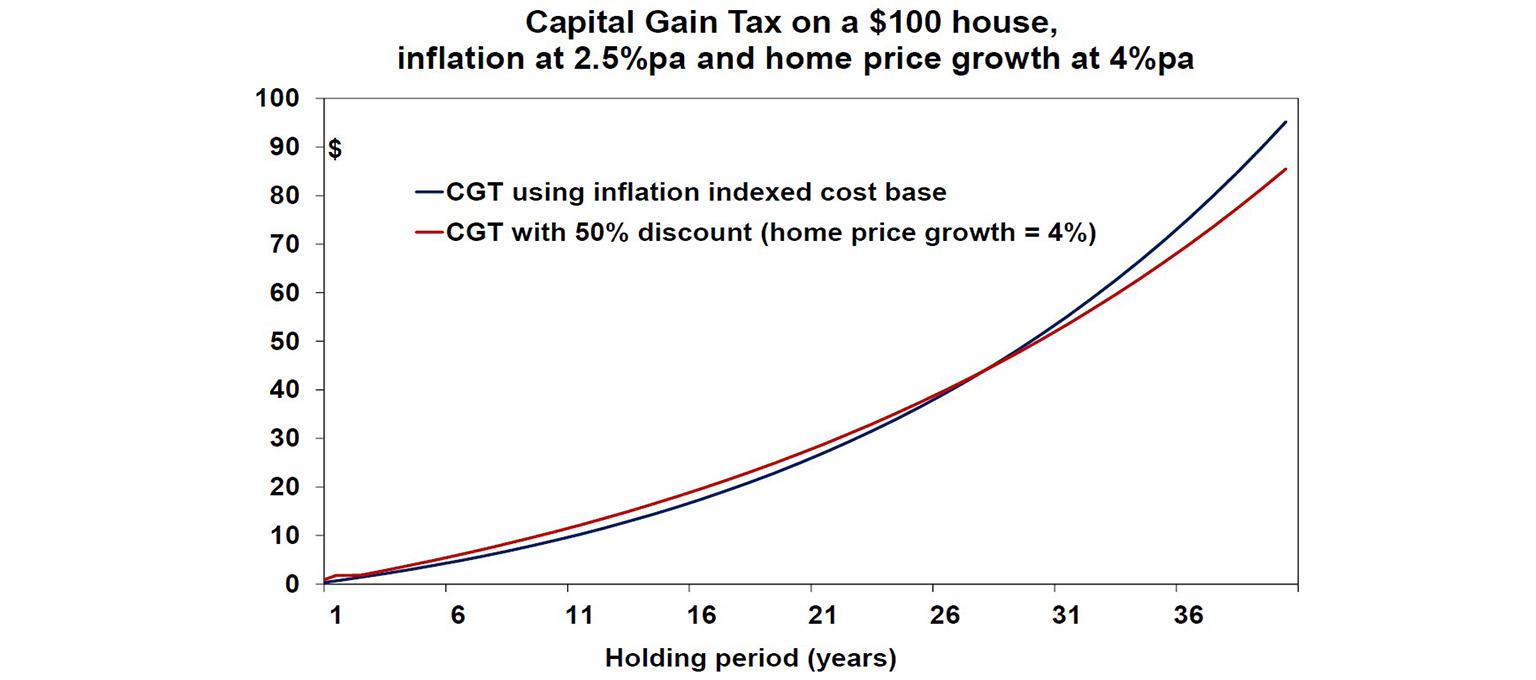
Treasury modelling suggests that these “reforms” will bring in on average 7,500 new home buyers each year in the next decade – which is about 6% of the first home buyer market. This modelling also suggests a minor decline in housing supply of 35,000 over the next ten years and a rise in rents of less than $2 per week. Overall, we think the housing market will see a minor downturn of around 5% from the loss of the marginal buyer (aka the investor) – but shifting the buyer base does not necessarily solve the structural undersupply in Australia in the short term: Keep in mind that back in 1985-99, Australia also used a cost-based indexation scheme to tax capital gains (that was removed to make the system simpler), and house price growth still averaged 5.9%pa! However, shares will become more appealing relative to properties, superannuation will benefit as an investment vehicle as they retain their 33% CGT discount; and there will likely be a shift to dividend stocks (as capital gains taxes increase with inflation indexation over longer holding periods).
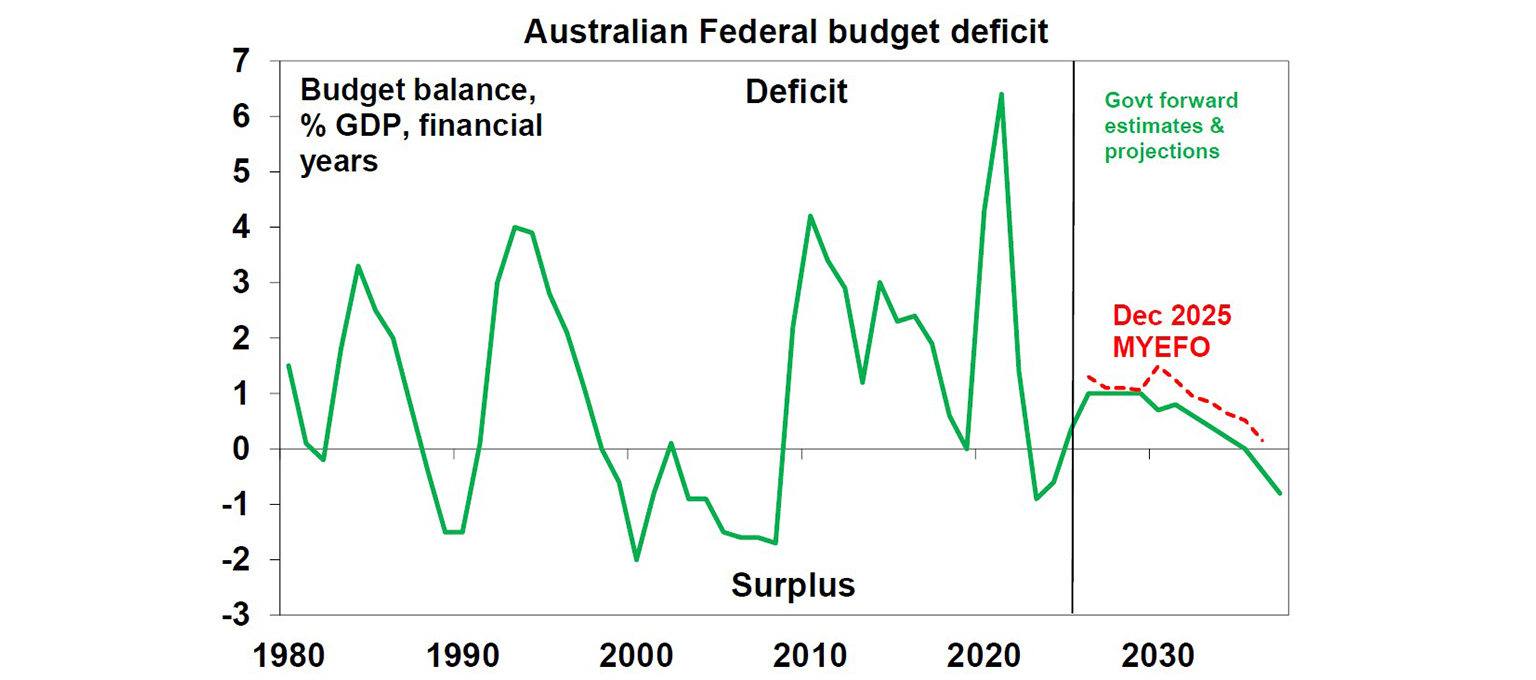
There were also some other smaller changes that showed the government is starting on the right path towards reining in spending and improving productivity: we are seeing smaller deficits compared to previous forecasts at around 1% of GDP, the government is saving the extra windfalls from commodity prices and a better labour market, there was some reduction in compliance costs and extra tax concessions for small businesses, as well as spending cuts in several areas including the NDIS and public service. Workers are also getting a combination of a cut to the bottom tax rate, a $250 income tax offset, and a $1000 standard deduction which will amount to roughly $11/week cut in each of the next two financial years. These are all moves in the right direction. But it would be much nicer to see a more serious effort to contain government spending, a faster return to budget surplus without relying on bracket creep & the working age population, and a more comprehensive tax reform (rather than just tax hikes). A lot of the government savings are backloaded in later years, and so in the near term the Federal Budget (together with the handouts in some state budgets) is still mildly stimulatory which means our expectation for an RBA hike in August remains intact. Over the longer term, higher government spending ultimately means higher debt burden for later generations and a more inflation prone environment.
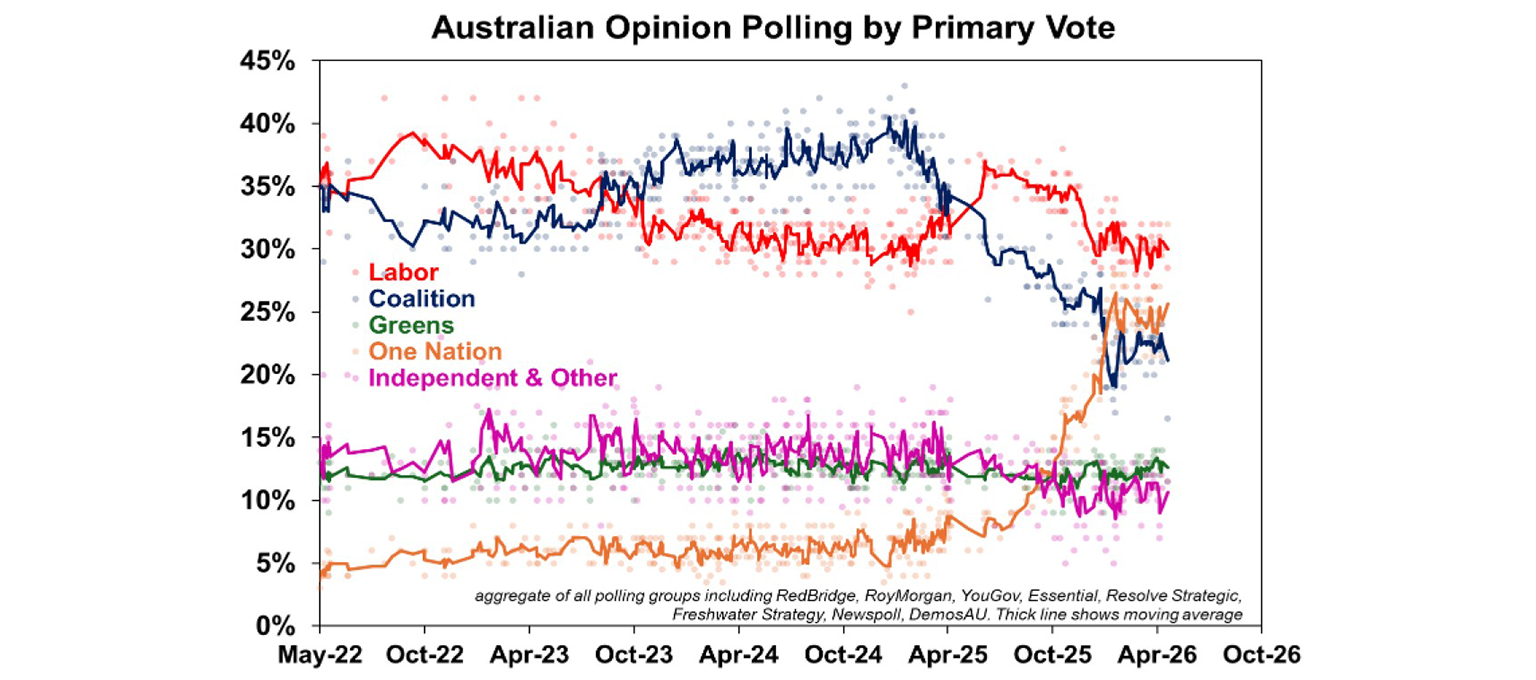
The Opposition’s budget reply promised to repeal the changes to CGT and negative gearing and to index the tax brackets to inflation (starting with the two lowest brackets in 28-29 and the top two thresholds from 31-32). The Coalition also proposed higher defence spending, extra asset write-offs for small businesses, capping migration to the number of new homes built, and tighter limits on welfare and government services for non-citizens, including permanent residents, as it seeks to lift its polling which still trails One Nation by 5 percentage points. We think that indexing the tax brackets is the right thing to do, in order to lower the tax burden on the working age population and encourage more productive work in the economy. But realistically, for the government to deliver income tax cuts, there must be hikes elsewhere, for example, raising the GST rate from the current 10% or expanding the list of goods and services subject to the GST.
Major global economic events and implications
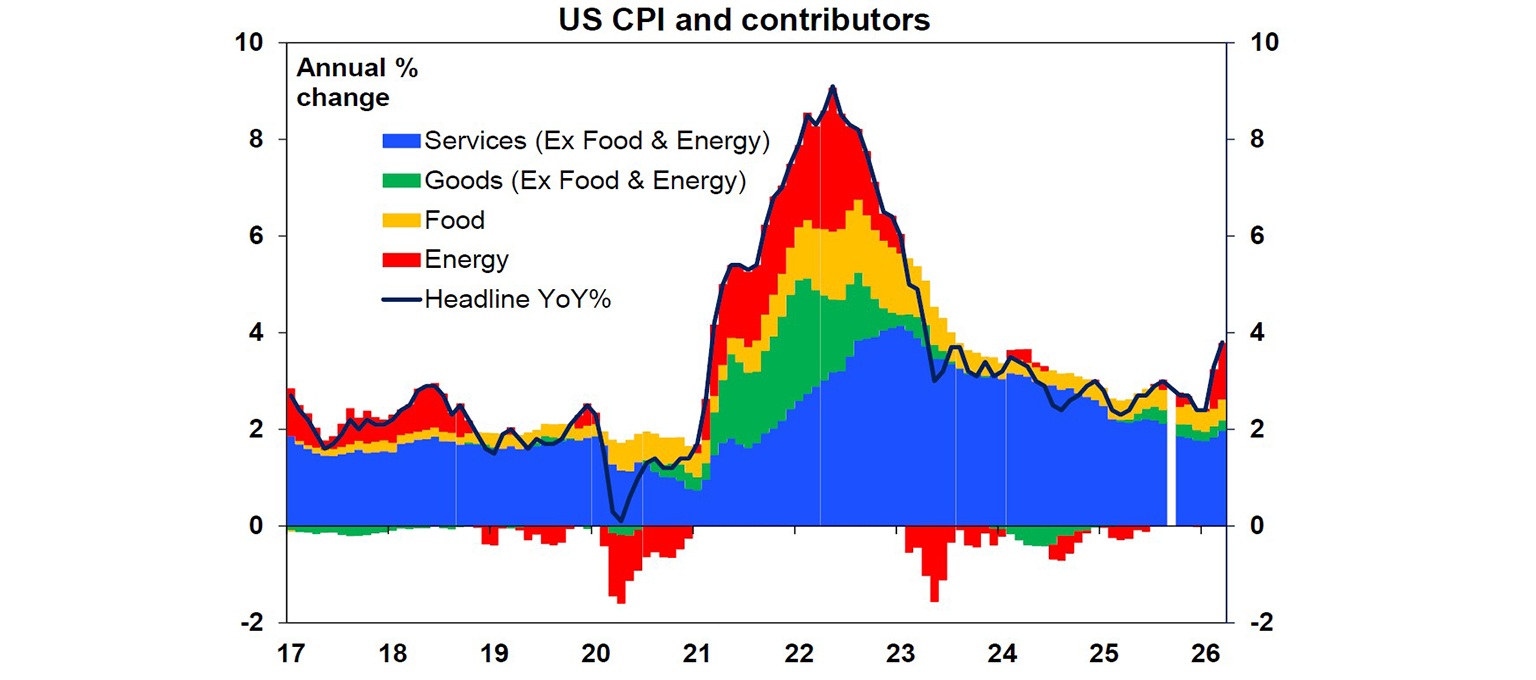
US consumers are starting to feel the impact of higher energy prices (with more to come), as both the consumer and producer price indices for April surprised on the upside. Consumer inflation saw monthly growth of 0.6% and annual change rising to 3.7% (from 3.3% last month). It was driven by a whopping 17.9% annual increase to energy costs, with some price rises bleeding into energy related services such as airfares. There was also a large acceleration in rents (partially due to the government shutdown in October, which saw many unit rental prices not being surveyed and artificially depressed until this month). Meanwhile, producer price indices which are a good read for underlying price pressures and tend to lead consumer prices, also posted a 1.4% monthly rise (up from just 0.7% in March). Markets have taken comfort in the much milder core figures of 0.4%mom/2.8%mom, as core goods prices were down versus last month (another evidence of tariffs past the peak) and discretionary services prices also pulling back slightly as consumers reshuffled their spending baskets.
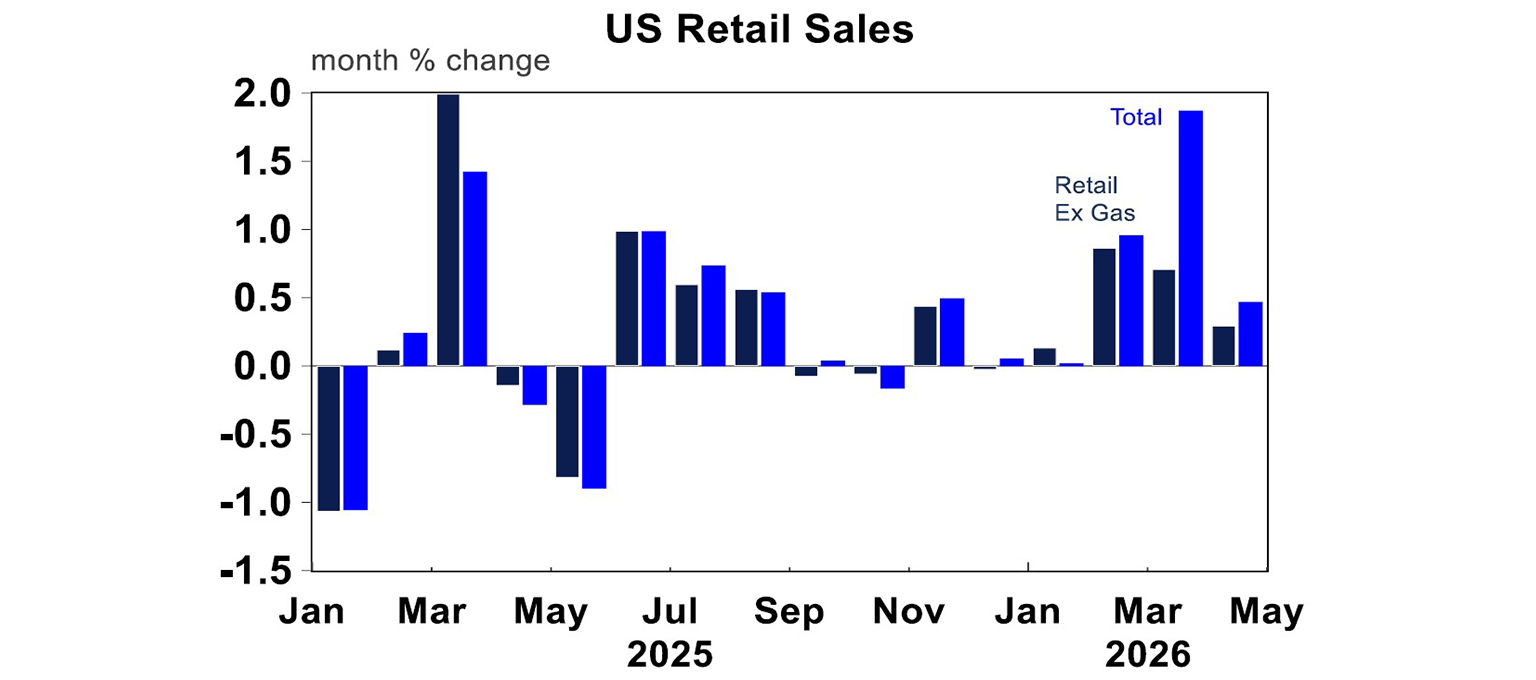
Similarly, in April’s nominal retail data, US consumers spent 0.5% higher in sales compared to March, driven by higher gasoline prices. Meanwhile, other spending only increased 0.3% over the month, while last month’s headline figure was downwardly revised. So far, US consumers have seen tailwinds with last year’s tax cuts (with tax refunds coming in since mid-April), which explains the continued resilience in overall economic data, but tax impacts will gradually fade in upcoming months.
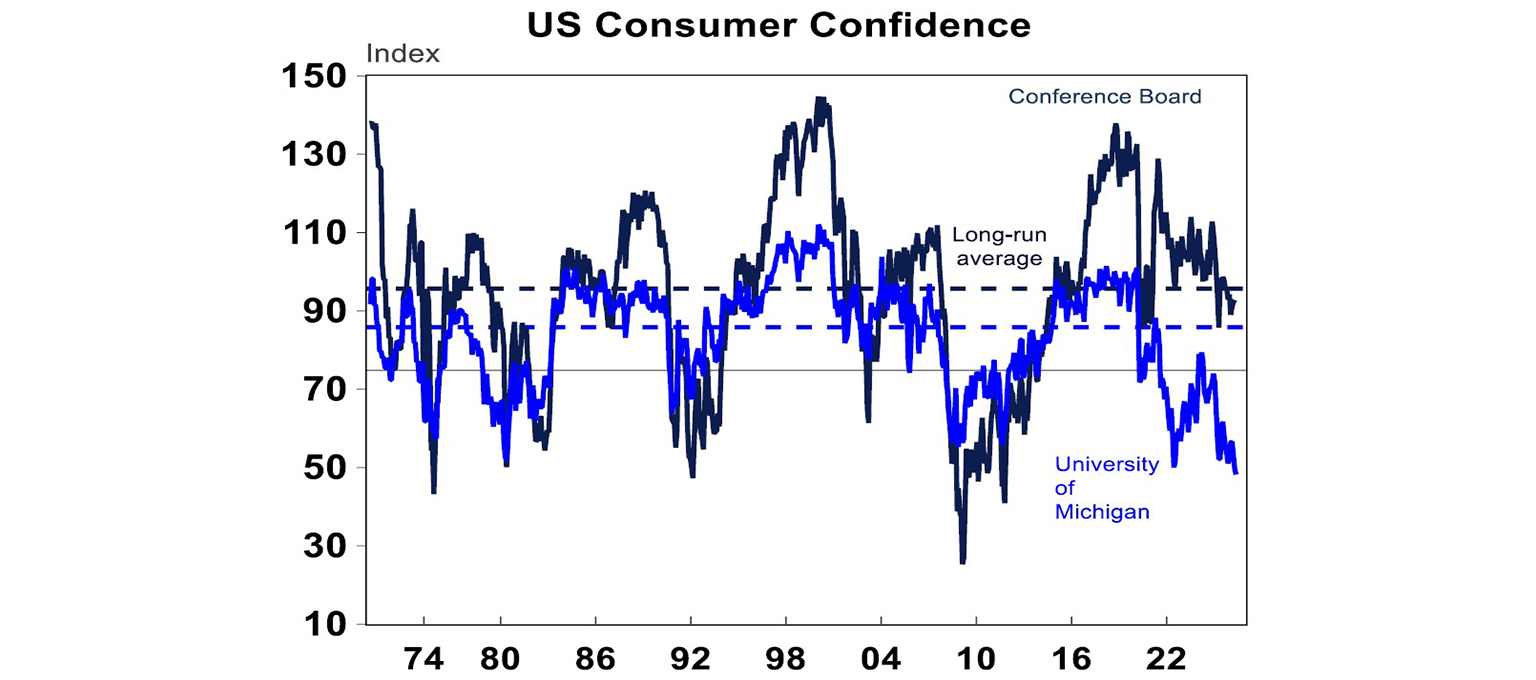
Unsurprisingly, US Michigan consumer sentiment plunged further into a new record low of 48.2 in the May preliminary reading. The other sentiment reading by the Conference Board has held up better around historical averages, however, given its higher weight on the still resilient labour market.
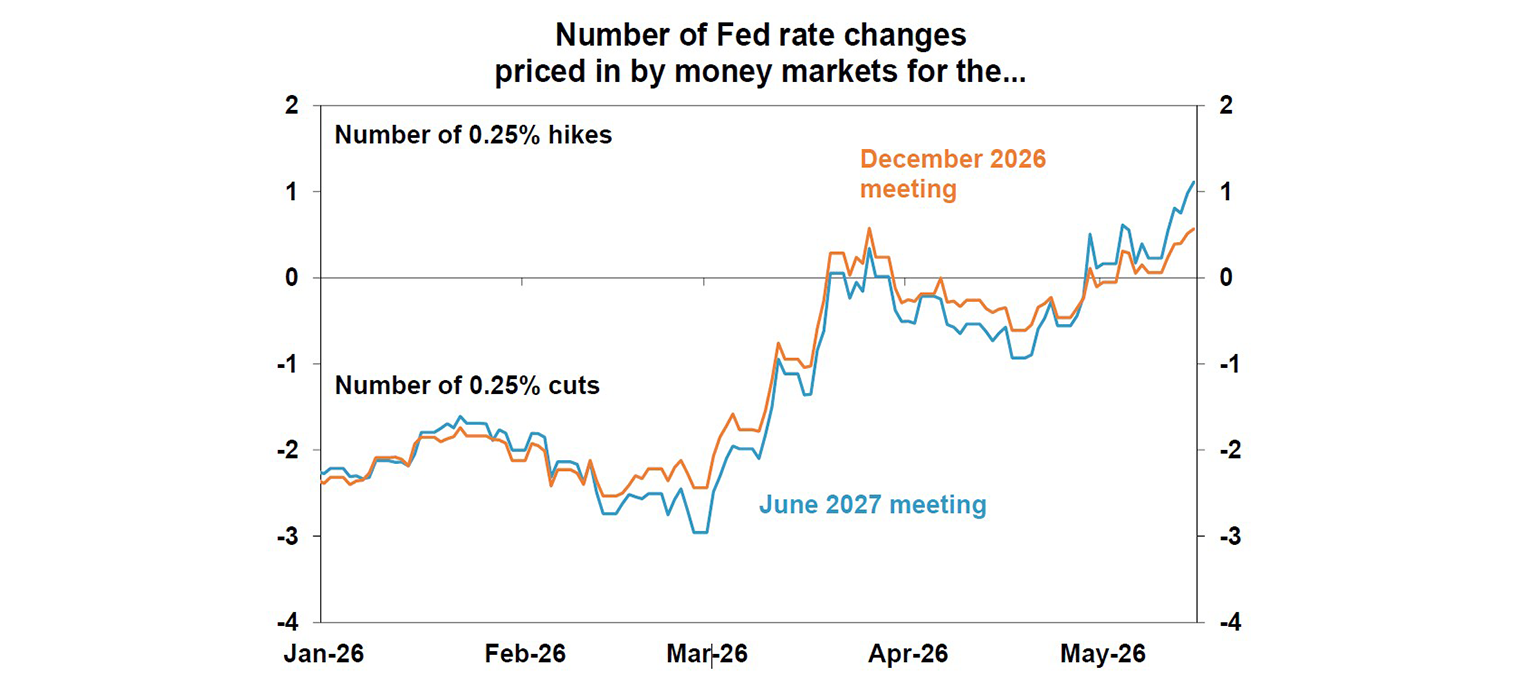
Whether the high inflation story is “transitory” really depends on when Hormuz reopens. But given the consumer’s strong starting position, we think the risk of energy inflation spreading through the rest of the CPI basket is high. As a result, US markets are now pricing in a full rate hike over the next year, rather than cuts, despite Kevin Warsh (a Trump appointee)’s confirmation as Fed Chair this week. The 55–45 vote was the narrowest ever for a Fed Chair, underscoring concerns about Fed independence amid the government’s preference for lower rates. Even so, with Powell staying on as a governor & Miran leaving the post, it is unlikely that we will see a rate cut anytime soon. The Fed is likely to remain on hold at least for the next six months.
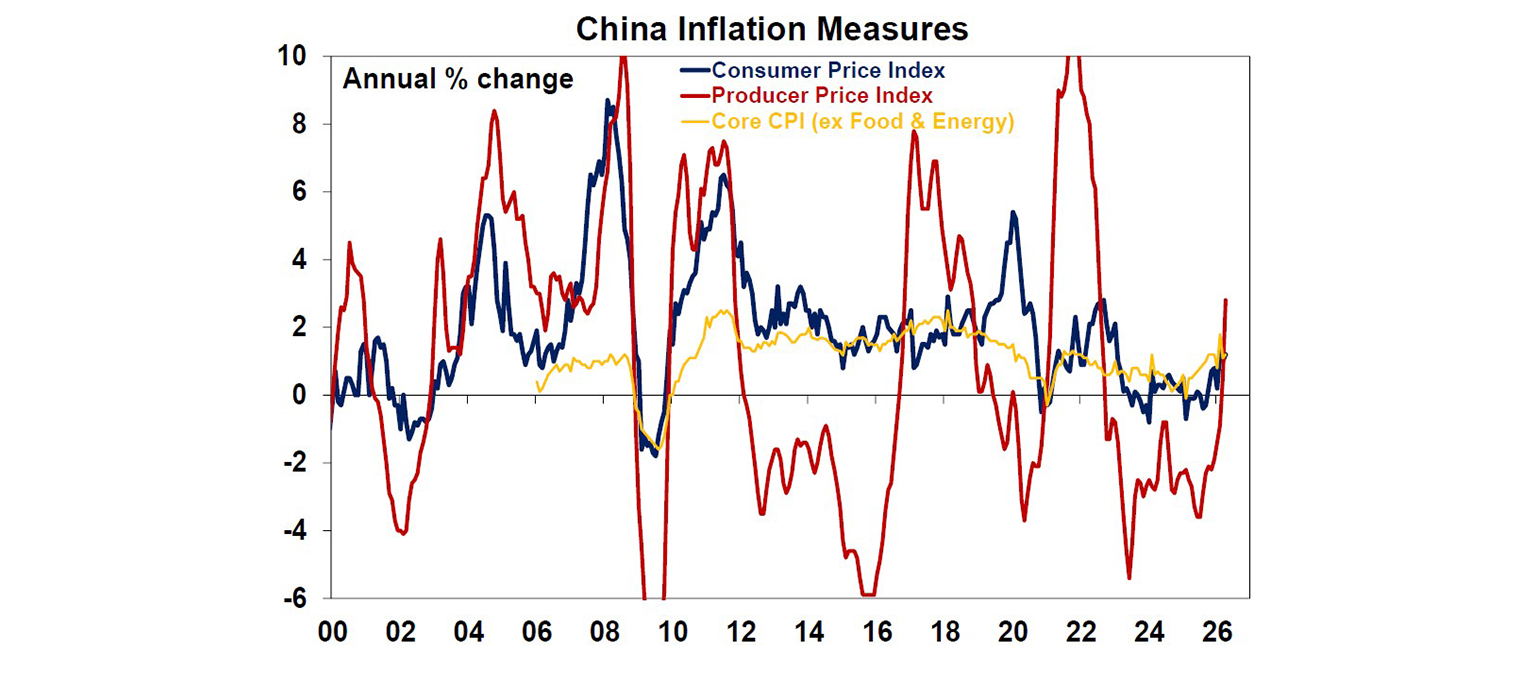
Chinese inflation data surprised on the upside for the third consecutive month, as the headline consumer price accelerated to 1.2% over the year to April (vs 1.0% in March and just 0.9% forecast by economists), while the producer price index surged to 2.8% on an annual basis from 0.5%yoy prior. The strong figures were led by upstream sectors and materials such as petroleum, coal, metals, fibres and textiles; however, core CPI has also clearly trended up since last year, rising by 1.2%yoy (up from 1% in March). Overall, service prices (which can serve as an indicator of domestic demand) remain relatively subdued at 0.9%yoy. However, there is evidence that the government’s anti-involution policy is having a positive impact in several manufacturing sectors, supported by steady global demand.
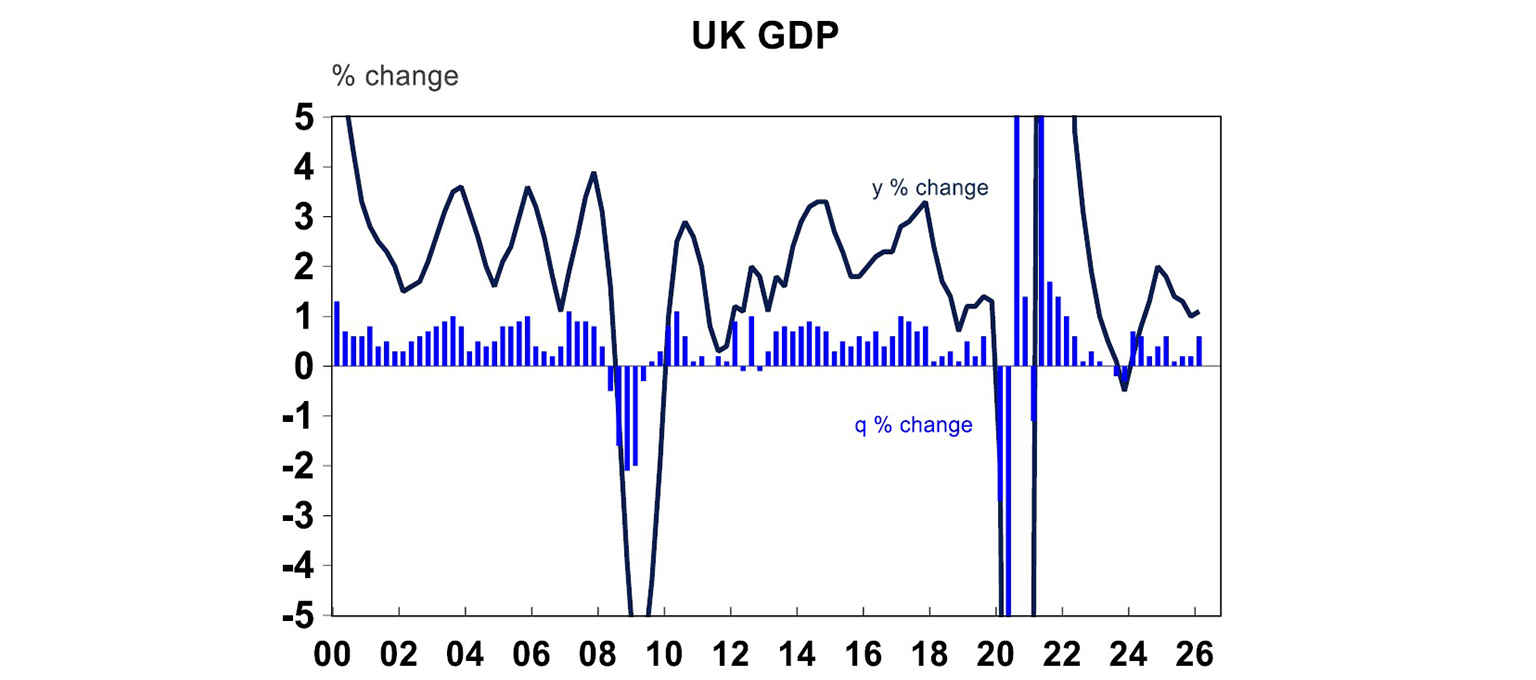
The UK economy had a good start to the year as 1Q GDP rose by an okay 0.6%qoq/0.8%yoy, in line with consensus. Household and government consumption were the main drivers. However, some economists question the strength of the result, as seasonal adjustment has tended to overstate first quarter growth since the pandemic. The outlook is also fragile, especially with uncertainty around fiscal policies as UK Prime Minister Keir Starmer is struggling to hold on to leadership.
Australian economic events and implications
Business surveys taken in April in Australia were… bad – no skirting around that! Business surveys, similar to recent consumer surveys, are increasingly pointing to stagflation with business confidence at -24, around the lows seen during the GFC and prices spiking the most since 2022. Business conditions at +3 have now ticked down for four months in a row and the new orders survey is solidly negative at -5, well below its long run average. Employment intentions are also down to the lowest level since 2022. It is clear that rate hikes and volatile energy prices are now beginning to bite into economic activity and investment intentions.
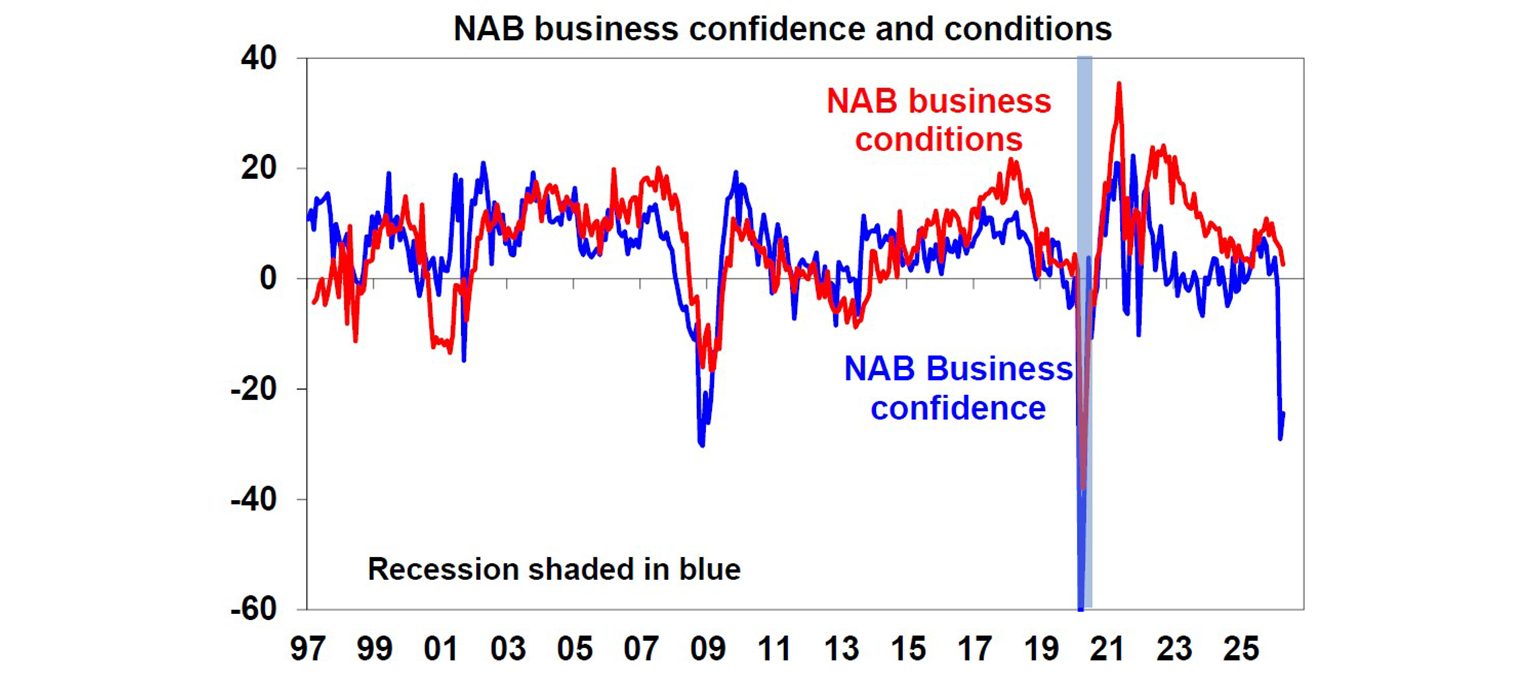
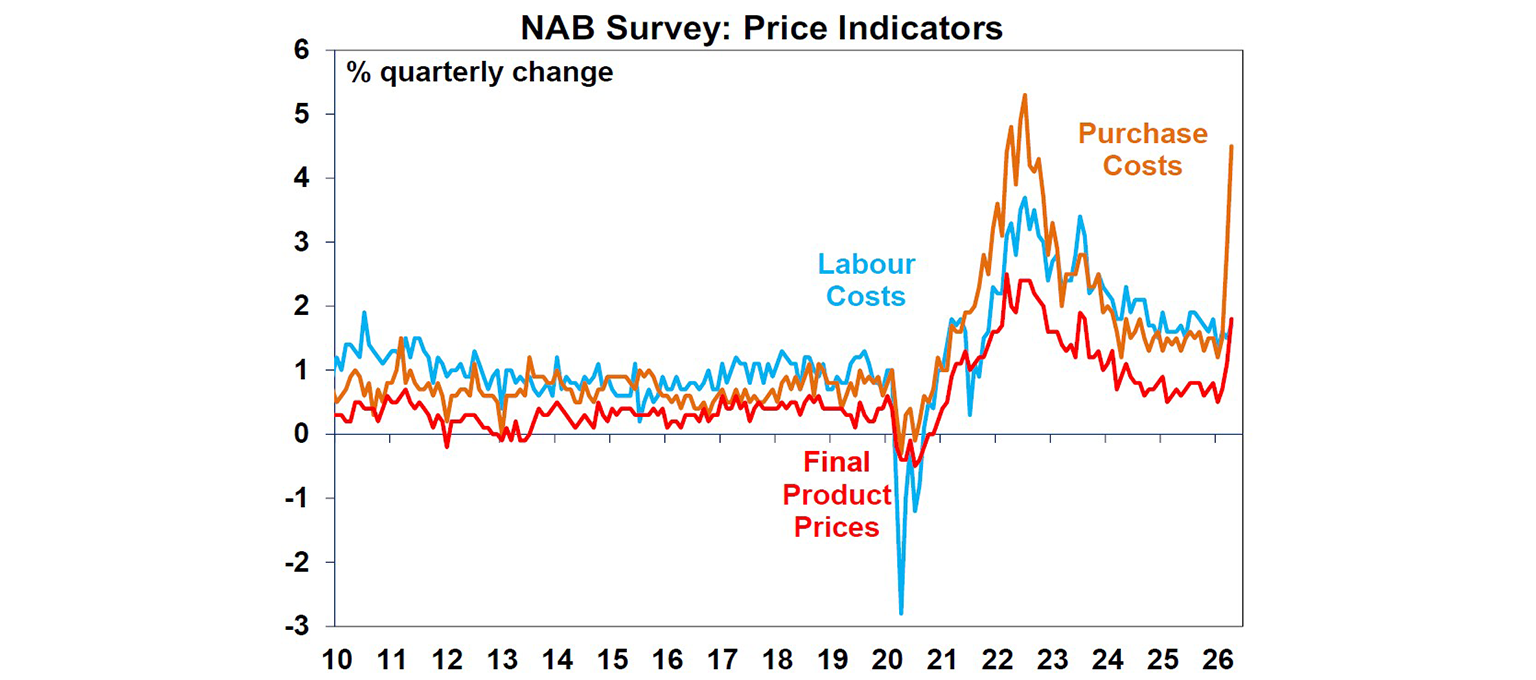
Yet, it does not mean the RBA can stop hiking rates, given how much prices have risen lately. Quarterly input cost growth has spiked to 4.5% in April according to the NAB survey, triple the pace in February – the only other time it has reached this level was during the 2022 inflation spike. We also know from back then that sharp rises in purchase costs for firms will translate into faster consumer price growth, especially when they were starting from a solid base (aka low unemployment rates).
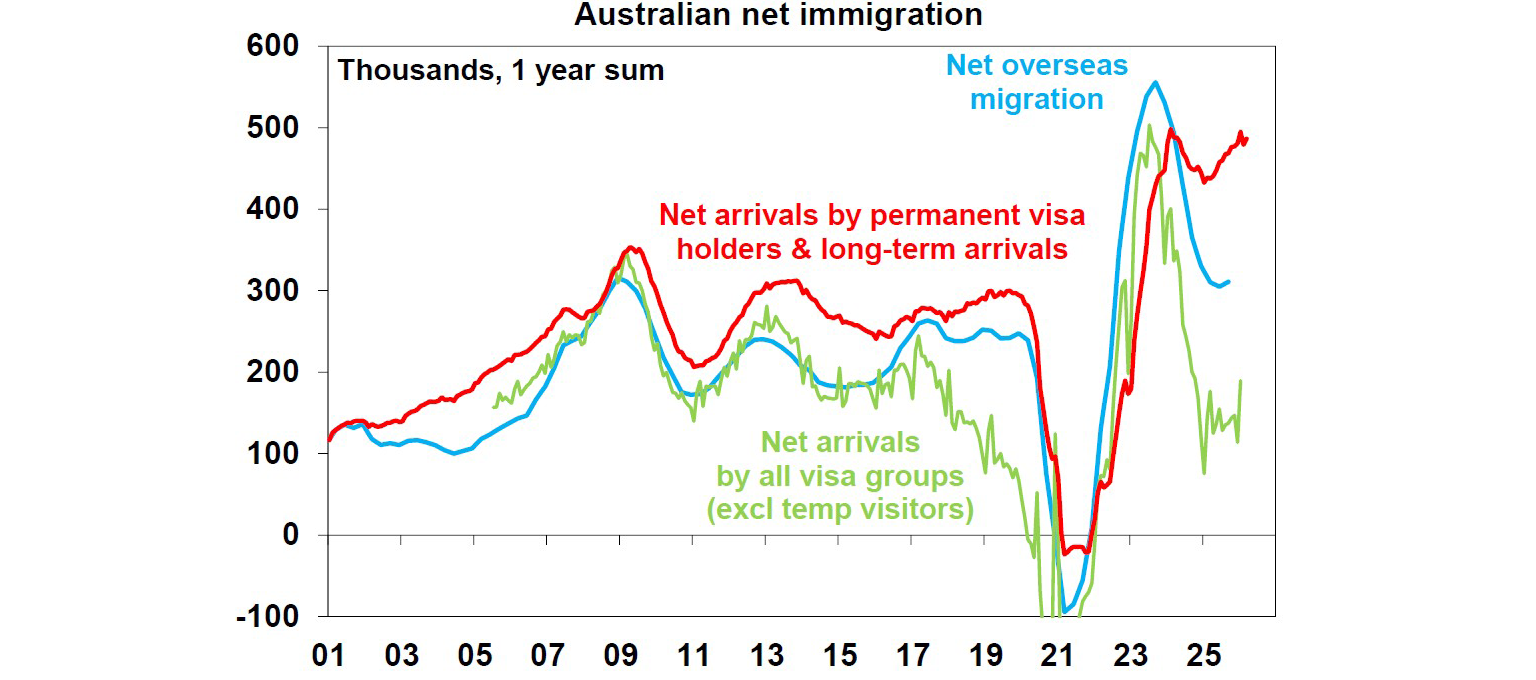
Arrivals and departures data using the number of border crossings are trending up lately. They are not perfect indicators for net overseas migration levels, but if the uptrend continues, we can potentially see an overshoot of the Treasury forecast for net migration to decline to 295k in net migration this financial year (from 306k last year).
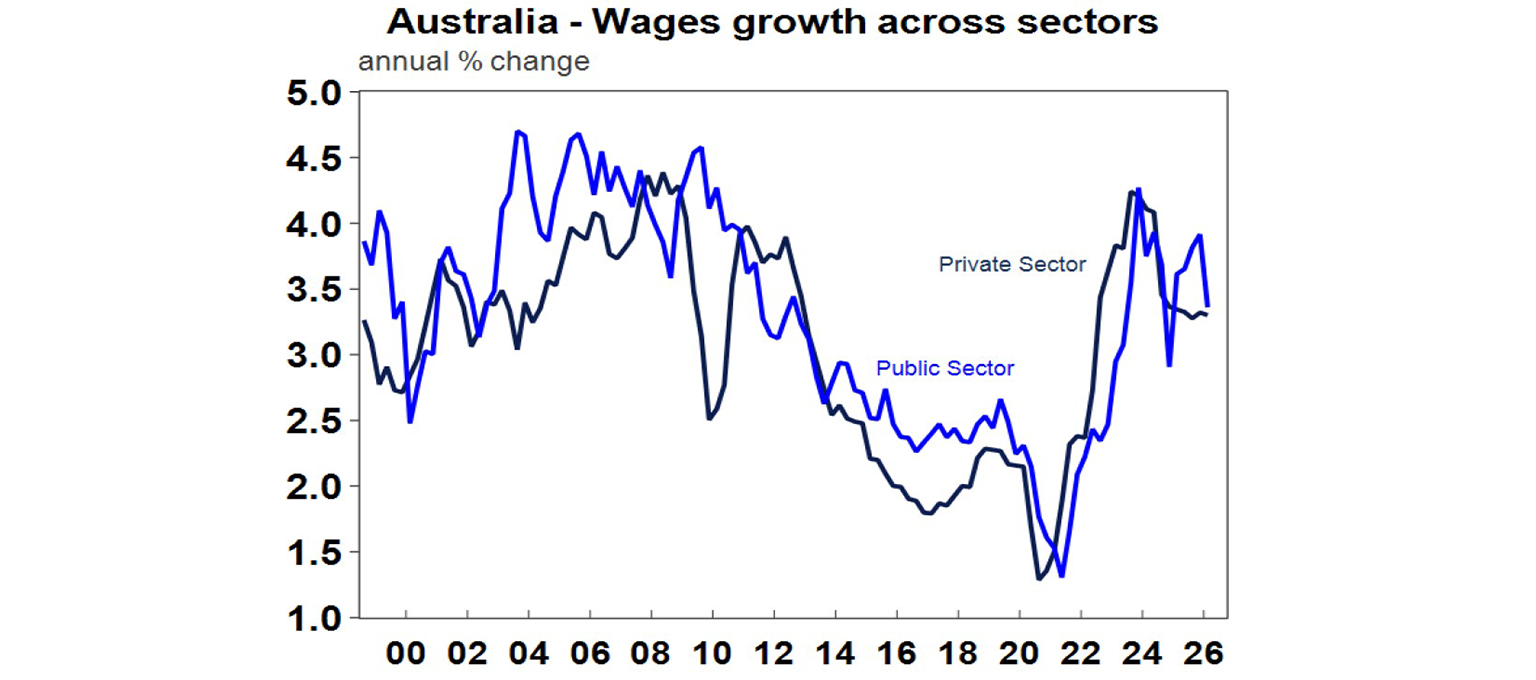
Wages rise in Australia has been stable at 0.8% over the quarter, or 3.3% on an annual basis. This means that the average worker is seeing real wages decline again (given that inflation is higher at 4.1% over the year). So far, wages trend has reflected the stability in the labour market since late last year, with jobs growth and wage rises supported by both the public (0.5%qoq) and private sectors (0.8%qoq). The future outlook for wages growth in Australia is mixed: surveys from companies show that employment intentions are shaky given the negative outlook from supply issues and rate hikes, both of which lead to lower company margins and lower wages on offer; however, some recent wage announcements from States’ EBAs or the ACTU are asking for above inflation rises which would certainly add to wage pressures (and potentially high minimum wage increases this coming financial year as well). We believe the RBA is also wary of these pressures and will hike once more this cycle.
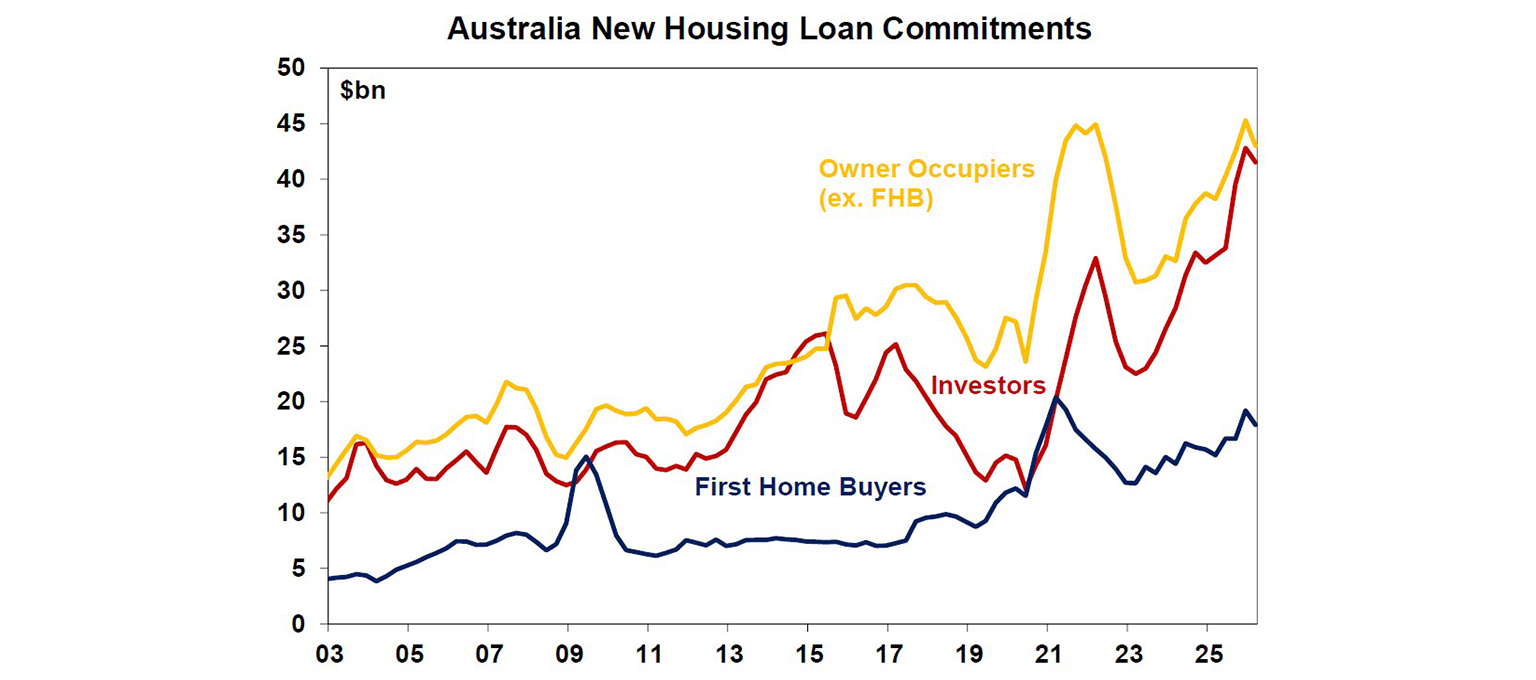
Housing finance weakened in the March quarter by 3.8%qoq, driven by slowdown in all buyers’ groups, on the back of rate hikes, uncertainty about the Middle East war, and worries about changes to government policies for investors. First home buyers’ lending slowed the most (-6.7%qoq), as both number of loans and average loan size dropped. Meanwhile, new loans to other owner occupiers and investors declined by 5% and 3%, respectively (with loan sizes in these two groups still climbing by about 2% through the March quarter). But also keep in mind that these are relatively small falls: new housing loan commitments are still up by 18.5% over the year, driven by strong increases in investor loans (which are now almost double the level in early 2023). Overall, expect some more slowing in lending ahead, given a challenging economic backdrop with more rate hikes and less tax incentives for investors going forward.
What to watch over the next week?
Markets would probably go back to focusing on Hormuz next week with the Federal Budget now over! Global Purchasing Managers’ Indices for May will be released next Thursday. They provide an early indicator of how global firms are coping amid limited oil supply as well as overall business price pressures.
In the US, we’ll see a range of property market data which includes the NAHB Housing Market Index (Tuesday), pending home sales (+1.6%mom) on Wednesday, as well as housing starts (-4.5%mom) and building permits on Thursday.
In Australia, expect the labour market to remain stable in April with an unchanged unemployment rate of 4.3%, employment growth of 15,000, and the participation rate still around historical highs at 66.8%. The Westpac Consumer Confidence Index is out on Tuesday which will likely remain in negative territory, but it will be interesting to see the difference in confidence before and after Budget release.
China’s monthly activity data is out on Monday, which will likely show the economy posting continued improvements in credit growth, retail sales, and industrial production, despite more declines in home prices and property investments.
Outlook for investment markets
Global and Australian share markets have likely seen the worst from the War and oil shock if the flow of oil quickly resumes but the risk of further falls taking us to a 15% top to bottom correction remains high given uncertainty around the peace talks and flow of ships through the Strait along with still stretched valuations, political uncertainty associated with Trump & the midterm elections and worries about private credit and the impact of AI. However, returns should still be positive for the year as a whole thanks to Fed rate cuts likely later in the year, Trump still likely to pivot to consumer-friendly policies and solid profit growth.
Bonds are likely to provide returns around running yield.
Unlisted commercial property returns are likely to be solid helped by strong demand for industrial property associated with data centres.
Australian home price growth this year is likely to slow to around 3% or less due to poor affordability, RBA rate hikes, reduced near term investor demand resulting from Budget moves to wind back negative gearing and the capital gains tax discount and the hit to confidence from the War.
Cash and bank deposits are expected to provide returns around 4.25%.
The $A is likely to rise as the interest rate differential in favour of Australia widens as the Fed holds then cuts and the RBA hikes. Fair value for the $A is around $US0.72.
You may also like
-

Oliver's insights - Why have Australian living standards “fallen” and how do we fix it? For the last few years there has been much talk of a “cost-of-living” crisis in Australia and of “falling living standards”. This has flared up again lately with the pickup in inflation resulting in a renewed fall in real wages. -

Weekly market update - 10-07-2026 Ceasefire over but markets are also over the war, Why oil prices can't go too low or too high, Is AI adding to inflation risk or taking it away, and Australia’s wage problem. -

How to protect yourself from phishing and impersonation scams Phishing scams can look like everyday messages – emails, texts or calls. Learn the signs and simple steps to protect your money and personal information.
Important information
Any advice and information is provided by AWM Services Pty Ltd ABN 15 139 353 496, AFSL No. 366121 (AWM Services) and is general in nature. It hasn’t taken your financial or personal circumstances into account. Taxation issues are complex. You should seek professional advice before deciding to act on any information in this article.
It’s important to consider your particular circumstances and read the relevant Product Disclosure Statement, Target Market Determination or Terms and Conditions, available from AMP at amp.com.au, or by calling 131 267, before deciding what’s right for you. The super coaching session is a super health check and is provided by AWM Services and is general advice only. It does not consider your personal circumstances.
You can read our Financial Services Guide online for information about our services, including the fees and other benefits that AMP companies and their representatives may receive in relation to products and services provided to you. You can also ask us for a hardcopy. All information on this website is subject to change without notice. AWM Services is part of the AMP group.