





Australian home prices continue to slide and look likely to see a 15% fall
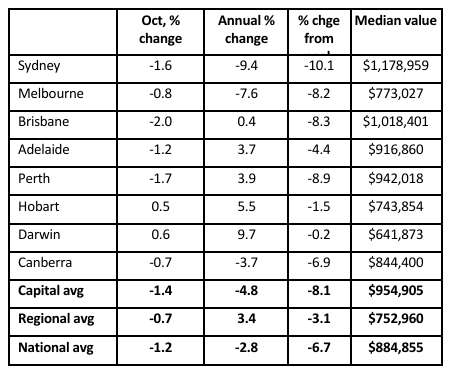
The slump in national average home prices continued in October with prices down another 1.2% according to Cotality, their seventh monthly fall.
5 mins

Key points -
- The slump in national average home prices continued in October with prices down another 1.2% according to Cotality, their seventh monthly fall.
- The rapid decline, more rate hikes than expected and rising unemployment combined with the structural change associated with the tax hikes on investors suggest that the top to bottom fall is now likely to be around 15%.
- Prices aren’t expected to bottom until around the September quarter next year and should start a modest recovery in 2027-28 as the RBA shifts to rate cuts.
- The home price slump will weigh on economic growth via negative wealth effects, but it’s not significant enough yet for the RBA to shift gears toward cutting rates given high inflation is the more pressing problem. But it likely will be by the second half next year.
Introduction
Cotality data shows national average home prices fell 1.2% in October, with capital city prices down 1.4%.
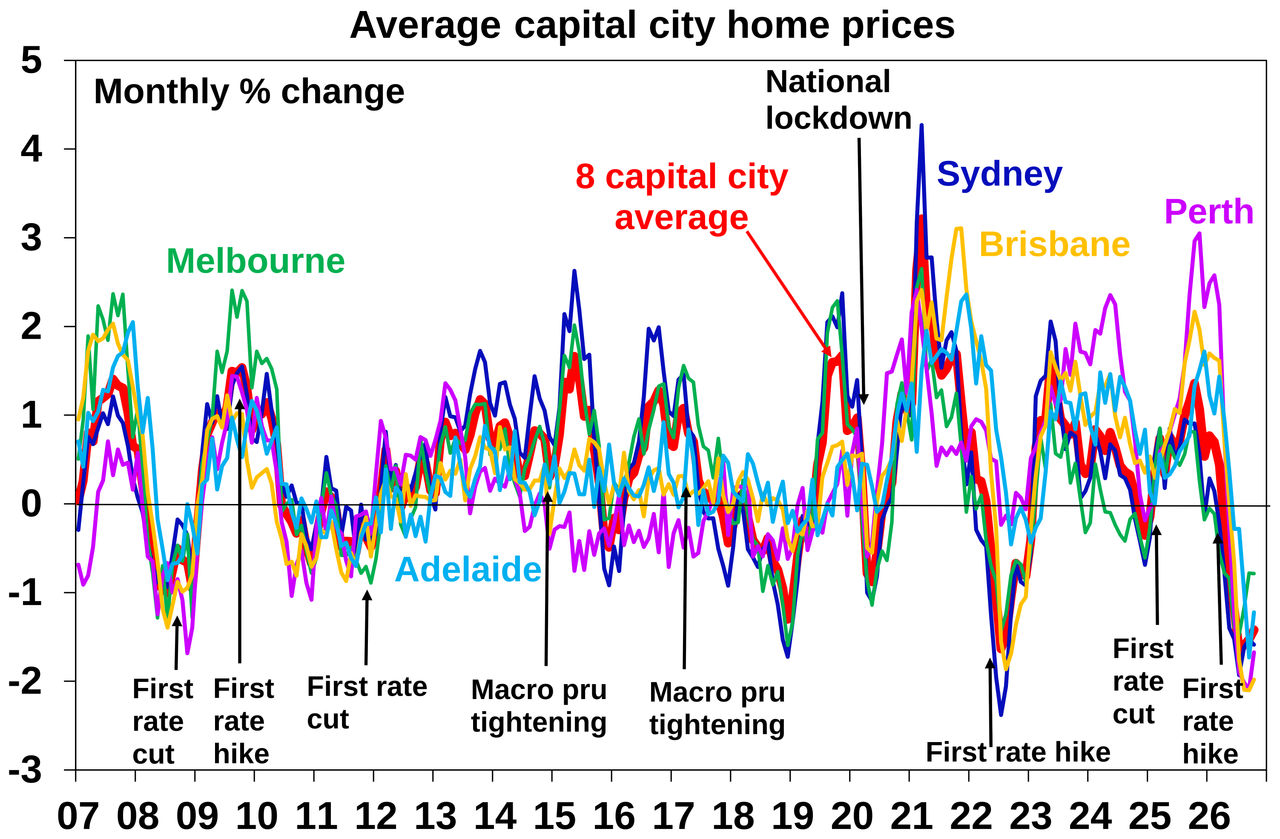
The downturn reflects a perfect storm for the property market of rate hikes, the Budget tax hikes on investors, poor affordability and poor buyer confidence. These are swamping the still positive influences coming from the chronic shortage of housing in Australia and the boost from the expansion of the 5% low deposit scheme for first home buyers. Note that while the pace of decline looks to be slowing in the next chart, recent months continue to be revised down, and October is likely to be too.
Prices nationally have now fallen 6.7% from their high in March, with Sydney leading the fall with a 10.1% drop. While national average property prices are still up nearly 50% this decade, average dwelling prices in Melbourne have fallen back to around early 2021 levels and those in Sydney are back to around late 2021 levels.
The perfect property storm has further to go
The Australian housing market is likely to weaken significantly further for
several reasons:
- The pressure from rate hikes is intensifying with the RBA having already hiked four times this year and looking like it will hike again this week taking the cash rate to its highest in 18 years.
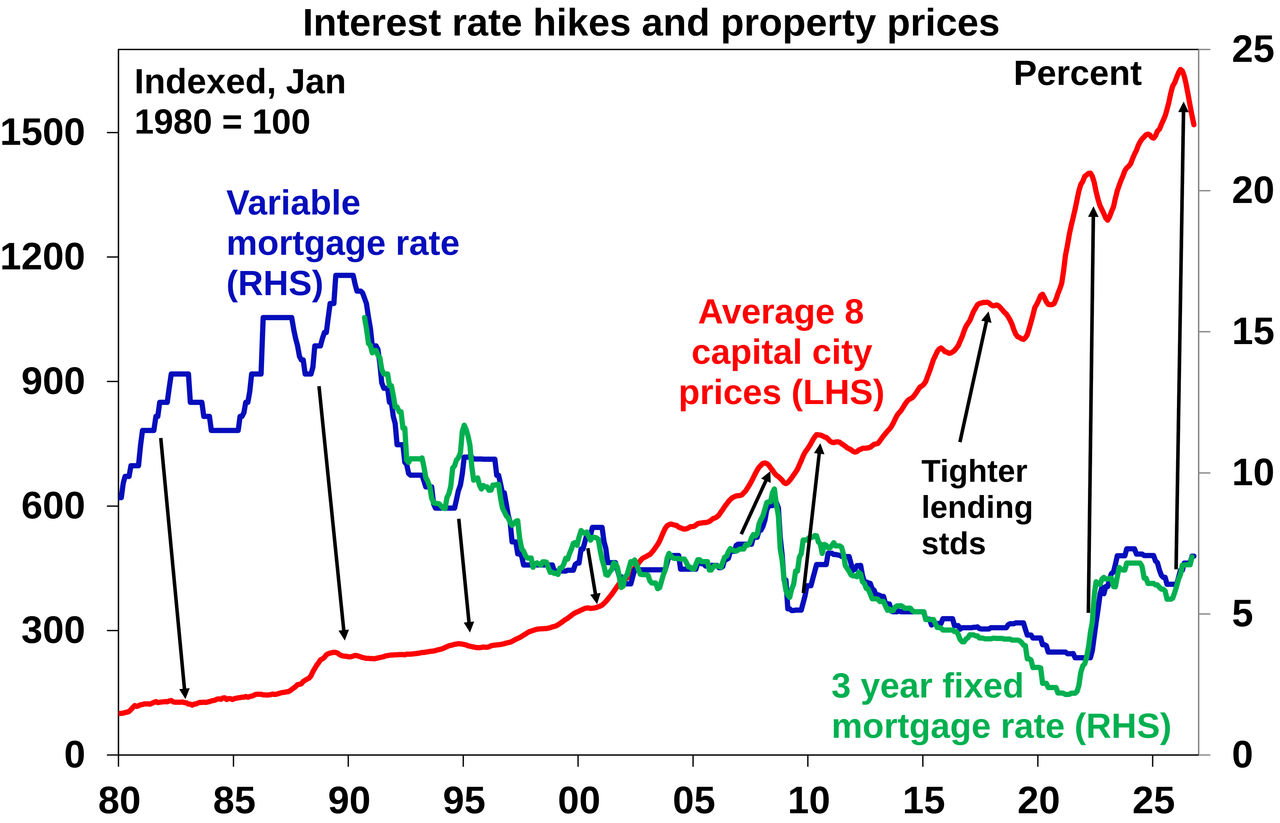
➢ Rate hikes are usually associated with weaker property prices and this cycle is proving to be no exception. This is because they cut how much buyers can borrow, can boost distressed sales and hit home buyer confidence.
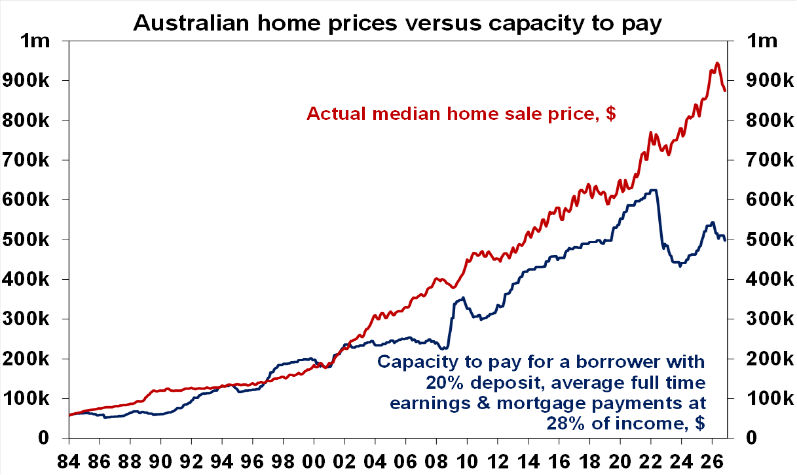
➢ Each 0.25% rise in rates knocks around $11,000 off the amount that an in individual buyer on average earnings with a 20% deposit can pay for a home, so the four rate hikes seen already this year mean a total hit to their capacity to pay of around $45,000. This is occurring at a time when poor housing affordability, ie the surge in home prices relative to wages and household incomes to record levels, had already led to a $400,000 or so gap between home prices and the capacity to pay for a home.
➢ The drip feed of higher rates will also put more pressure on existing homeowners already suffering from mortgage stress. Another rate hike this week will mean roughly an extra $110 a month in mortgage interest payments for mortgage holders and a total increase of $550 a month since January or $6600 year – which runs the risk that we may be close to a tipping point for some mortgage holders. The weaker jobs market and rising unemployment risks also adding to distressed sales.
➢ While we think the RBA after another rate hike this week will have done enough to slow demand in the economy to cool inflation, the risk of further hikes is high and in any case RBA commentary is likely to continue to lean hawkish warning of more hikes to come for a while yet and we don’t see it cutting rates until the December quarter next year.
- The Budget tax hikes on investors - the move to curtail access to negative gearing and return to the taxation of real capital gains is continuing to drive a big decline in investor demand for residential property in the near term because it means a significantly lower after-tax return for investors.
- Poor buyer confidence –consumer confidence is running around levels often associated with recession.
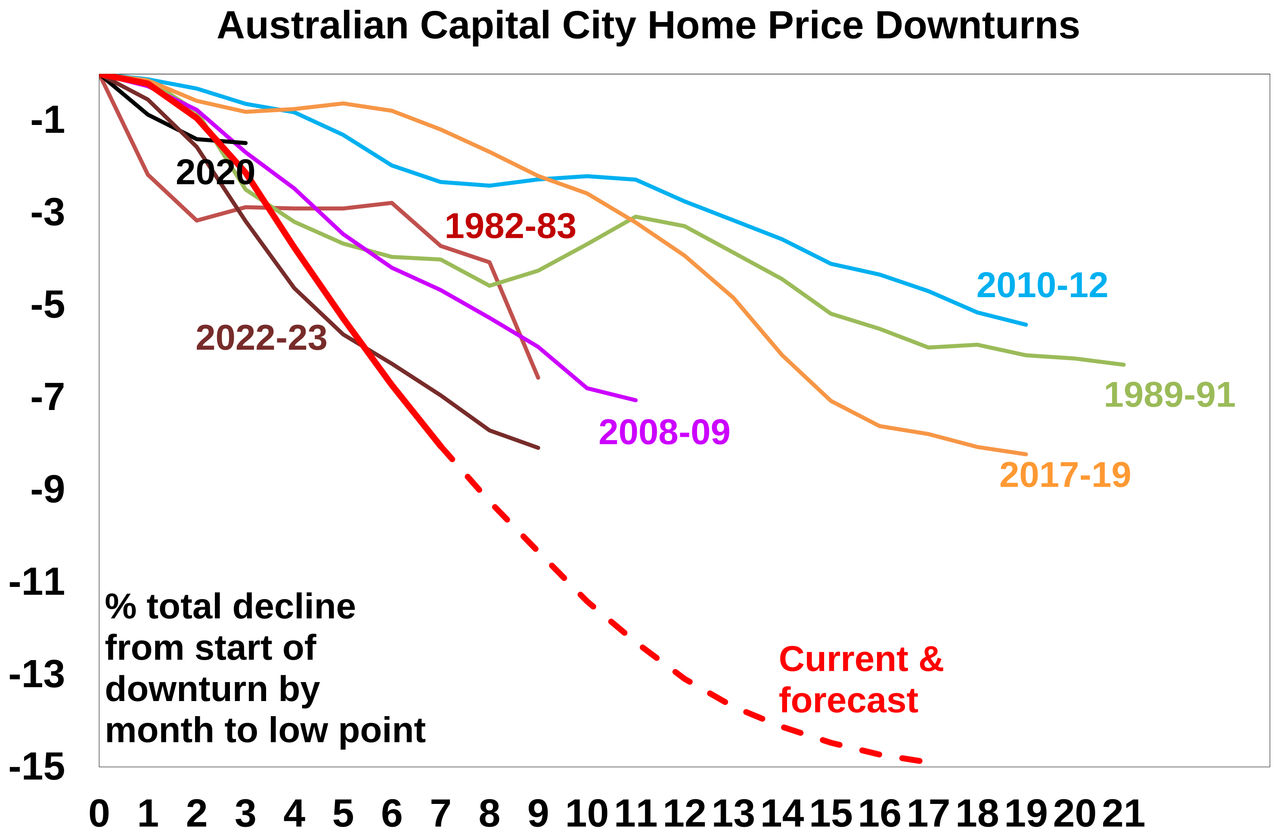
With price falls now the most rapid on record since 1980, average prices already down 6.7% with no loss of negative momentum, the drags on demand set to continue for a while yet and a likely rise in distressed selling, we are revising our expected top to bottom fall to around 15%. This is deeper than the range of average capital city property price declines seen over the last 40 years or so but is consistent with the perfect storm now hitting the property market. However, by the September quarter next year, property prices are likely to bottom with the market starting to anticipate RBA rate cuts.
More signs of the end of the 30-year super cycle
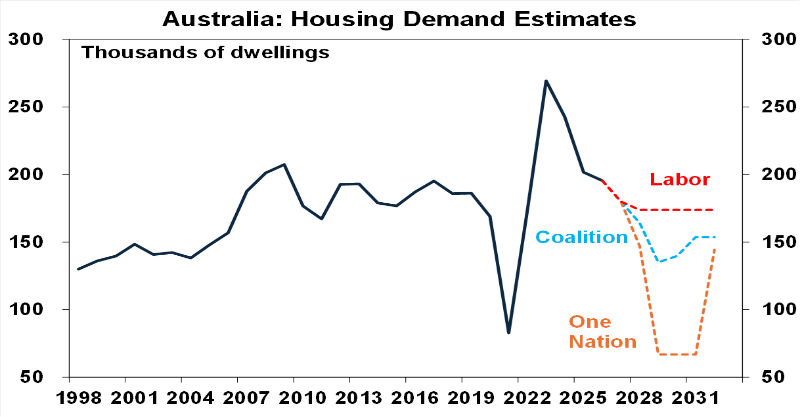
The combination of a rising long-term trend in mortgage rates after the long term downtrend that ran from 1989 (when they peaked at 17%) to 2021 (when they bottomed around 2%), the virtual removal of property tax concessions, record poor affordability and a political shift towards lower immigration after nearly 20 years of relatively high immigration may mean the 30-year super cycle upswing in home prices may be over. This saw average property prices rise dramatically faster than their long-term trend and incomes since the mid-1990s and led to chronically poor housing affordability. Of course, the ongoing housing shortage remains - which could be made worse by having less investors involved in the property market – and is the key sticking point, so it’s hard to be definitive! That said, Coalition and One Nation policies for a sharp pull back in immigration levels imply sharply lower underlying demand for housing if they attain power.
The property price downturn and the economy
There are several implications for the economy:
- A drag on consumer spending – with each 10% fall in home prices likely to knock around 1% off consumer spending as people feel less wealthy. This is likely to be increasingly evident in the months ahead.
- Less new home building – as established dwelling prices fall relative to new dwellings reducing the incentive to build new homes.
- Increased negative equity – where a homeowner’s mortgage debt is worth more than their home. This is low at present and is really only an issue (beyond the wealth effect) if the homeowner has to sell. But it will impact those who bought say around the end of last year.
- Rising bank bad loans and less demand for credit – the former is not a major problem for the banks as they have significant capital reserves but the latter has been weighing on their share prices.
At a high level this means that the home price downturn will mean an increasing drag on economic growth and demand in the economy. So far, the fall in prices – considering that they are still up nearly 50% so far this decade - has still not been enough to offset the problems the RBA faces around excessive inflation. However, if the property price downturn continues into next year it will likely eventually become a factor in capping rates and the RBA pivoting towards rate cuts later next year.
What to watch?
The key things to watch will be interest rates, consumer confidence, unemployment and investor demand. More rate hikes, a sharply rising trend in unemployment and a further drying up in investor demand could result in bigger price falls than the 15% fall we are now expecting. Alternatively an earlier move to RBA rate cuts could see the property market bottom out earlier than the September quarter next year.
What does it mean for share markets?
The experience of the last 35 years suggests that while first Fed rate hikes in a tightening cycle can cause a dip in shares, the bull market usually resumes until rates become onerously tight, which weighs on profits. This can be seen in the next chart. US shares had wobbles when rates first started to move up in February 1994 (US shares had a 9% correction), in June 2004 (US shares had an 8% correction) and in December 2015 (US shares had a 13% correction) but thereafter they resumed their rising trend and a bear market did not set in till 2000, 2007 and 2020 after multiple hikes. Of course, the 2020 bear market was ostensibly due to the pandemic. Recession did not come for seven years after the February 1994 first hike, for three and a half years after the June 2004 first hike and for four years after the December 2015 first hike. This is because the first rate hike only takes monetary policy to less easy, and it’s only when monetary policy becomes tight that the economy gets hit. The start of Fed tightening in the last cycle in March 2022 was different as shares were already in a falling trend and this continued until October 2022 culminating in a 25% fall. But inflation was much higher then – with US core CPI inflation of 6.5%yoy when the Fed started to hike necessitating a more aggressive increase in interest rates whereas now it’s much lower.
Dr Shane Oliver
Head of Investment Strategy and Chief Economist, AMP


Something went wrong. Please try again.
Thanks for subscribing.
We'll keep you up to date with the latest news, insights and information from AMP. Check your inbox for future updates.
You may also like
-

Weekly market update - 23-10-2026 It was another rocky week across markets. For most of 2026, the narrative has been that investors have benefitted from strong earnings and AI investment. But now, rising oil prices, rising bond yields and central bank rate hikes are making the outlook more fragile. -

Baby budgeting: How to financially prepare for a baby Learn how to budget for a baby, prepare for parental leave, estimate childcare costs and build a financial buffer before becoming a parent. -

Weekly Market Update - 16-10-2026 - AMP Weekly Market Update: AI credit fears hit shares, Investors flocking to safe haven (because of CoreWeave?), Oil still high but global growth still resilient, and Weak jobs data gives RBA room to pause.
Important information
Any advice and information is provided by AWM Services Pty Ltd ABN 15 139 353 496, AFSL No. 366121 (AWM Services) and is general in nature. It hasn’t taken your financial or personal circumstances into account. Taxation issues are complex. You should seek professional advice before deciding to act on any information in this article.
It’s important to consider your particular circumstances and read the relevant Product Disclosure Statement, Target Market Determination or Terms and Conditions, available from AMP at amp.com.au, or by calling 131 267, before deciding what’s right for you. The super coaching session is a super health check and is provided by AWM Services and is general advice only. It does not consider your personal circumstances.
You can read our Financial Services Guide online for information about our services, including the fees and other benefits that AMP companies and their representatives may receive in relation to products and services provided to you. You can also ask us for a hardcopy. All information on this website is subject to change without notice. AWM Services is part of the AMP group.