


Econosights
Housing Q&A
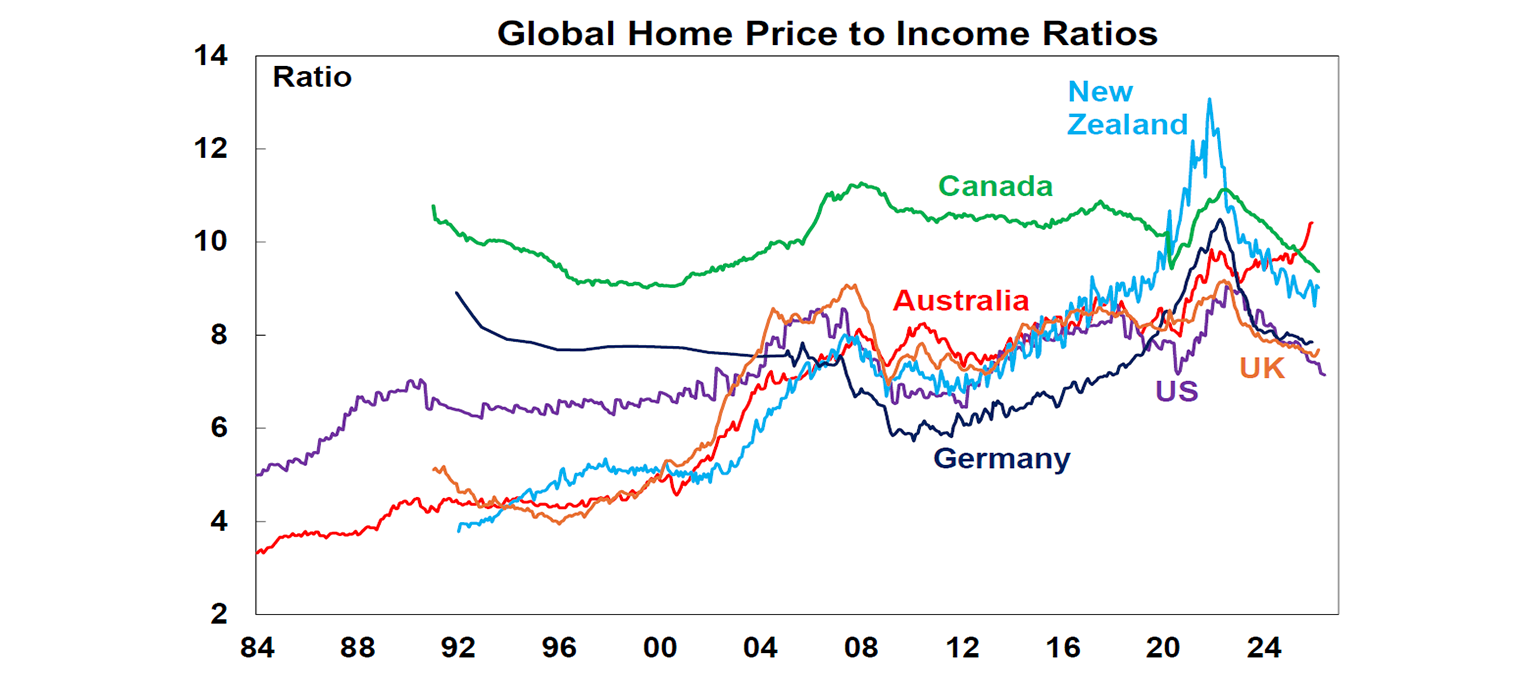
Current home prices are worth more than 10 times average income, which has more than doubled since the mid 1980’s. This metric basically shows you how long it takes you to get into the market to buy a home, so you should think about it as “it will take me more than 10 years of my income without spending a single cent to purchase a home in Australia”.
10 min read

Key points
Fears about a housing-induced economic downturn in Australia are overblown.
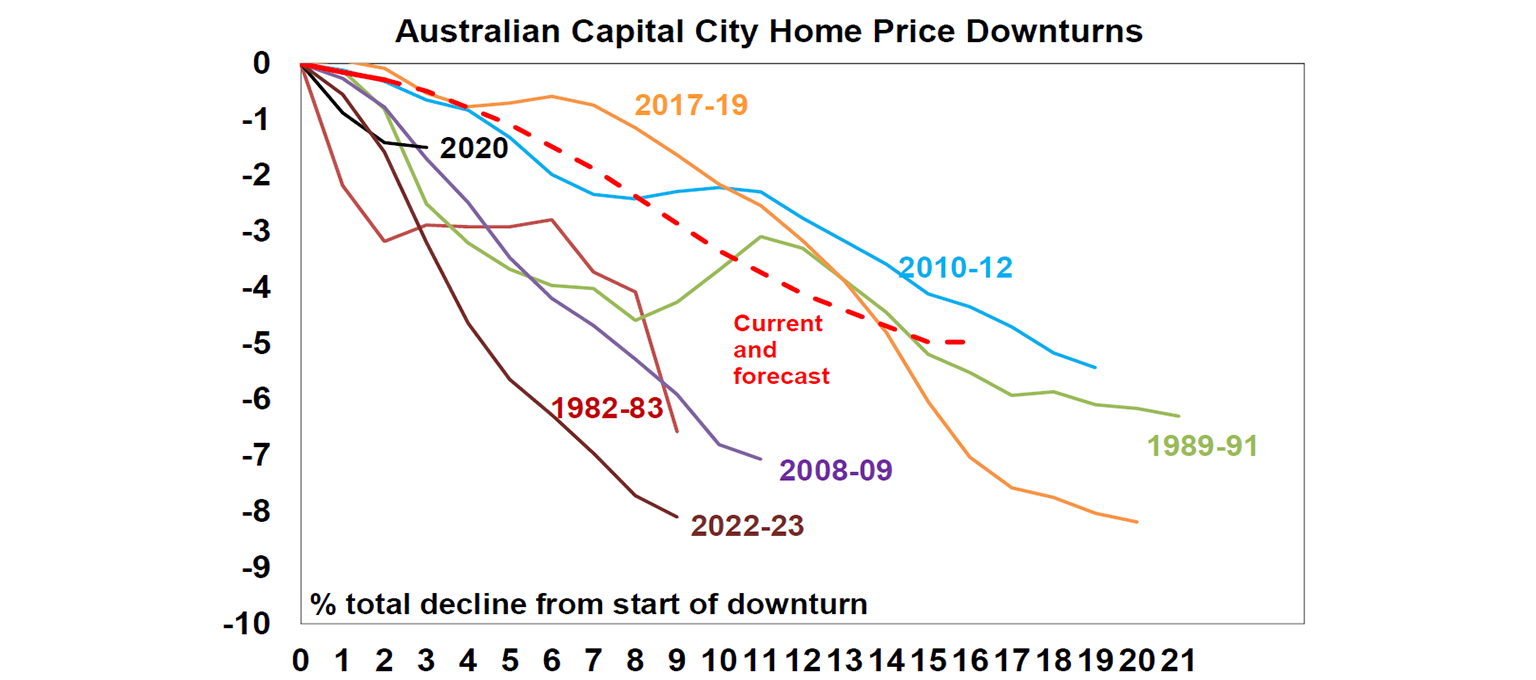
We expect home prices to fall ~5% to June-27. This is in the normal range of prior housing market slowdowns.
Some of the slowing in investor lending will be offset by higher first-home buyers.
However, more housing supply is still the missing link to really help affordability and reduce the pressure on rents.
Introduction
The post-budget fallout from the announced tax changes, particularly as it relates to housing, demonstrates the importance of the housing market in the economy as a driver of economic activity as well as deep-rooted Australia fears of falling home prices.
In this Econosights, we examine to what extent does Australia’s economy rely on the housing market, the economic impact of a slowdown in housing and what’s needed to help lift levels of affordability for Australian households as well as reducing the pressure on rents.
Housing affordability metrics
Most people agree Australian housing is unaffordable. If you are sceptical of this, let’s look at some metrics that prove this point.
Current home prices are worth more than 10 times average income, which has more than doubled since the mid 1980’s. This metric basically shows you how long it takes you to get into the market to buy a home, so you should think about it as “it will take me more than 10 years of my income without spending a single cent to purchase a home in Australia”. The rise in Australia’s price-to-income ratio has been larger than most of our global peers, especially in recent years.
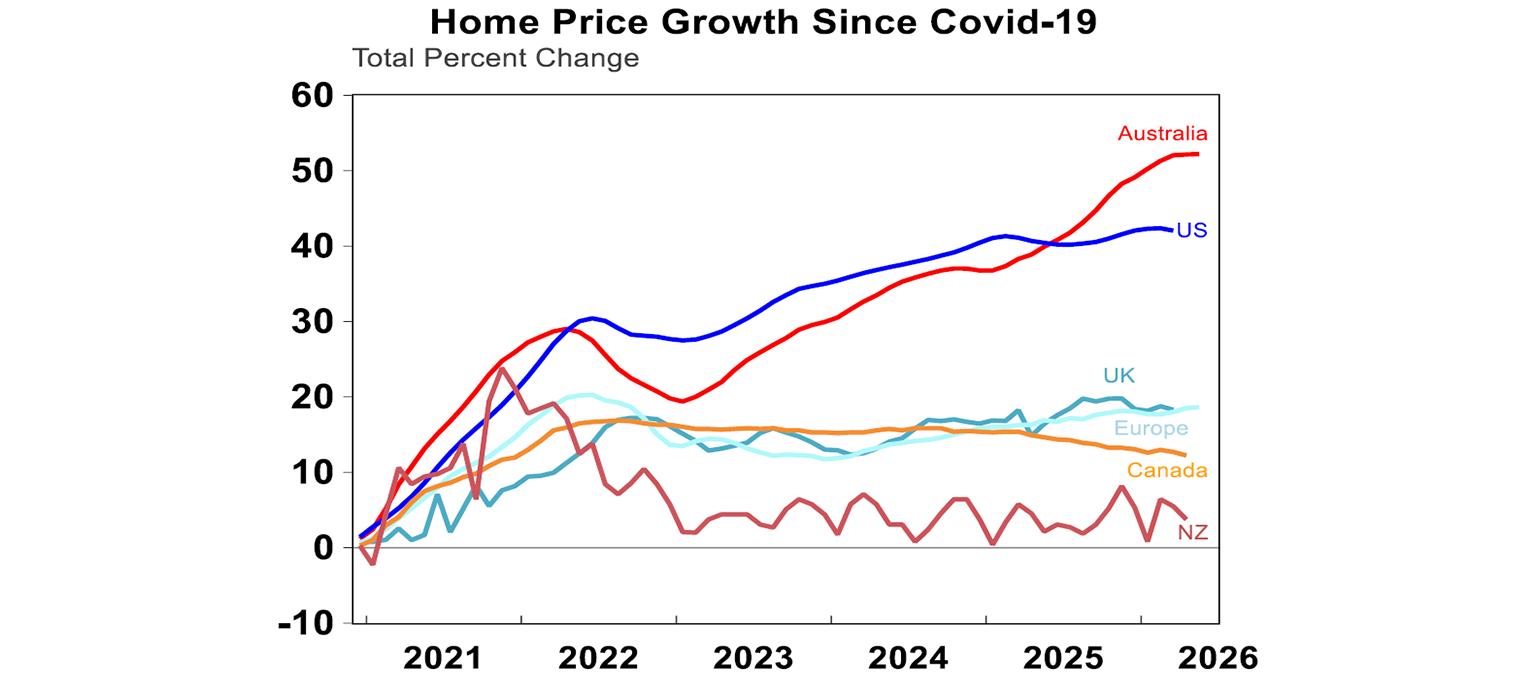
Indeed, the post-Covid years has seen Australia’s housing market increase in unaffordability (despite higher interest rates). Post-pandemic, Australian home prices are up more than 50%, way above comparable markets across the globe.
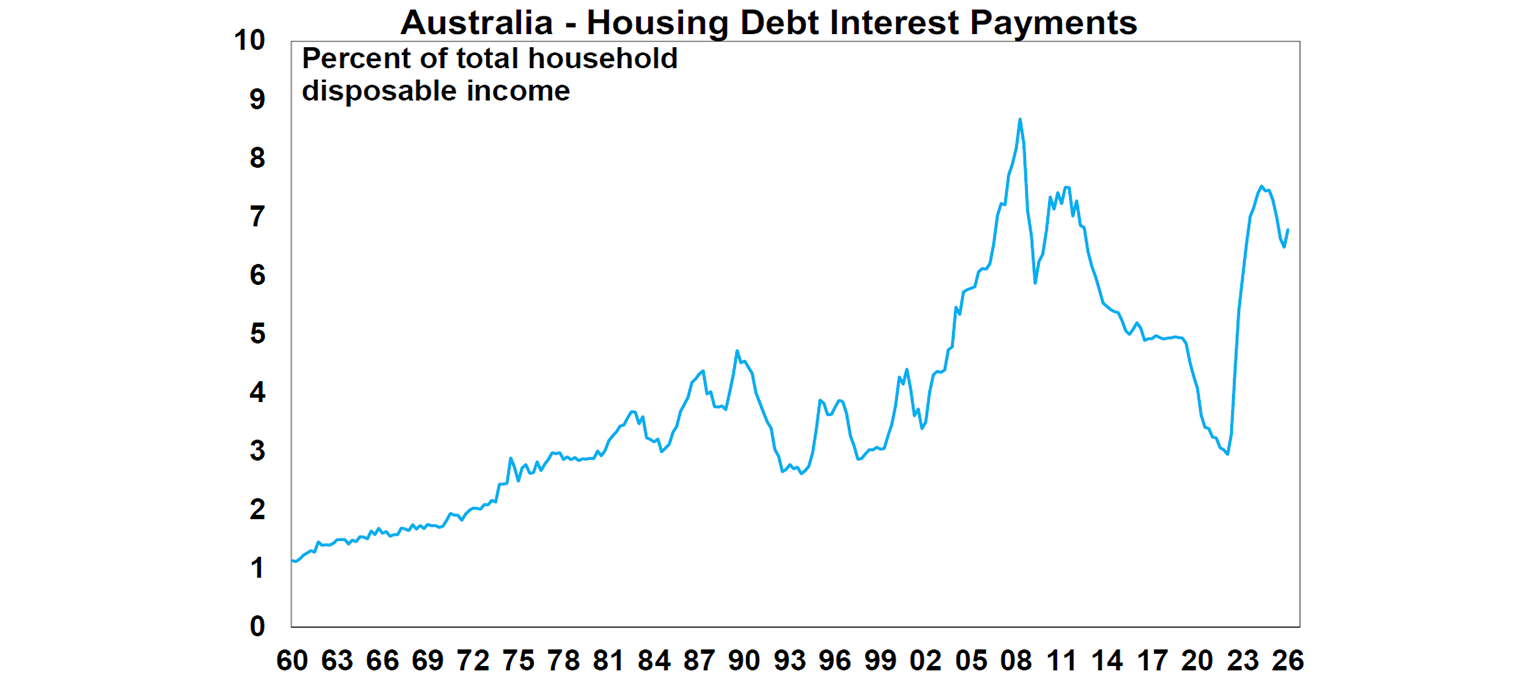
Another metric of affordability is the serviceability of debt. Housing interest repayments in Australia have risen in recent years alongside high home prices and the increases to interest rates. The average household spends around 7% of their disposable income on interest repayments and including principal this would increase to around 13%. This is a high debt burden for households, relative to historical averages. Note this includes all households, even those without mortgages. For mortgagees, especially those with loans taken out in recent years, the debt burden would be higher.
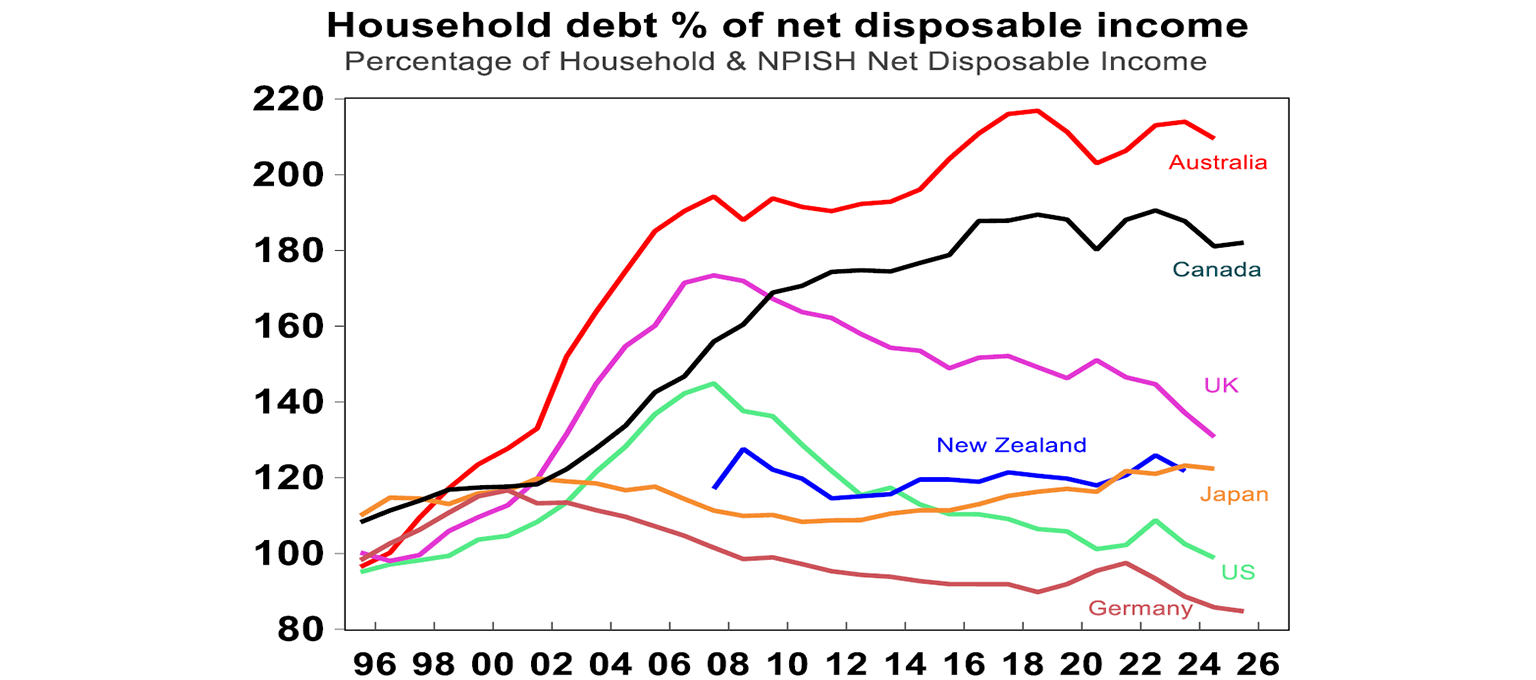
Another affordability metric is the value of household debt (of which ~75% is housing related) which shows how much households have extended themselves to purchase a home. Average household debt, which is more than double incomes in Australia, remains around this record high and is also above our peers.
Why is high debt a problem? It’s basically a vulnerability for households. If interest rates increase, it means higher debt repayments. Any downside economic shocks (like slowing economic activity which could increase the unemployment rate) could impact incomes which would make debt repayments harder and could result in forced selling and causes risks for financial stability.
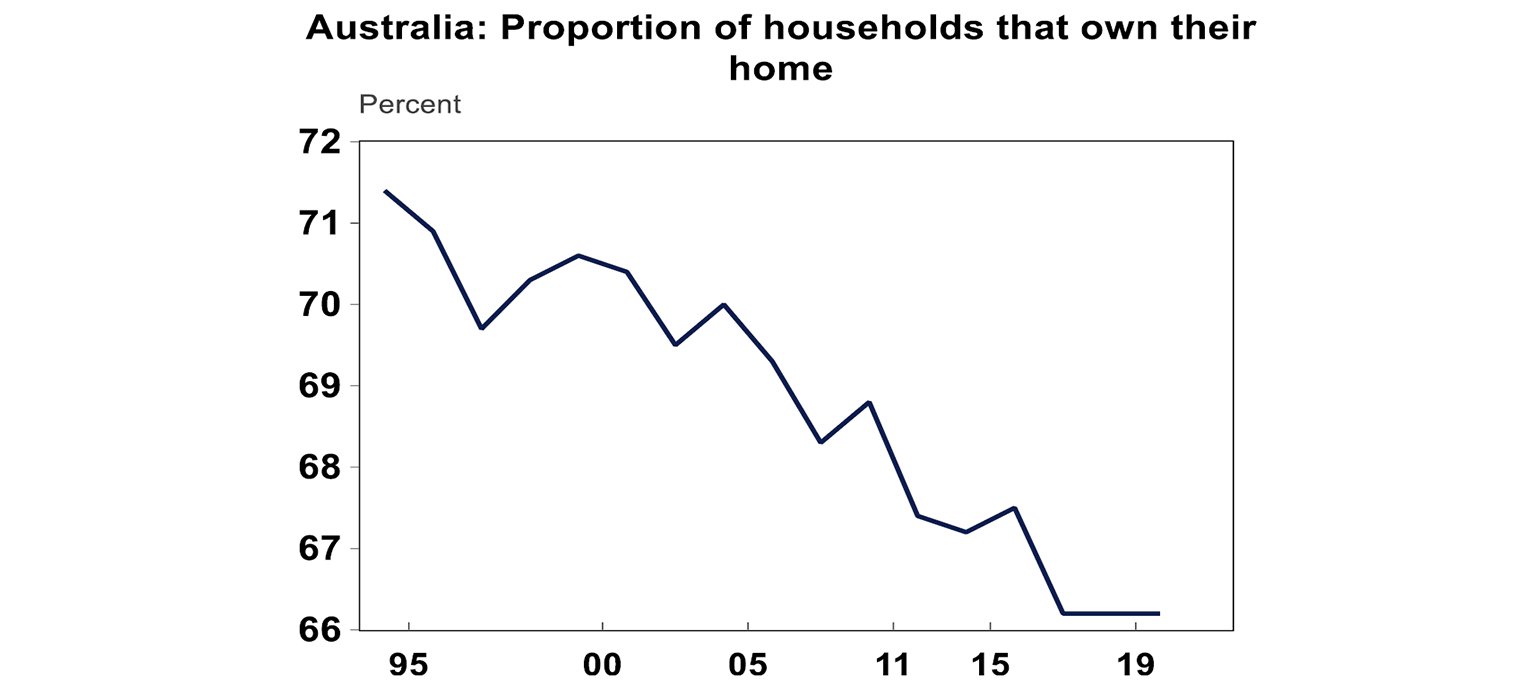
Another metric of poorer affordability is the clear decline in home ownership in Australia in the last 30 years. The home ownership rate was 66% in 2019 (the last available data print), down from 71% in the 1990’s. Some will say that this is just a change in people’s preference – that they prefer to rent for longer or that they marry later which is also influencing home ownership rates.
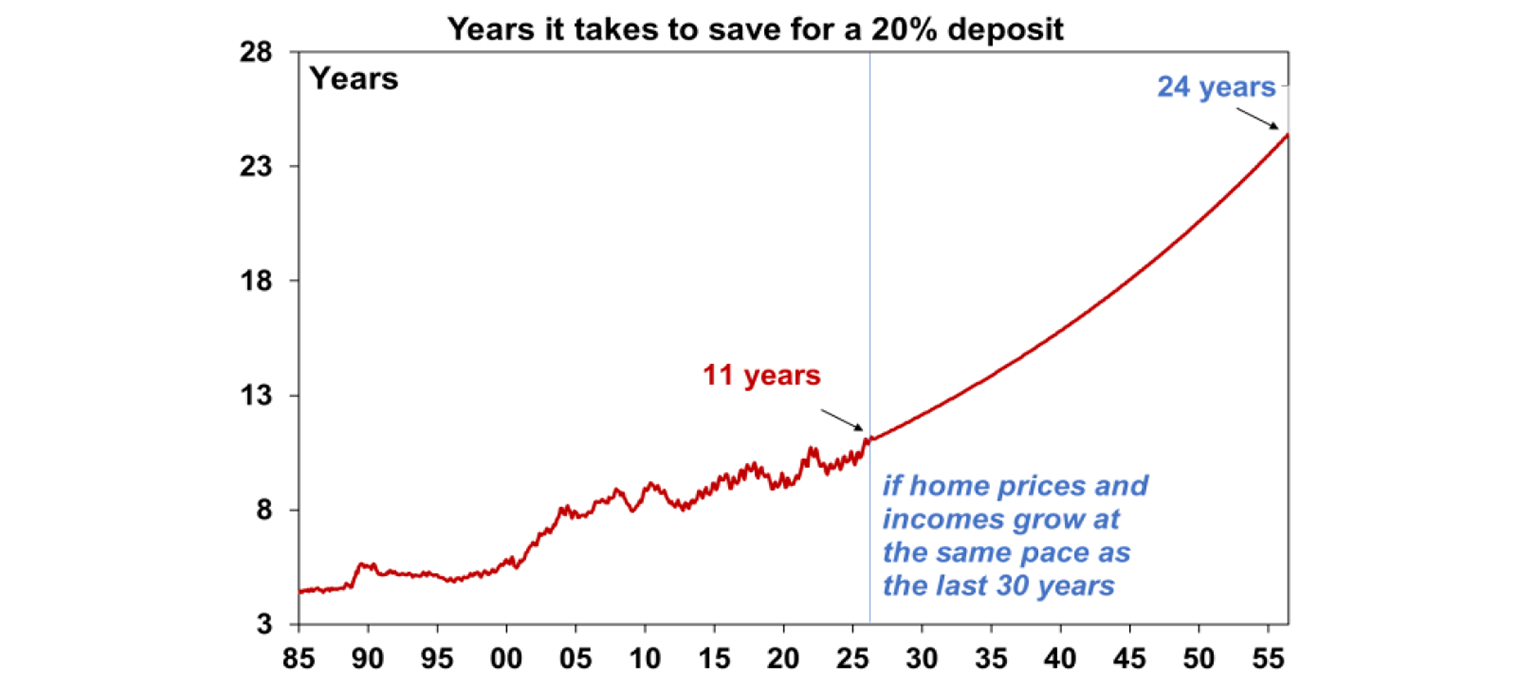
If we assume that home prices grew at the same rate as they have in the last 30 years and incomes also averaged at gains in the last 30 years, this would see housing affordability continue to diminish over time. It would take 24 years in 30 years time to buy a home (up from 11 years today) and the average dwelling price would be $6.2mn!
If we understand that Australian housing is on the more expensive side then the solution is to make it more affordable by forcing home prices to run below incomes. Therefore, we need to either make home price growth lower or push incomes up. It’s quite hard to push incomes up significantly, without generating unwanted inflation. So the answer is ultimately falls in home prices or low growth in prices.
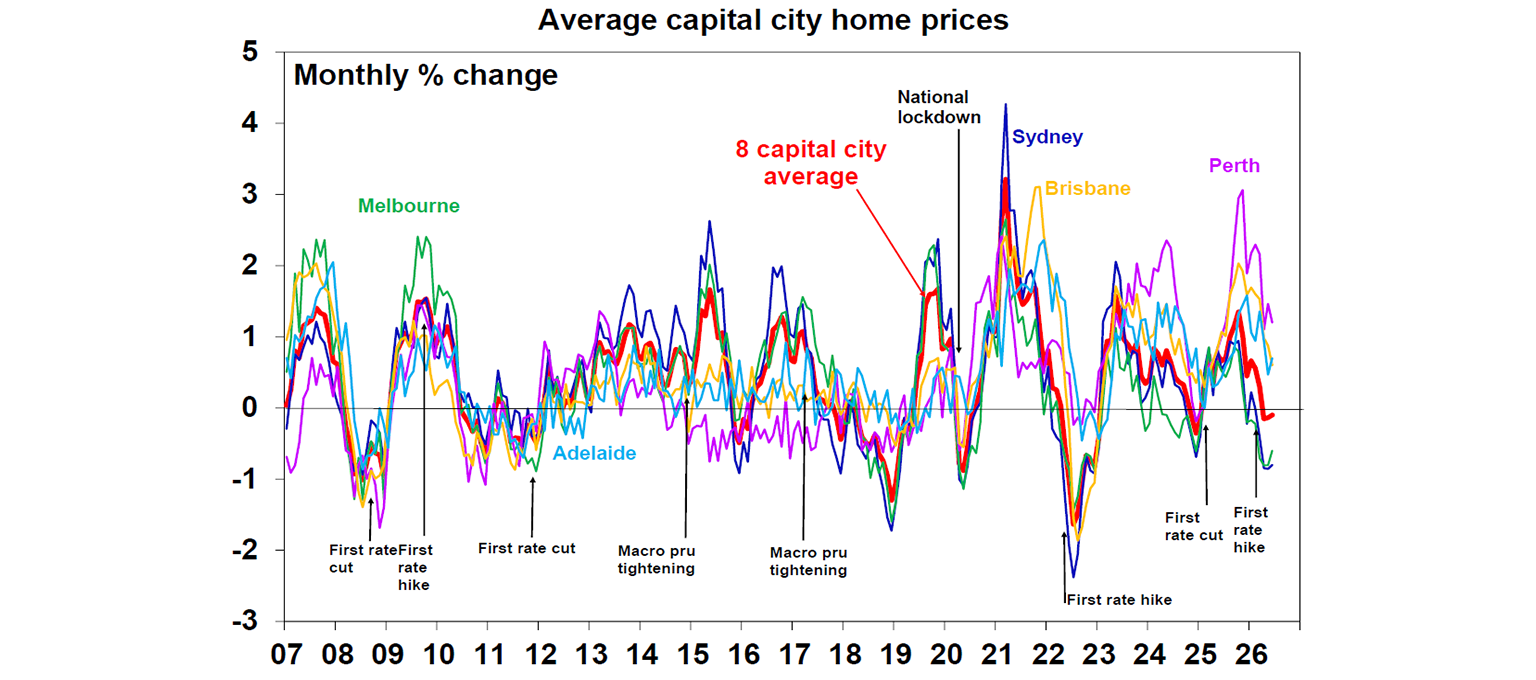
The tax changes announced in the May Federal Budget, including the move from a 50% capital gains tax discount to a discount based on real capital gains and the limiting of negative gearing to new properties (rather than existing/new) alongside the interest rate increases from the Reserve Bank of Australia is likely to result in lower home price growth . We expect national home prices (house and apartment) to experience small negative falls over the remainder of this year, finishing 2026 down slightly and for the declines to continue into next year, with home prices down 5% over the year to June 2027 before an improvement with potential rate cuts in late 2027 helping to lift prices.
This slowing in home prices is already becoming evident in the monthly data. According to Cotality, capital city prices have been falling since April, although with variations across the capital cities. Auction clearance rates have declined to just over 50% which is at the lower end of the normal range and consumer expectations of home prices have fallen to their lowest levels in 5 years.
Despite the understanding that more affordable housing was necessary in Australia, there is now consternation around the impact of the decline in home prices on the broader economy.
How much does Australia rely on housing?
The concern around lower home prices demonstrates how much the economy relies on the housing market. Usually when we think about how much “housing” contributes to the economy, we would first look at residential construction. But “housing” actually encapsulates so many parts of the economy – construction, property services, banking, insurance, legal, removalists, styling agents, auctioneers and retail via home furnishings.
In economics, we would call this the “multiplier effect” and residential construction has one of the highest multipliers across all industries. Measuring the direct and indirect impact of “housing” can be estimated using the Australian Bureau of Statistics Input-Output tables which show an industry’s overall flow-on to other parts of the economy. It also shows a greater breakdown for the residential housing sector compared to GDP data around industry gross value added, which looks at the value of industry goods and services produced.
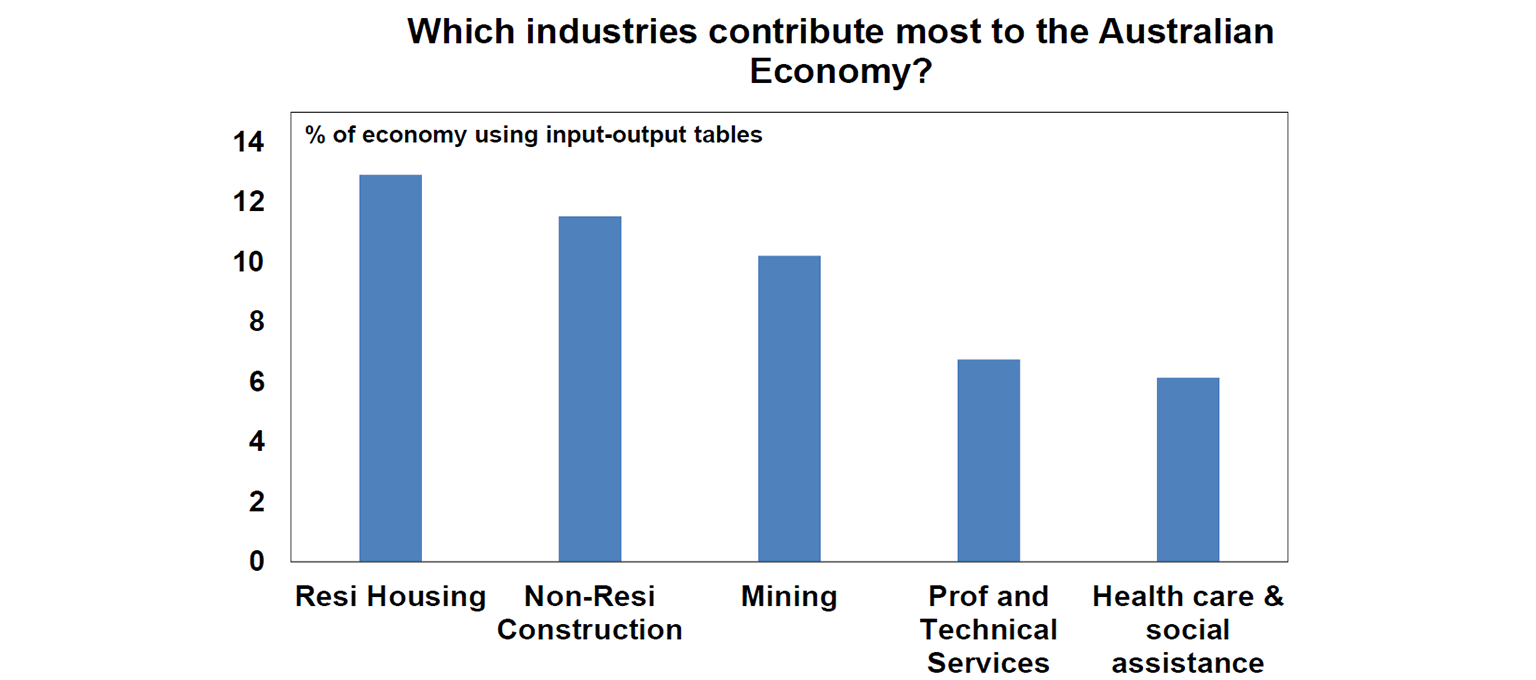
Looking at the input-output tables shows that residential housing looks like the largest single-industry in Australia, accounting for ~13% of the economy, close to non-residential construction but above mining. These estimates also include the cost of someone living in a home (either renting or in an owner-occupied dwelling), so it makes sense that housing comes out as the largest industry as the cost of living in a home is one of the biggest costs many people have.
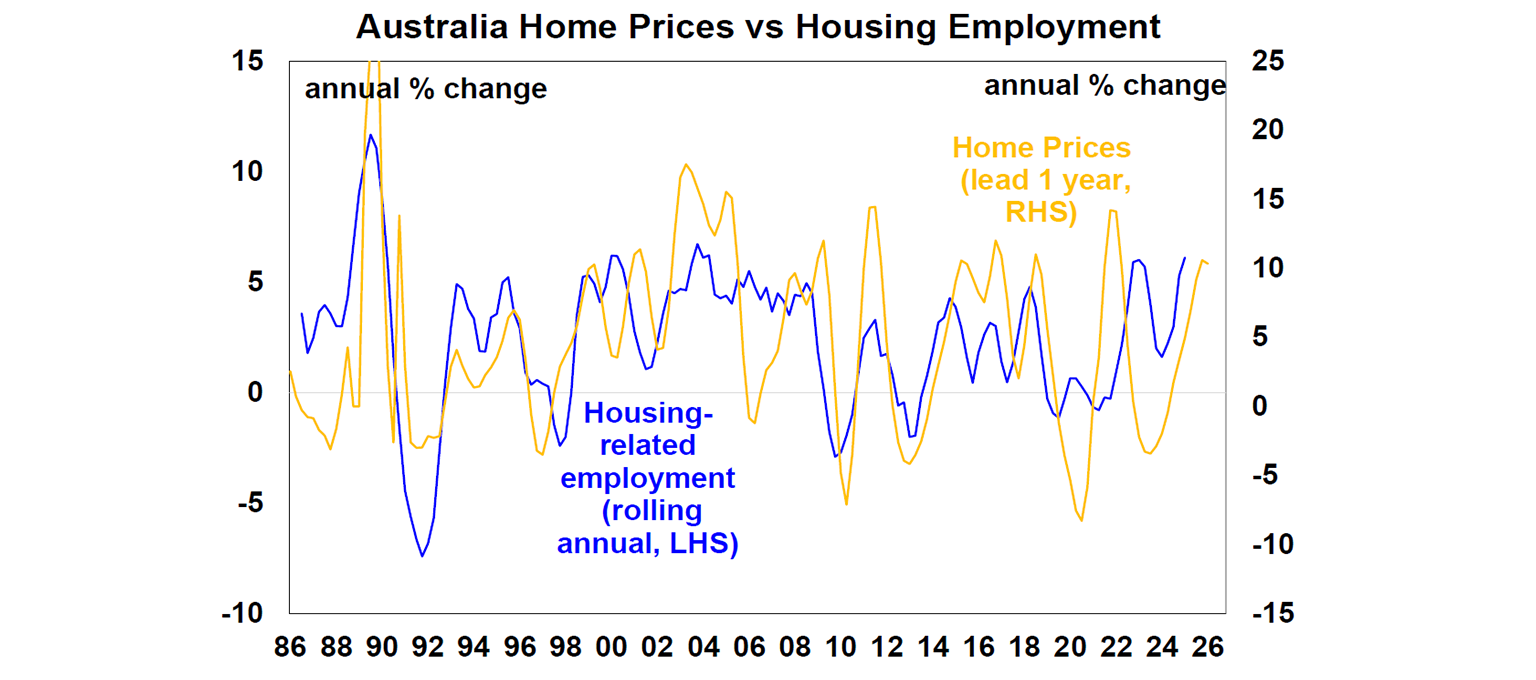
Interestingly, housing-related employment also moves alongside home prices.
What is the economic impact of a slowdown in housing?
Usually, a slowing housing market occurs alongside a slowing in the broader economy, so it’s hard to suggest that softer housing activity is the driver of softer economic growth. For individuals, the impacts of slowing prices have mixed effects.
For households that have already purchased a home, the effect of lower prices may translate through a “wealth effect”. The relationship between wealth and home prices is very high as around 70% of Australian household wealth is tied to the value of homes (which is made up of land and dwellings) and moves closely in line with home prices (see the chart below).
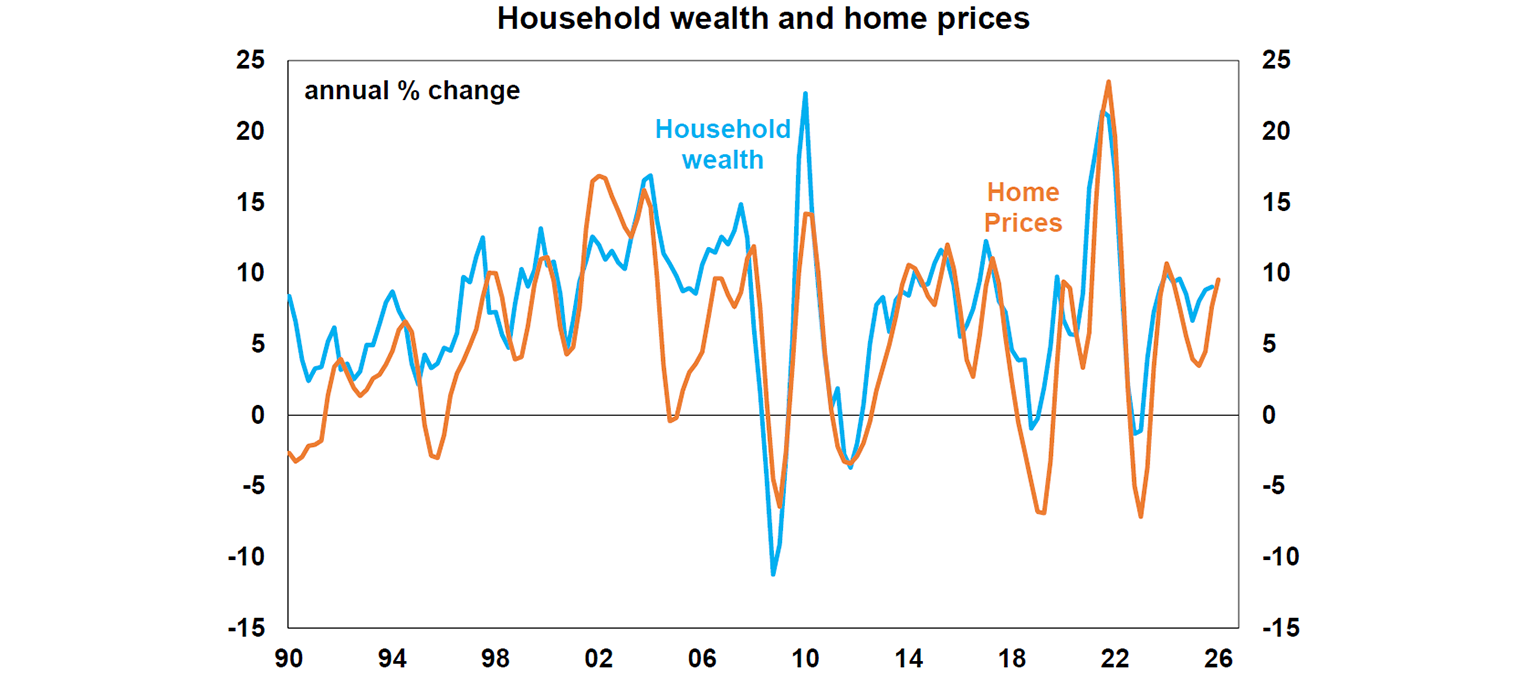
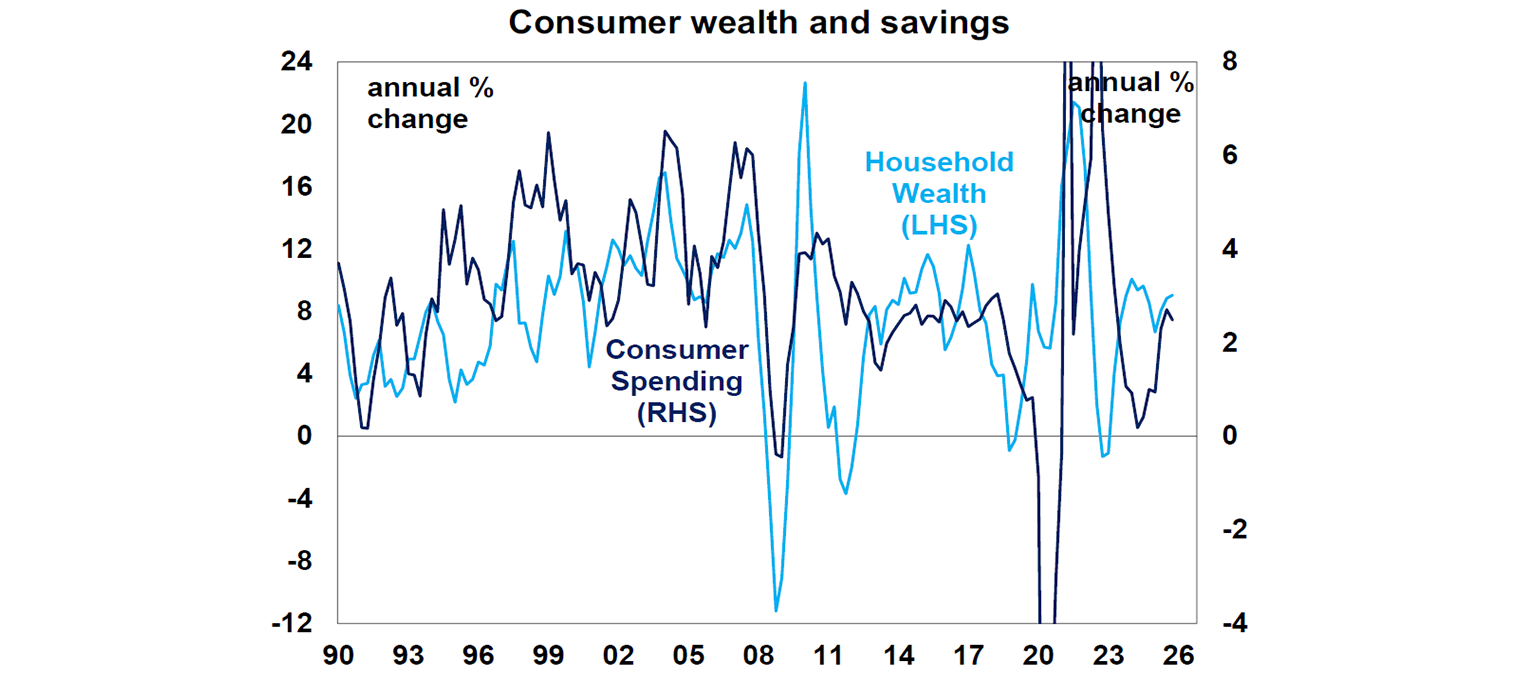
The “wealth effect” is an economic concept referring to changes in household wealth impacting consumer spending. When wealth increases, consumers feel psychologically better - while you can’t actually “eat” a portion of your home, you just feel more confident that if you needed to sell your home it would be worth more. And it’s similar when prices fall. A decline in wealth makes consumers feel concerned, especially if they are new entrants into the market. The data shows some evidence of a wealth effect, but it’s not a particularly high correlation in the short-term.
What about households that have only recently entered the market? A common concern is that falling prices could push some borrowers into “negative equity” - where the value of the home drops below the purchase price. This matters if borrowers need to sell or refinance. However, the scale of this risk appears limited. Recent RBA estimates suggest that less than 1% of households are currently in negative equity. Price falls from here will impact more borrowers, however the starting position is good and we are only assuming a moderate decline in home prices.
For existing homeowners, lower prices can also mean selling for less than expected, which in turn limits the budget available for their next purchase. So while the impact is more muted for most, it’s not insignificant.
By contrast, lower prices are clearly positive for prospective buyers. This sits at the heart of the government’s tax changes, which aim to shift demand away from investors and towards first home buyers, improving their ability to enter the market if prices soften while income growth holds up.
More broadly, there is a persistent perception in Australia that falling home prices signal broader economic weakness. In reality, however, modest price declines—particularly after a period of strong gains - can simply reflect a rebalancing of the housing market (especially after years of strong growth) rather than a deteriorating economy.
Home price cycles in Australia
The general consensus in Australia seems to be that home prices never fall. But this is not true. Ups and downs in the housing market are normal. In recent history, annual property price growth was negative in 2023,2019, 2012 and 2009.
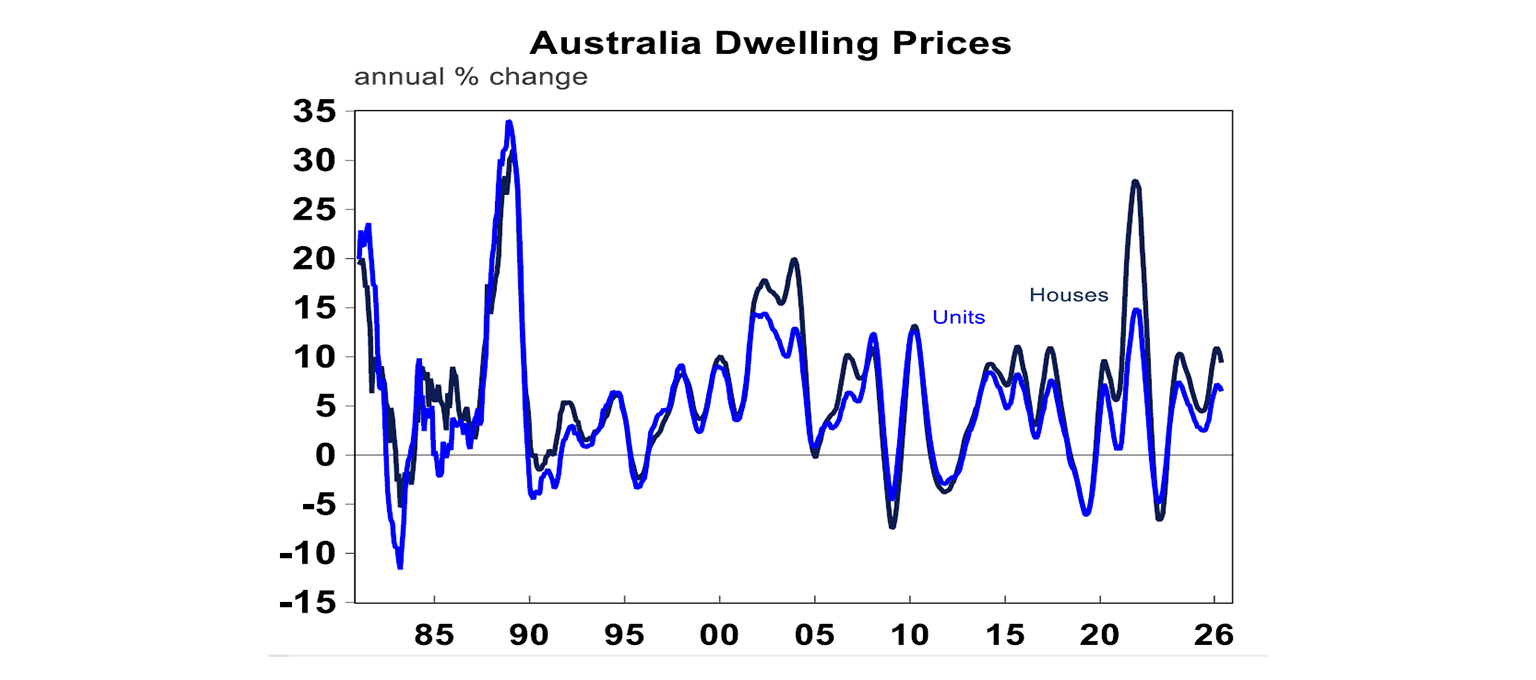
But, these down-cycles tend to be short-lived and prices usually only fall ~5% which is modest. And across a period of 5-years, home price growth has always tended to be positive (see the chart below).
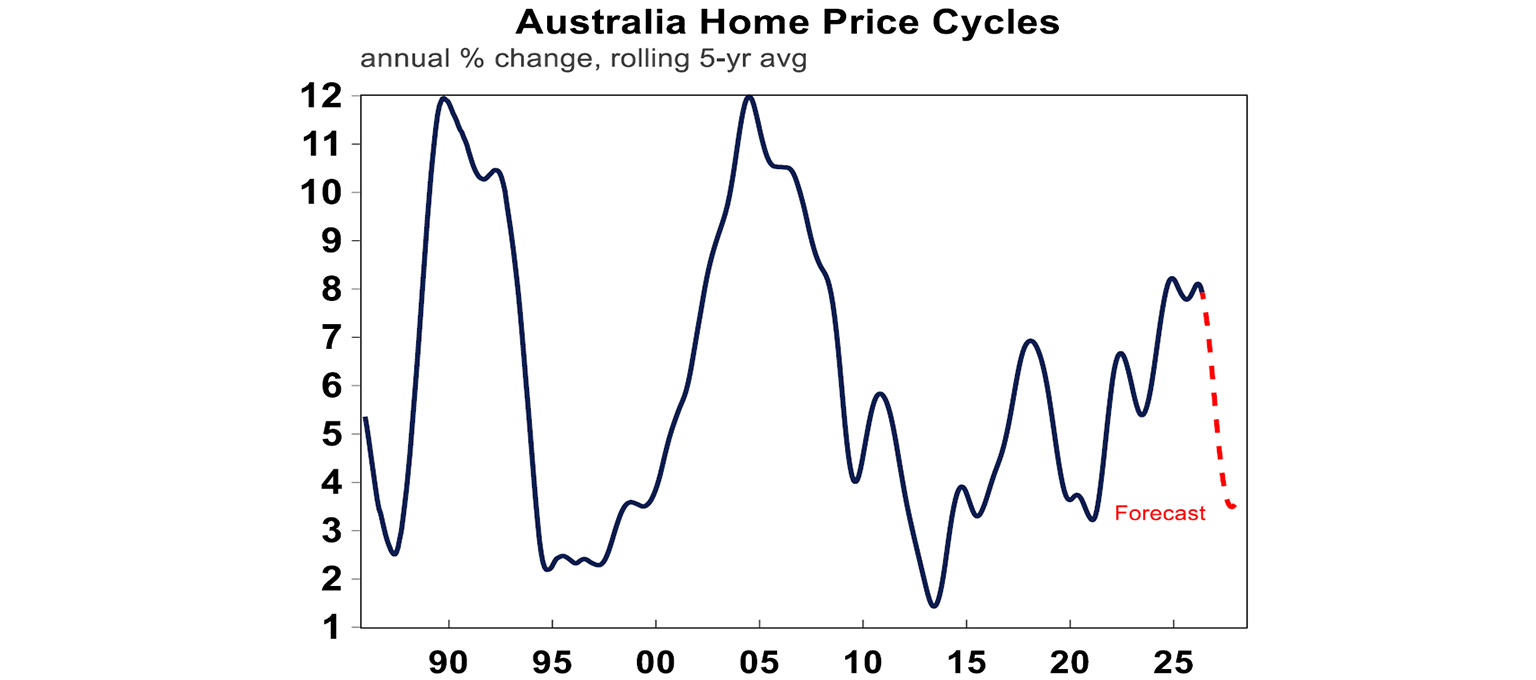
We expect property prices to fall by around 5% overall, which is sort of around the middle of the usual range of price falls (see the chart below) and the 5-year average will look low relative to history. However, we don’t expect continuous falls in prices. Eventually, affordability will look better and drive more demand into the market.
How important are investors in the market?
Recent RBA analysis indicated that there are over 2 million housing investors, and around half of them use negative gearing. This is worth around 20% of the dwelling stock or around 10% of the working age population. The share of investors in the working age population has gone up in recent decades.
Do the tax changes mean that investors will move to other asset classes as it has become less attractive to invest into housing as an asset class? To some extent yes, as this is the point of making home price growth more sustainable over the long-term.
On a lending basis, investors have historically made up just over a third of the value of loans written and more recently have made up over 40% of the number of loans. Investor lending could slow by ~15%-20% in the next 12 months based on historical cycles. Some of this activity should be offset by a higher share of first-home buyer borrowers.
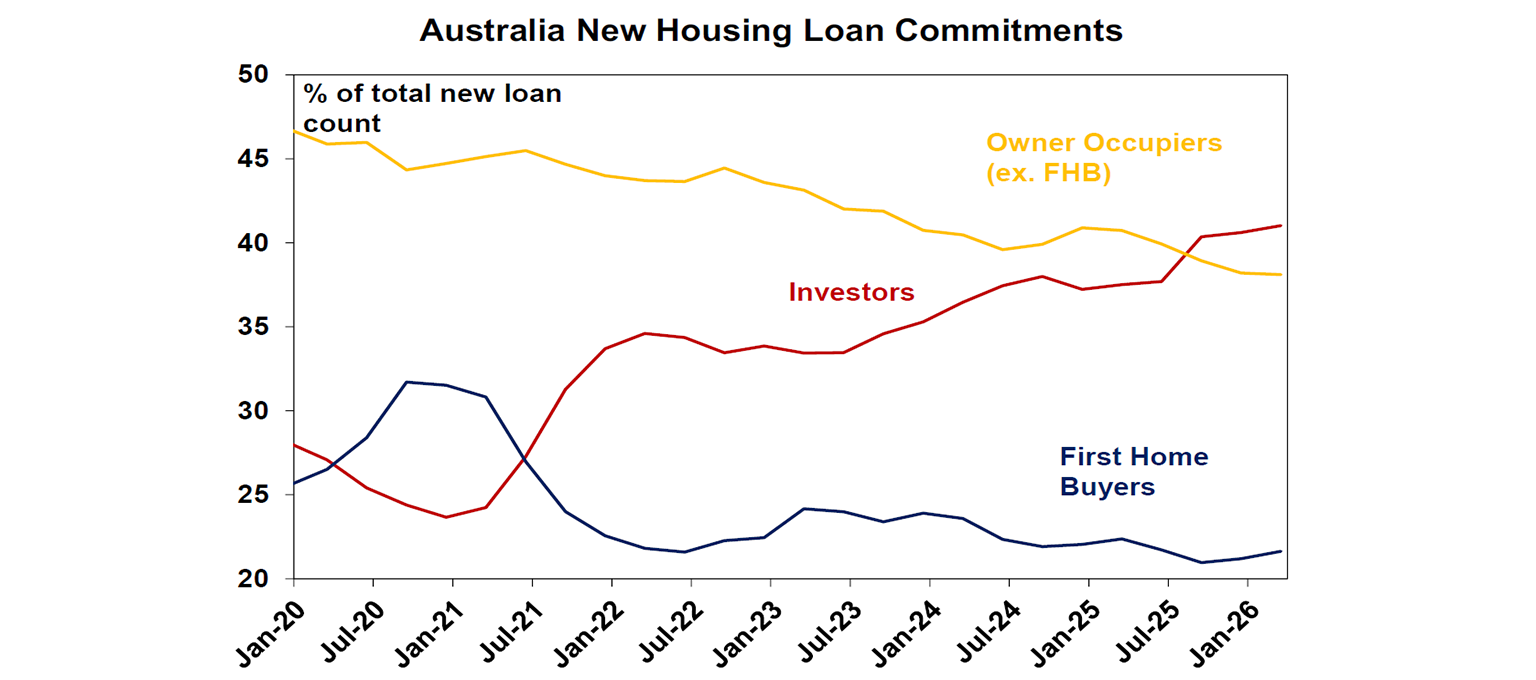
First home buyers account for just over 20% of new loans. Treasury estimates that, over a decade, its policies will support an additional 75,000 first home buyers. Put in context, that’s relatively modest - around 120,000 first home buyers have entered the market in the past year alone.
The bigger concern sits with the rental market. If investors exit, rental supply could shrink, putting upward pressure on rents. Renters make up around 30% of households, and rental growth has already been elevated—just under 4% per annum - largely due to tight supply relative to demand. The high inflation environment has also likely given landlords scope to lift rents, while the interest rate increases in 2022–23 may have enabled some to pass on higher costs.
It’s often argued that investors are critical for new housing construction. However in reality, around 80% of investor lending is directed towards established dwellings. While some point out that this reflects the larger size of the existing housing market, Treasury still estimates that the recent tax changes will only have a small impact - lifting rents by around $2 per week which will probably end up a being higher. And negative gearing incentives for new properties remain intact.
The real solution to get rents down is to increase housing supply.
Housing supply
There are some schools of thought that perceive no problem with housing supply by just looking at the number of dwellings relative to households. For example the total stock of housing is worth ~11.5 million homes in Australia and there are 10.7 million households. So what’s the problem?
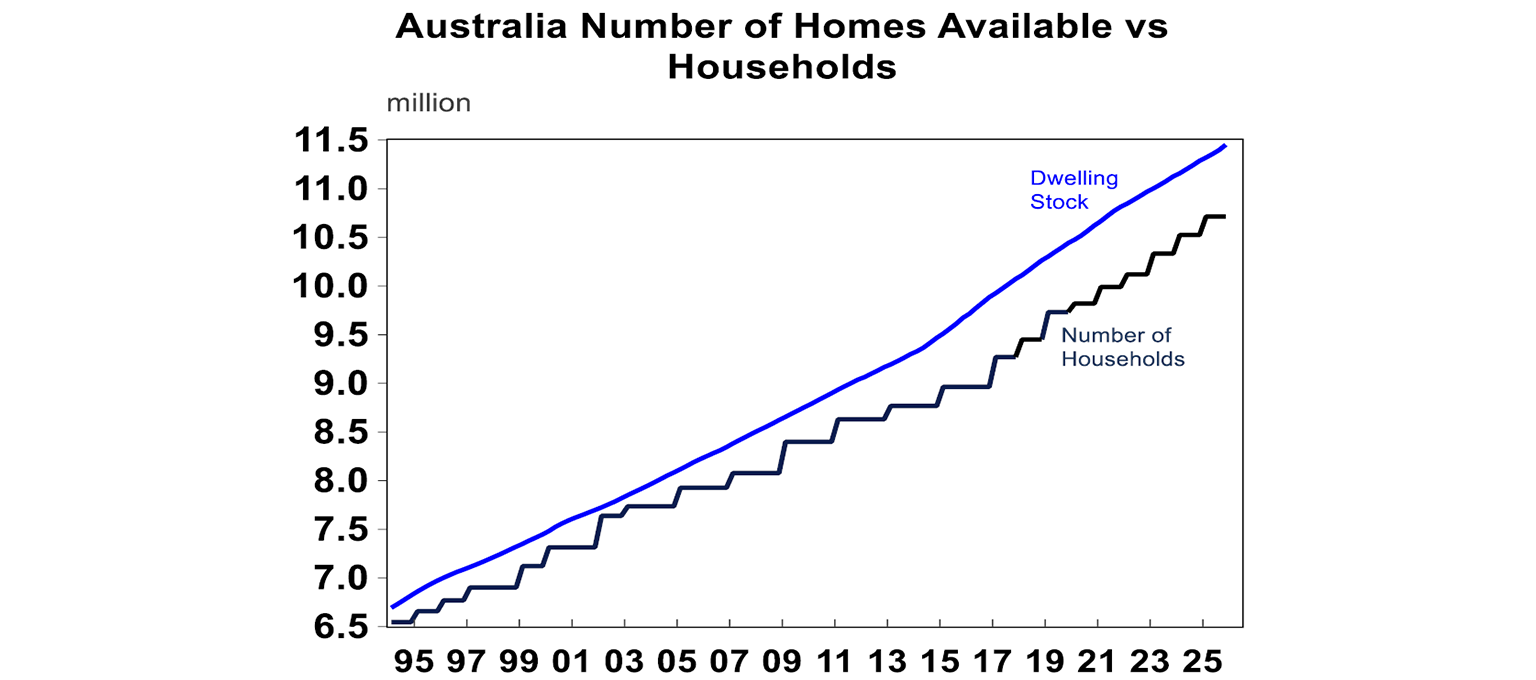
The issue is that this doesn’t account for where people want to live, or holiday homes or homes under renovation. In other words, there is a stock of unoccupied dwellings. At the last Census in 2021, data showed that 10% of dwellings were unoccupied. So while technically there may be enough properties in the whole of Australia to house all the households, they may not all be appropriate as a dwelling.
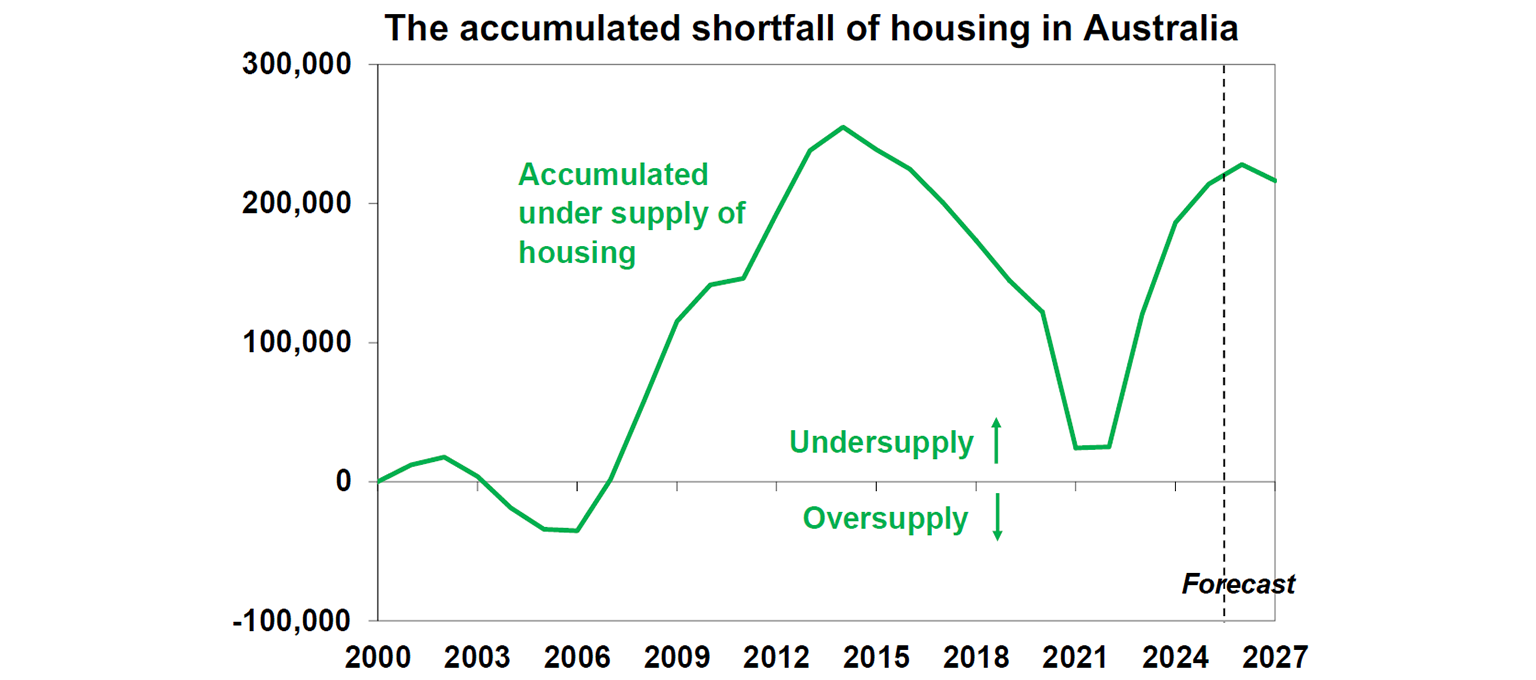
We look at the supply imbalance through the lens of housing demand which is basically the population and household size and housing supply which is simply completions. This analysis shows us that our housing undersupply really took off from the mid 2000’s and we are currently around 200,000 dwellings in “undersupply”.
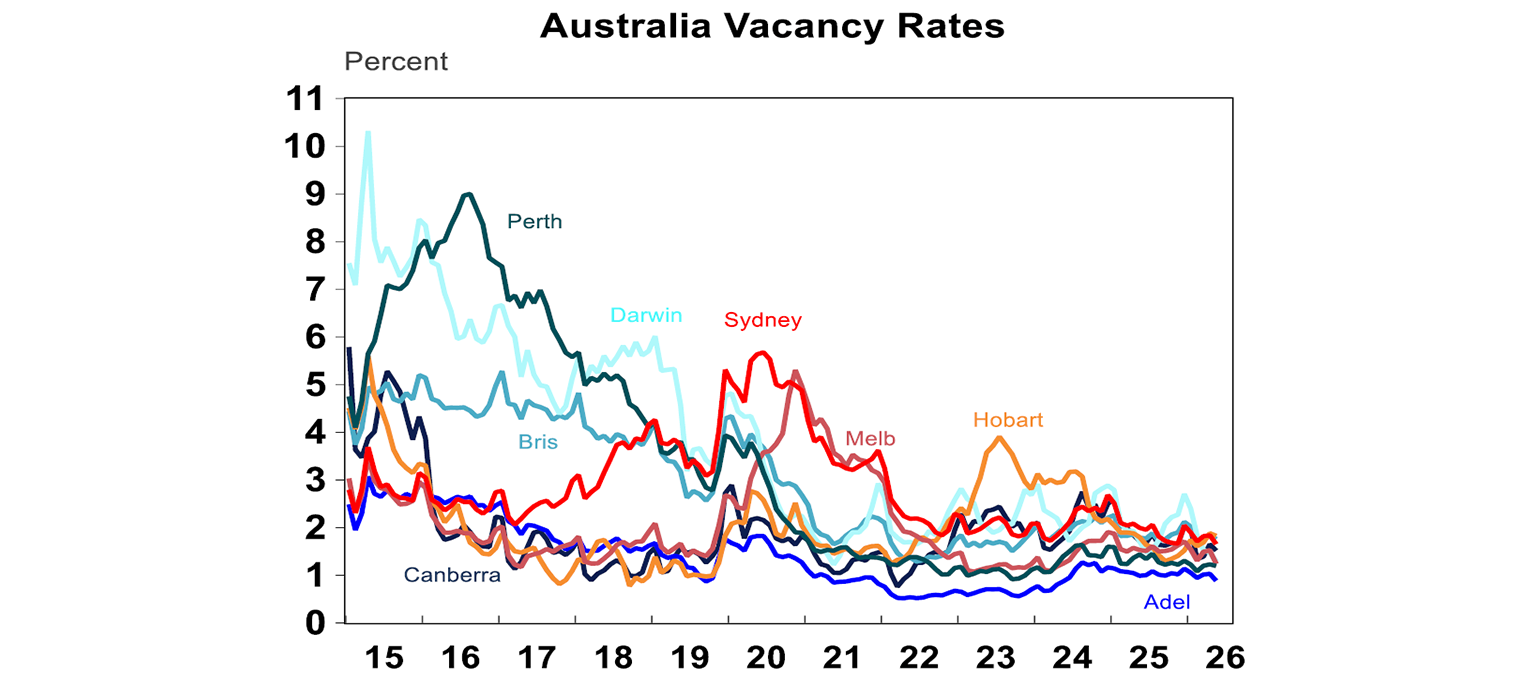
This explains why vacancy rates in the rental market are around historical lows across all capital cities.
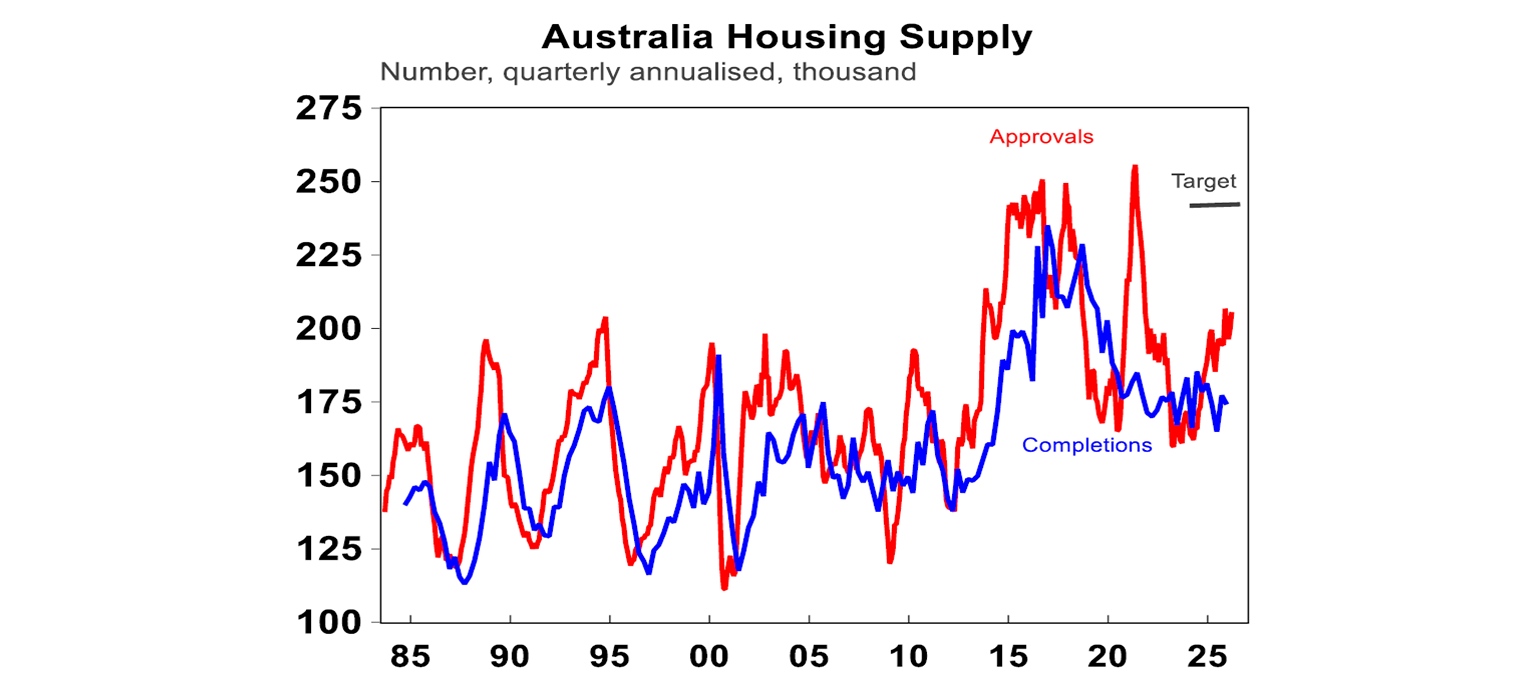
The good news is that in recent months, approvals have been ticking up (see the chart below), indicating that housing completions should be close to ~200,000 from current levels of 174,000. But we should be building close to 240,000 homes per year to keep up with current demand (of around 200K per annum) and to start making a dent in the supply gap of homes. The trouble is that recent RBA rate hikes and the risk of more hikes later this year point to the risk of falling building approvals from here.
Treasury estimates that net housing supply will increase by 30,000 homes over 10 years due to the recent tax changes & higher infrastructure spending (which should help with new home building). But this is not enough to move the dial on supply.
Why is it hard to increase supply? Its many things. Slow planning, approval and zoning processes, shortage of construction workers, very high costs of construction and regulation and slow productivity growth in construction (the number of dwellings completed per hour worked by housing construction workers has declined by 53% in the last 30 years while broader labour productivity in the economy has increased by 49%).
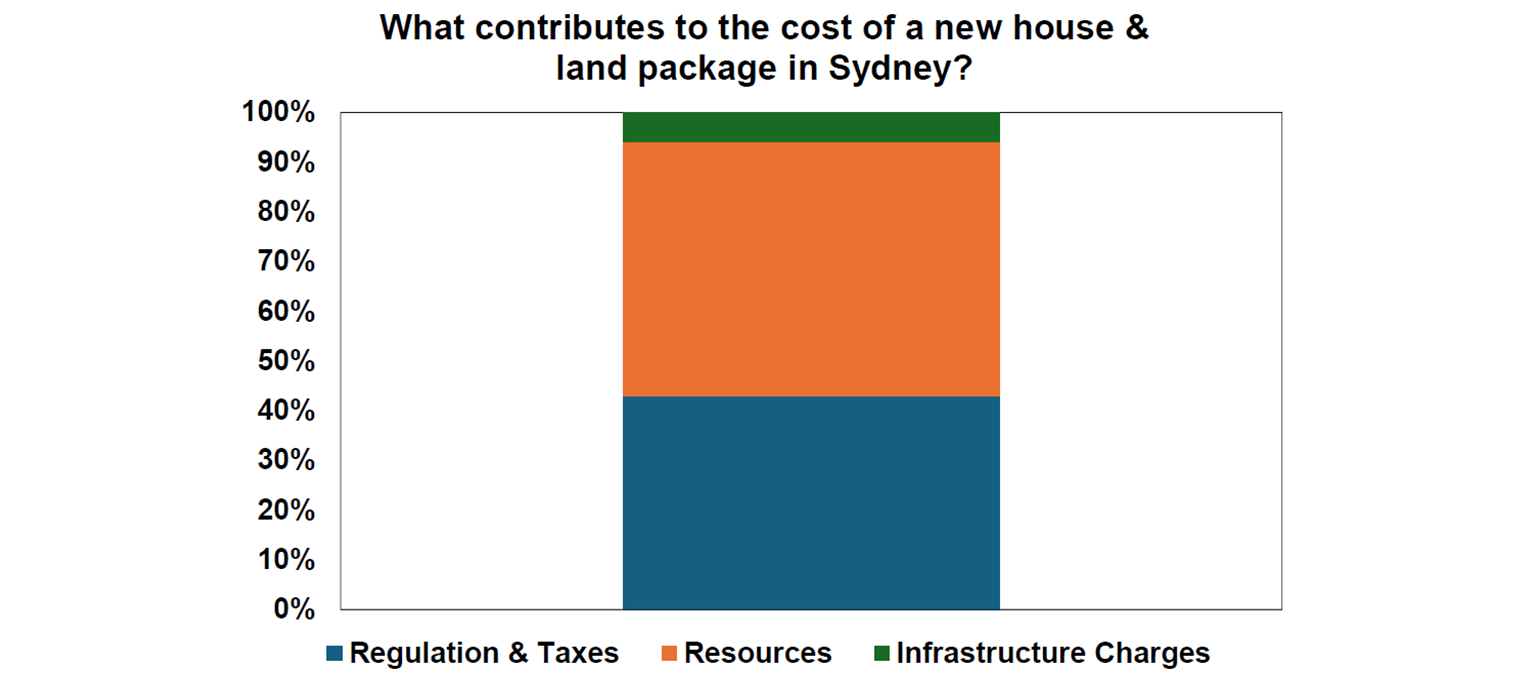
The high regulatory burden is evident in the cost of a new house and land package in Sydney (see the chart below) with 43% of the cost just due to regulation and taxes.
Implications for investors
For existing property investors, the capital gearing and negative gearing impacts will have a negligible impact on the return on their existing investments. New housing investors will try to target high yielding properties, with these opportunities more available in regional areas. Slower investor activity is likely in the next 12 months, but it’s unlikely to completely cease.
The expected slowing in home prices is not enough in itself to generate a serious economic downturn in Australia. Lower wealth growth will limit household spending but this is also helpful to get inflation to be a bit lower. It could make the RBA’s job a little easier.
Given the 50+% growth in home prices that have occurred in Australia in less than 5 years, a short-term adjustment with lower home prices is needed to rebalance affordability.
Diana Mousina
Deputy Chief Economist, AMP
Subscribe to Oliver's Insights
You may also like
-

Oliver's insights Economics of happiness 28 July 2026 . The basic “economic problem” which economics is focussed on solving is: how to maximise utility or satisfaction when human wants are unlimited but resources available to satisfy those wants are limited. Of course, utility is basically happiness, so economics is all about happiness. -

Weekly market update - 24-07-2026 Renewed global worries weighed on the Australian share market which fell around 0.3%, but with its lower exposure to tech shares providing some protection. -

Oliver's insights Charts to watch 21 July 2026 Share markets had a strong first half despite the oil supply shock as expectations for de-escalation, okay economic data, strong profits and the AI boom provided an offset.
Important information
Any advice and information is provided by AWM Services Pty Ltd ABN 15 139 353 496, AFSL No. 366121 (AWM Services) and is general in nature. It hasn’t taken your financial or personal circumstances into account. Taxation issues are complex. You should seek professional advice before deciding to act on any information in this article.
It’s important to consider your particular circumstances and read the relevant Product Disclosure Statement, Target Market Determination or Terms and Conditions, available from AMP at amp.com.au, or by calling 131 267, before deciding what’s right for you. The super coaching session is a super health check and is provided by AWM Services and is general advice only. It does not consider your personal circumstances.
You can read our Financial Services Guide online for information about our services, including the fees and other benefits that AMP companies and their representatives may receive in relation to products and services provided to you. You can also ask us for a hardcopy. All information on this website is subject to change without notice. AWM Services is part of the AMP group.