





Weekly market update
Investment markets and key developments
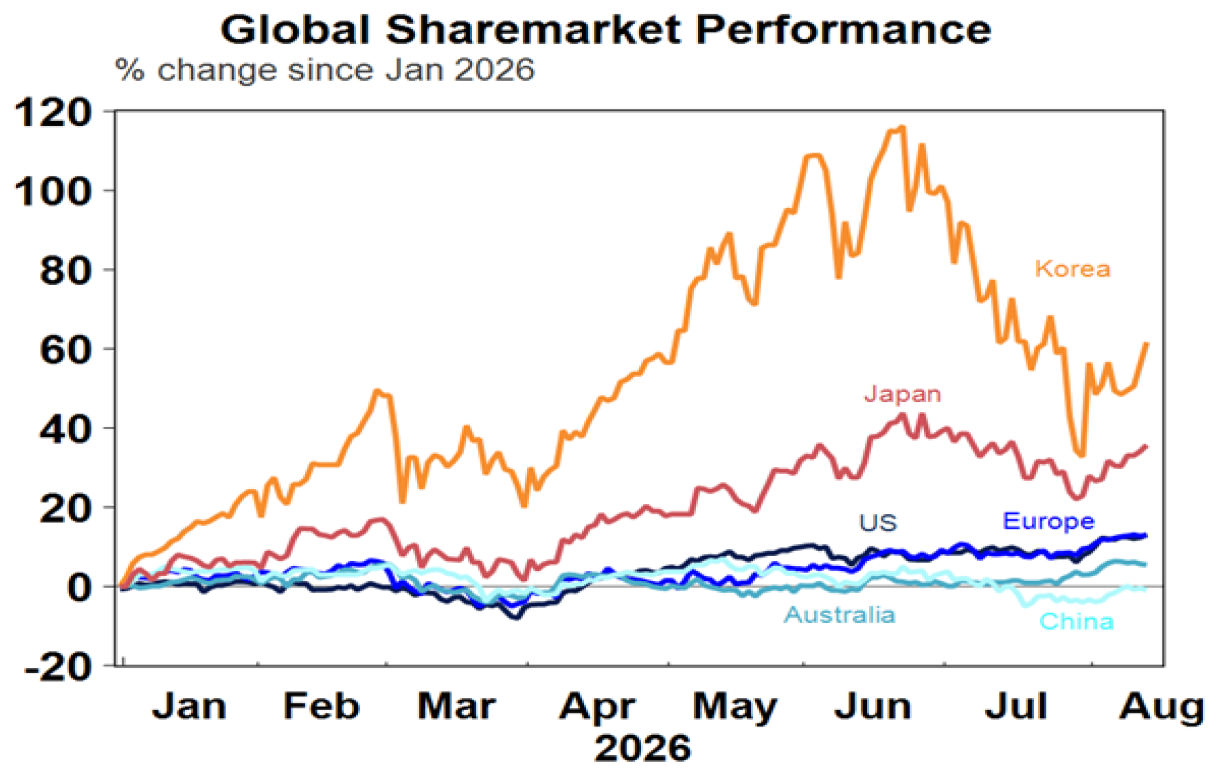
For the week US shares rose 0.4% and Eurozone shares rose 0.3% with both making new record highs, and Japanese shares rose 4.7%. The Korean share market has broken its downtrend after long positions were washed out into a 39% fall, with a similar story in semi conductor stocks.
10 min read

Global share markets mostly rose over the last week helped by good earnings results and some moderation in expectations for Fed rate hikes. For the week US shares rose 0.4% and Eurozone shares rose 0.3% with both making new record highs, and Japanese shares rose 4.7%. The Korean share market has broken its downtrend after long positions were washed out into a 39% fall, with a similar story in semi conductor stocks. Chinese shares fell 0.6% though. Despite the positive global lead, Australian shares fell around 1.6%, which was partly a correction after a 5.6% rise in the prior two weeks left them overbought but earnings reports are off to a slightly soft start with worries about slowing housing finance commitments weighing on the banks and sharp falls in industrial, property and material shares also weighing on the market. And of course, the Australian share market doesn’t have much exposure to the AI related stocks that are back in favour again.
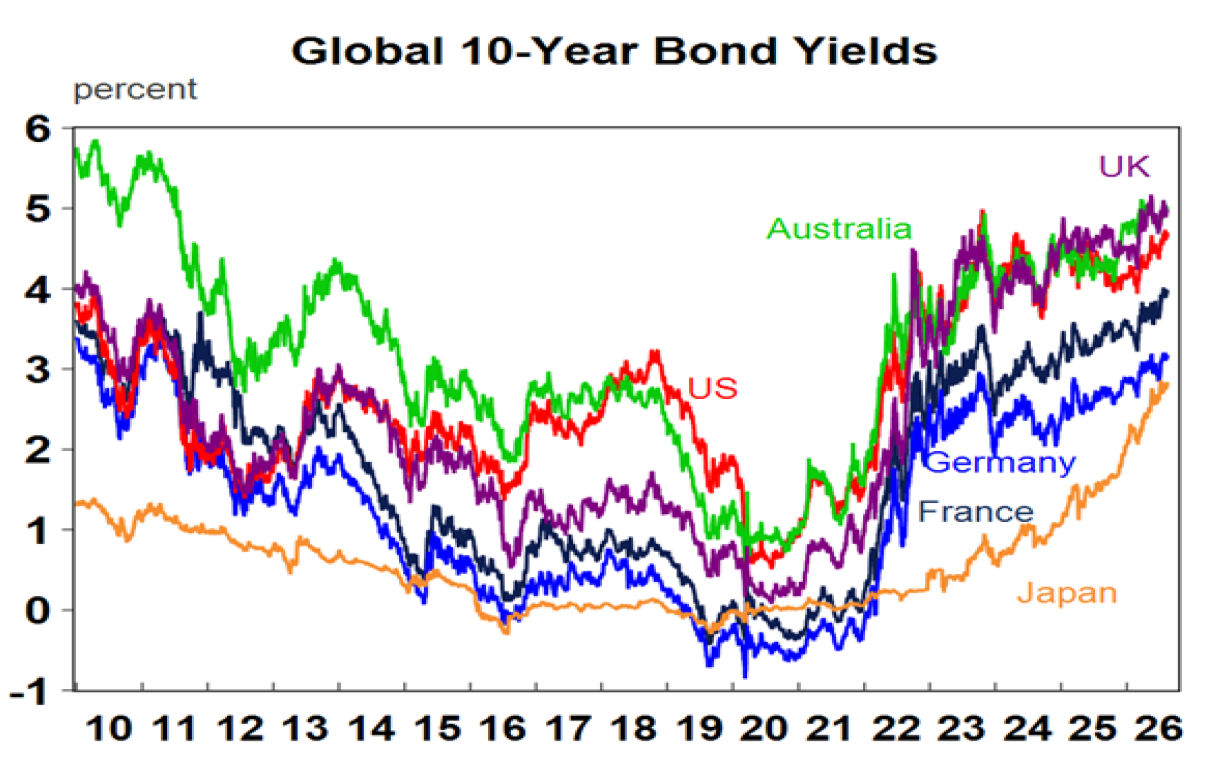
Bond yields mostly rose over the last week, not helped by higher oil prices. Metal, gold and iron ore prices rose slightly. Bitcoin fell but is managing to hold above support around $US60,000, although it has yet to confirm that the latest crypto winter – which has seen a 53% fall from the high in October last year - is over. While the $US rose slightly the $A also pushed up closer to $US0.71.
Oil prices had another bounce as there is still no deal to re-open Hormuz (to get up back to where we were before the War started), let alone regarding Iran’s nuclear ambitions (which was the key point of the War in the first place).
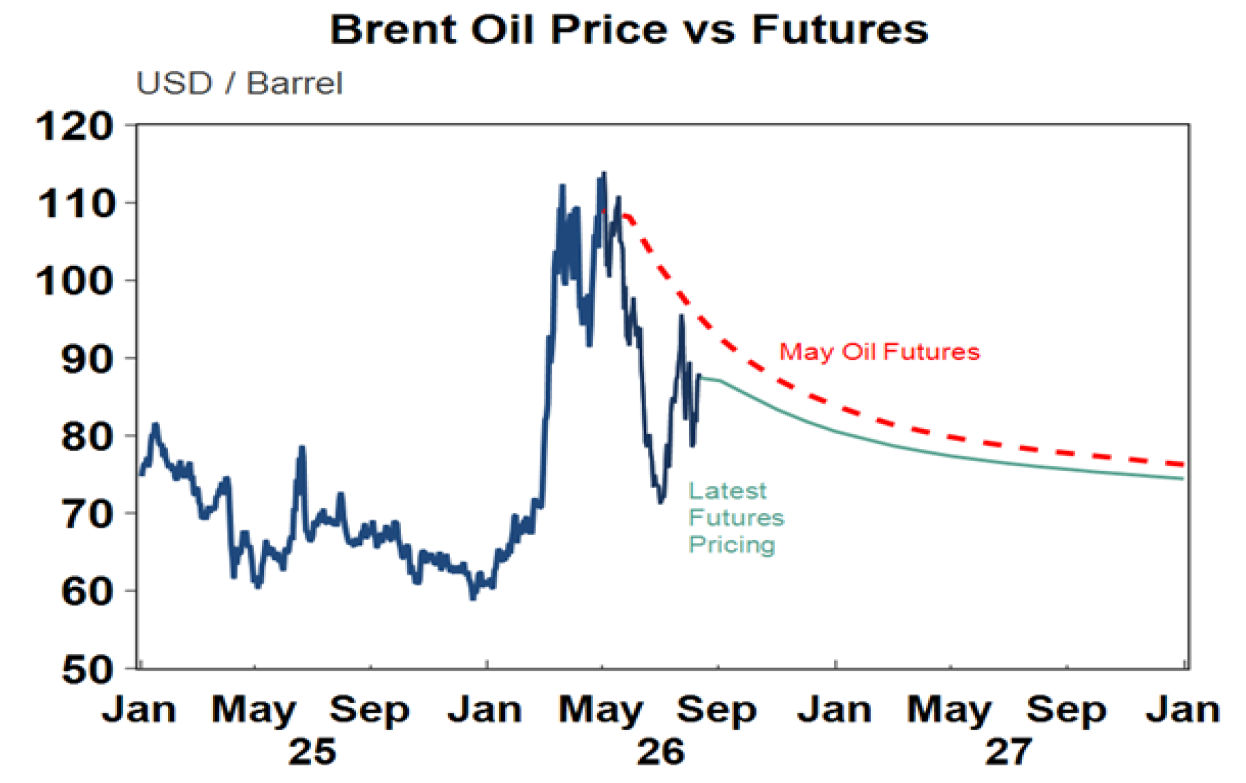
While there is still no resolution to the Iran/Hormuz impass, our base case remains that oil prices will stay in a $US70-100 range with Iran preventing it going lower and the US moving to try and calm things down whenever it gets above $US100. While shipping through Hormuz remains depressed, reports from US sources suggest that it is helping more shipping get through (with transponders turned off), but this is unclear. The risk remains that there will be no sustainable peace deal, the flow of oil out of the Middle East remains down 10-15% on normal levels and that we will have to face higher oil prices as reserves run down. This risk may escalate if Trump determines he has got nothing to lose by going a lot harder on Iran, maybe after the midterm elections.
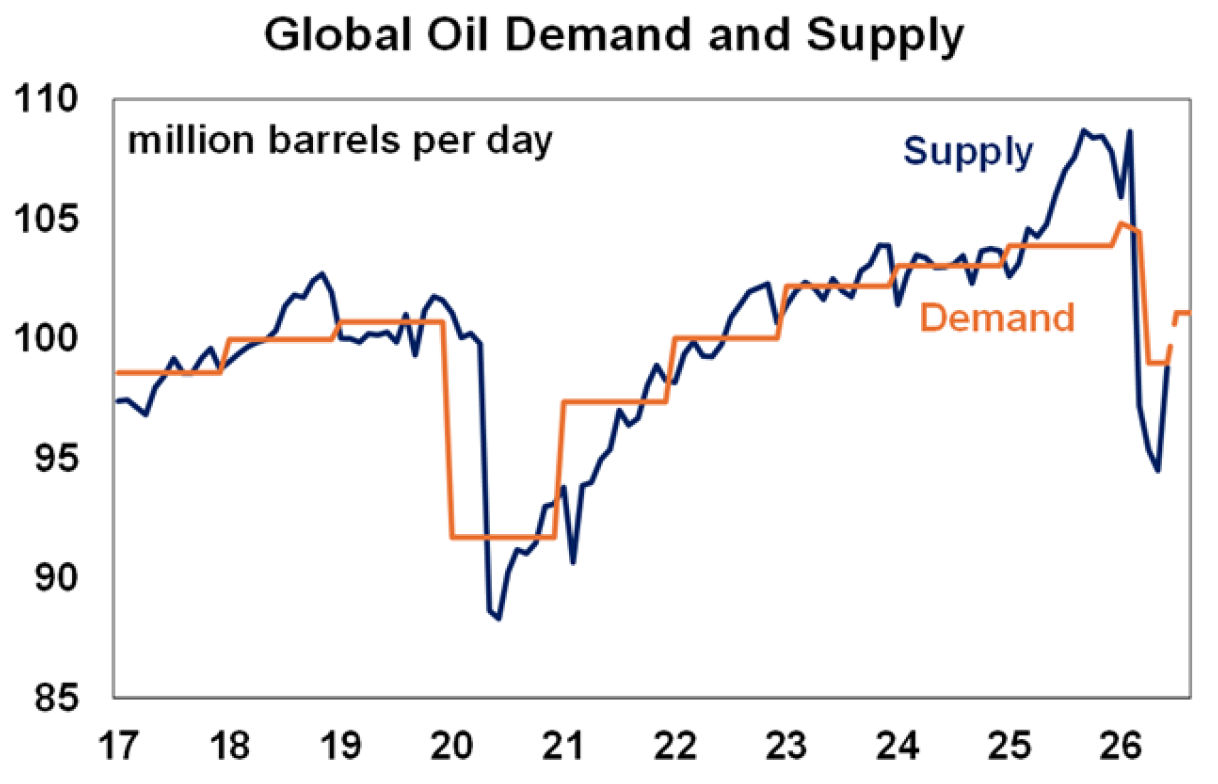
The next chart highlights the slump in the supply of oil since the War began. The global economy has been able to weather this by running down reserves which had built up ahead of the War with a large spike in supply and by some cutback in demand. Note though that some the fall in demand shown in the chart reflects countries like China cutting their purchases of oil as they dipped into reserves so may exaggerate the true fall in oil use. There was a bounce in supply with the brief reopening of Hormuz but there is a limit to how long the world can dip into reserves.
On the geopolitical front another issue to watch is the whether the escalation in the Russia/Ukraine war, marked by increasing attacks in Russia, leads to an aggressive Russian response like a “provocation” of NATO. Ukraine has been increasingly successful in bringing the war into Russia by attacking its energy industry and more than 20 Wildberries warehouses (which is similar to Amazon) to deprive it of export revenue and bring the war home to ordinary Russians. Ukraine’s aim is to bring Russia to talks but Russia may react by provoking NATO to try and get Europe to put pressure on Ukraine. Russia is unlikely to ultimately succeed but it could still briefly unnerve investment markets.
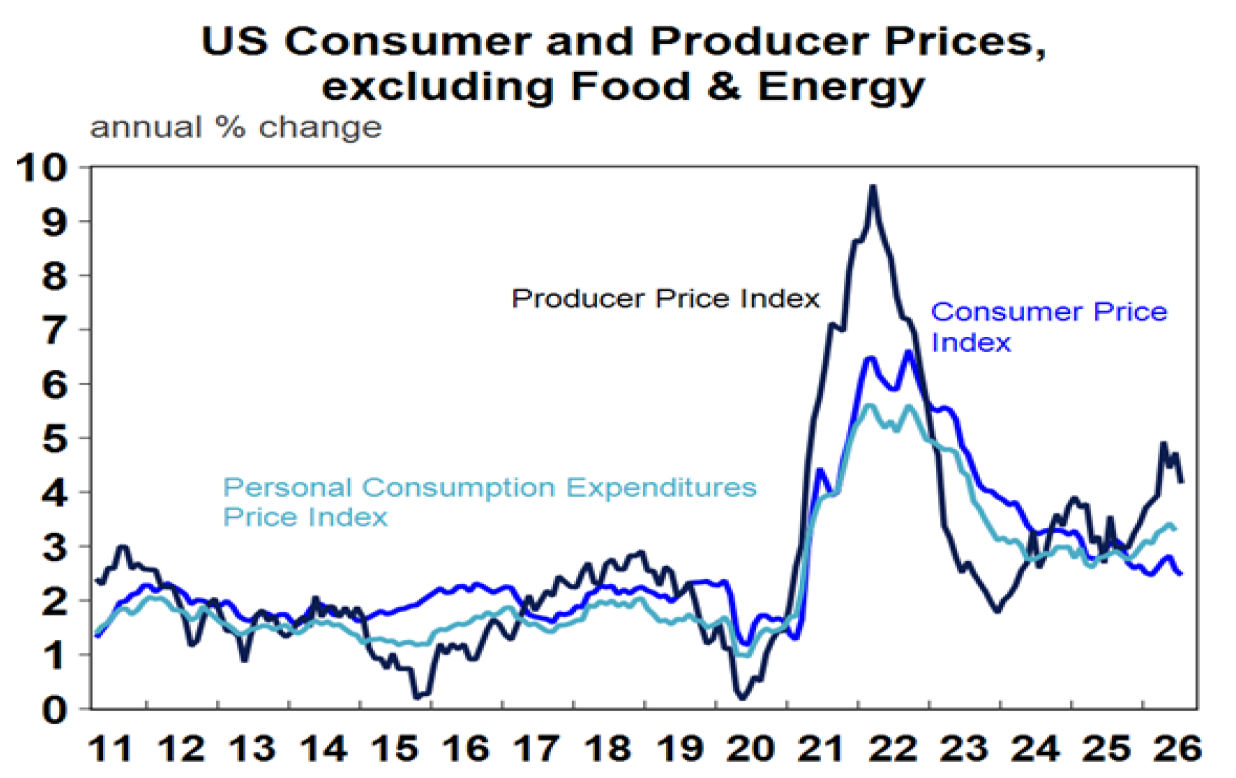
Benign July US CPI means less pressure on the Fed for a rate hike (for now). The core CPI rose an as expected 0.2%mom seeing the annual rate drop back to 2.5%yoy. Producer price inflation also fell but key components were a little bit stronger. Together this implies that the more important core private final consumption deflator will also rise around 0.2%mom and remain at 3.3%yoy. This is still too high but key Fed officials have nominated 0.2%mom or less as required to stay on hold so along with mixed jobs data and benign wages growth means that the Fed will probably stay on hold at its September meeting with the money market’s probability of a hike then dropping to 32%. However, it’s a close call though as projections for the core PCE are running around 0.24% unrounded so it could easily click up to 0.3%mom which is too high for many Fed officials and in any case there is another round of inflation and jobs data before the next Fed meeting. The money market continues to fully price in a hike by year end.
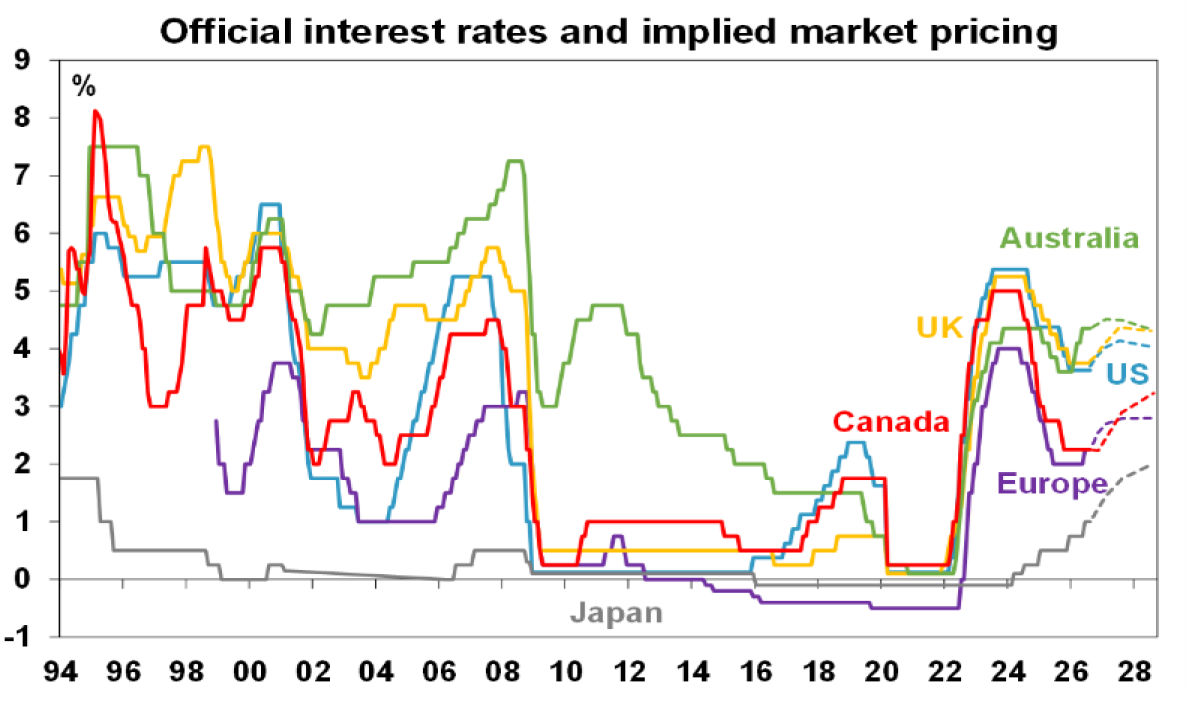
In Australia, the RBA left rates on hold as widely expected, but it signalled a clear tightening bias. Softer than expected readings for underlying inflation, jobs and house prices enabled it to remain in wait and assess mode. But it doesn’t see inflation back to target until late next year, sees the risks as being on the upside to this with Governor Bullock noting that it will raise rates further “if required”, that its “thinking very hard about when to raise” rates and that it only considered a hold or a hike in rates at the August meeting, not a cut. Of course, this could just be jawboning but it’s clear the RBA’s tolerance for more upside disappointment on inflation is low. And rightly so, as the credibility of the inflation target and the RBA is now at risk.
Against this background we expect another RBA hike by year end, possibly in September but probably in November, taking the cash rate to 4.6% as underlying inflation is likely to take too long to fall back to target and the RBA will need to do more to reinforce its credibility. The money market is now seeing a 56% chance of another hike by year end, albeit this is bouncing around with the oil prices.
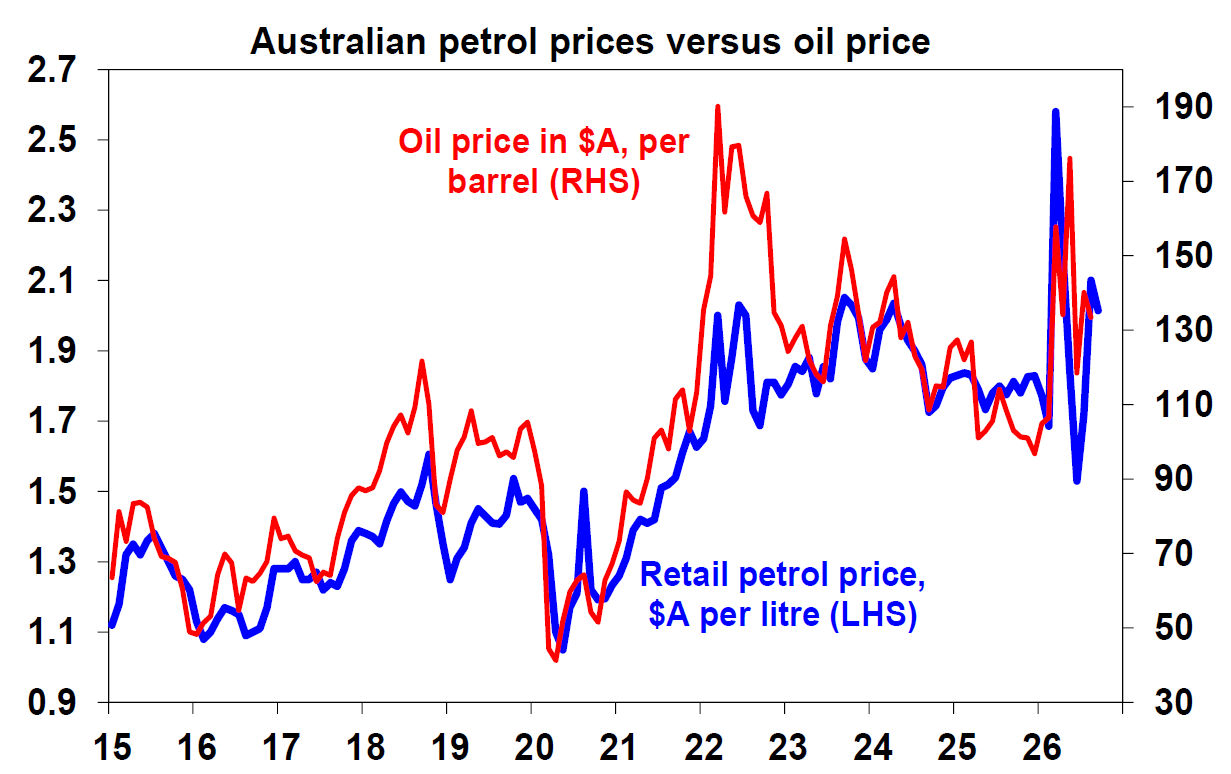
After spiking to around $2.10 a litre in early August on the back of the removal of the final half of fuel tax relief along with a spike in oil prices petrol prices in Australia have fallen back to around $2 a litre – well above their pre-War levels. They are now around roughly where you would expect them to be given the level of world oil prices.
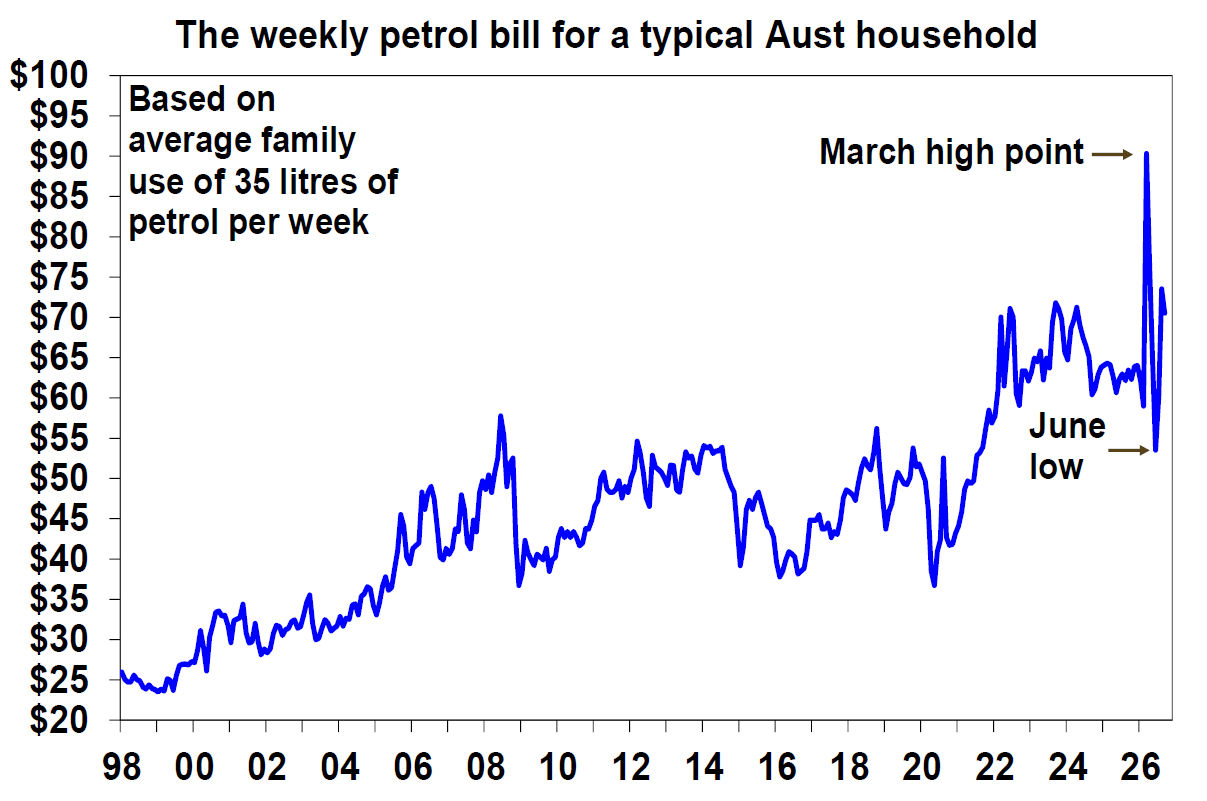
This leaves the weekly petrol bill for an average Australian household (of $70) at the high end of the range from the last five years, excluding the March high ($90.3). It’s about $8 a week above where it was over the year prior to the War.
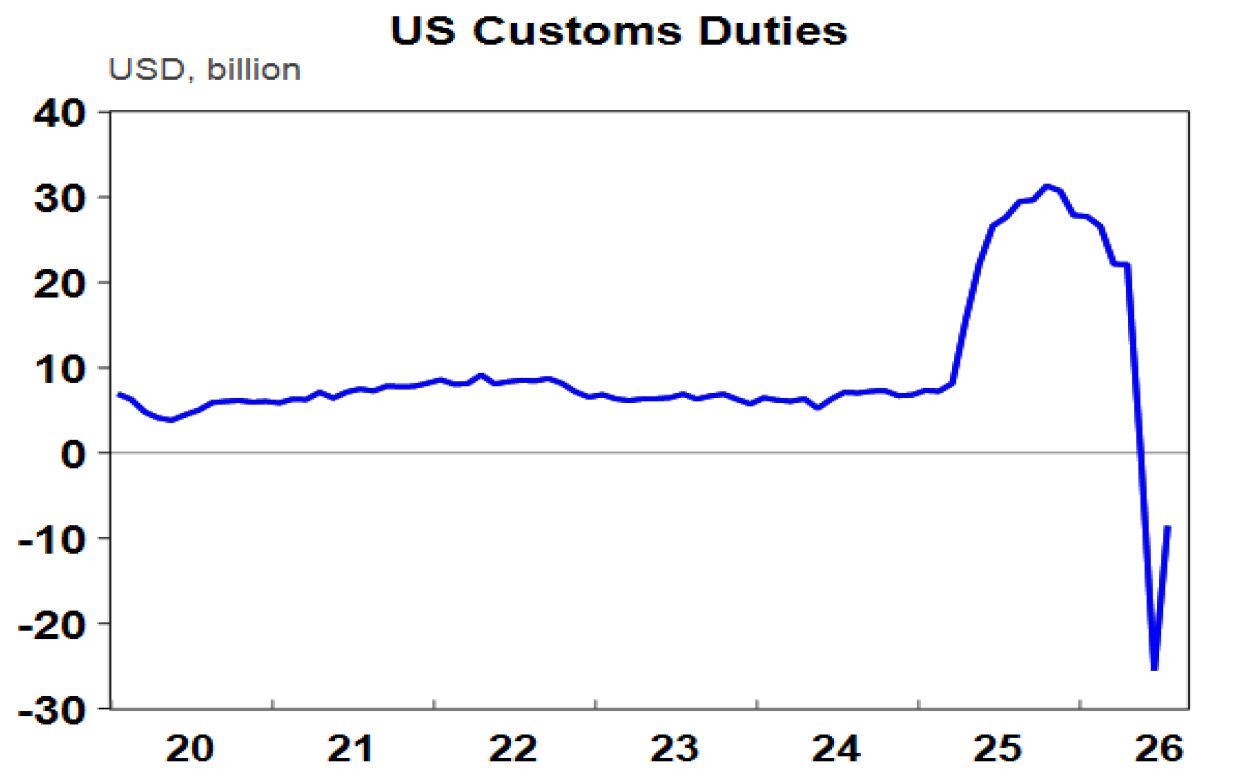
The roller coaster ride in US tariff revenue. Last year tariffs were the big story globally as Trump ramped them up into the so-called Liberation Day in particular. This saw custom duty revenue push above $US30bn a month in the second half of last year. But it’s gone negative this year as the Supreme Court ruled many of the tariffs illegal and so the US Government has had to pay out refunds. New “forced labour” tariffs of 10% and 12.5% depending on the country and soon to be announced “excess capacity” tariffs – both under a different laws – will see tariff revenues bounce back but probably only to around $US20-25bn a month.
16th August marks the 49th anniversary of Elvis leaving the building (or so I was told) so here’s my new favourite Elvis song Spinout again. And from a decade later a new take on his last hit while he was alive, Moody Blue.
Major global economic events and implications
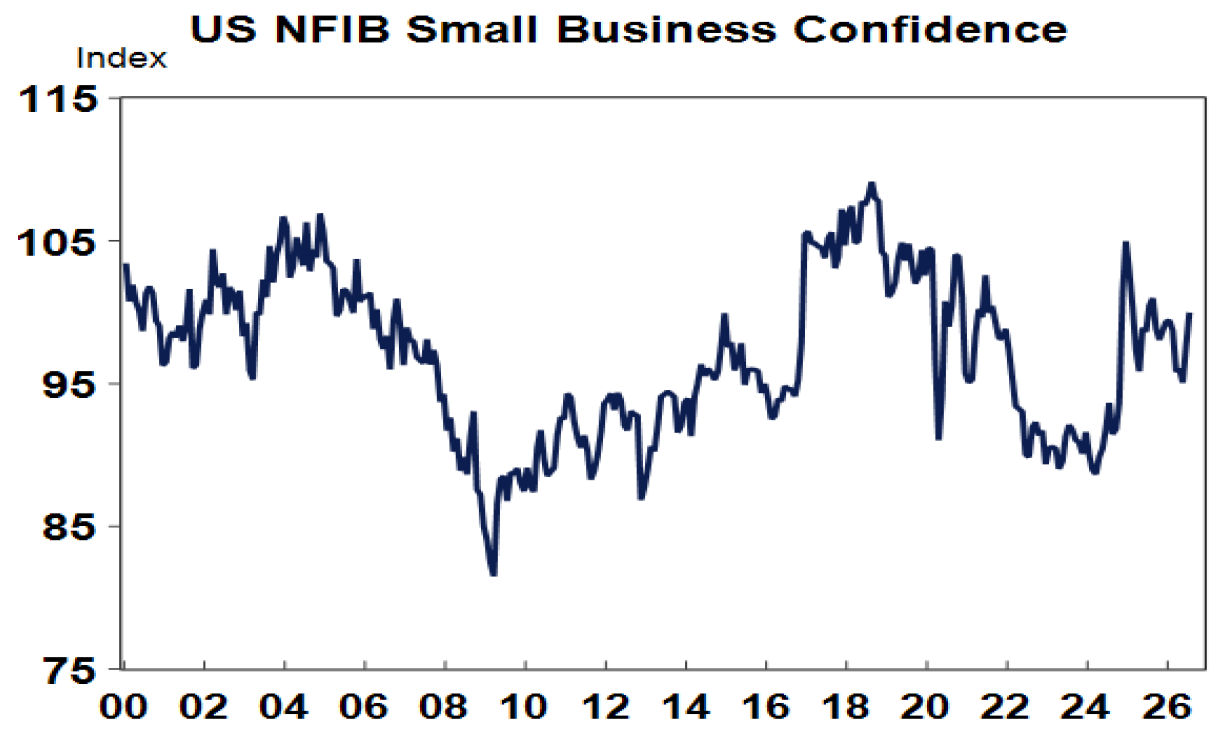
US economic data was a bit soft. Small business conditions rose and jobless claims remain low, but existing home sales remain weak, retail sales fell in July with downward revisions to prior months and consumer sentiment fell. It’s possible that the fading impact of enhanced tax refunds flowing from the OBBBA stimulus is starting to impact consumer spending.
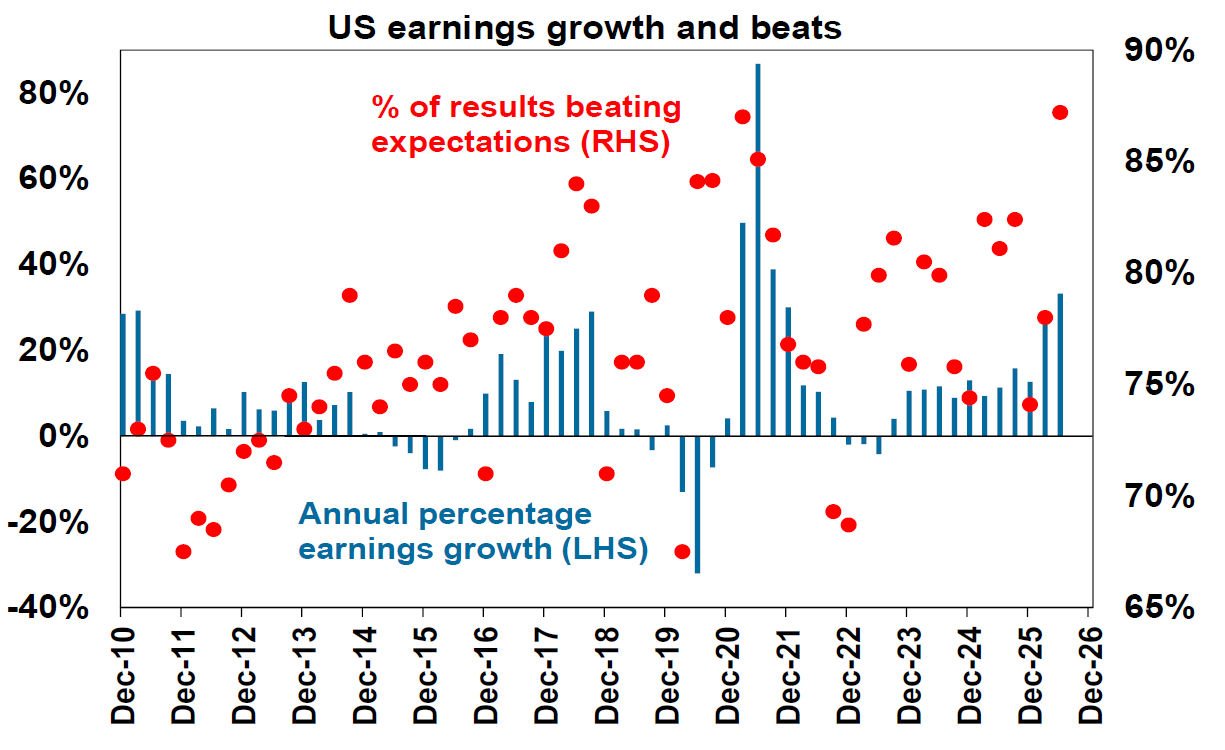
The US earnings reporting season has now seen more than 90% of S&P 500 companies report with around 87% exceeding expectations. The consensus expectation for earnings growth has now risen to 33%yoy. After adjusting for one off asset revaluations at Alphabet and Amazon its now blown out to 50%yoy. Earnings growth is being led by energy and tech companies. Capital spending by the top five hyperscalers has now been revised up by around 50% and while it initially caused some concerns, those concerns appear to have faded for now.
Eurozone and Japanese earnings growth is also up strongly.
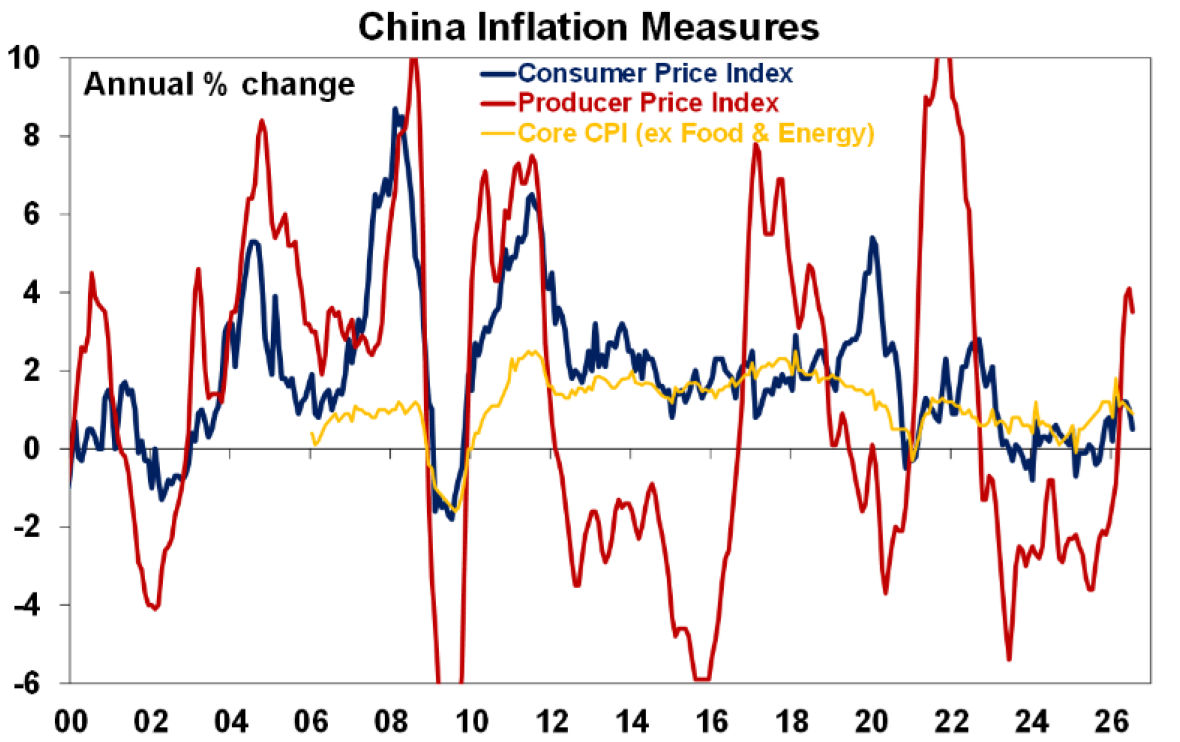
Chinese inflation fell more than expected in July with CPI inflation of just 0.5%yoy and core inflation to just 0.9%yoy. With the Chinese economy continuing to run a huge saving rate with significant excess capacity, inflation is unlikely to be a problem and the old saying that “whatever China exports it deflates” remains valid. EV’s are an obvious example. China continues to require more policy measures to encourage its consumers to consume.
Australian economic events and implications
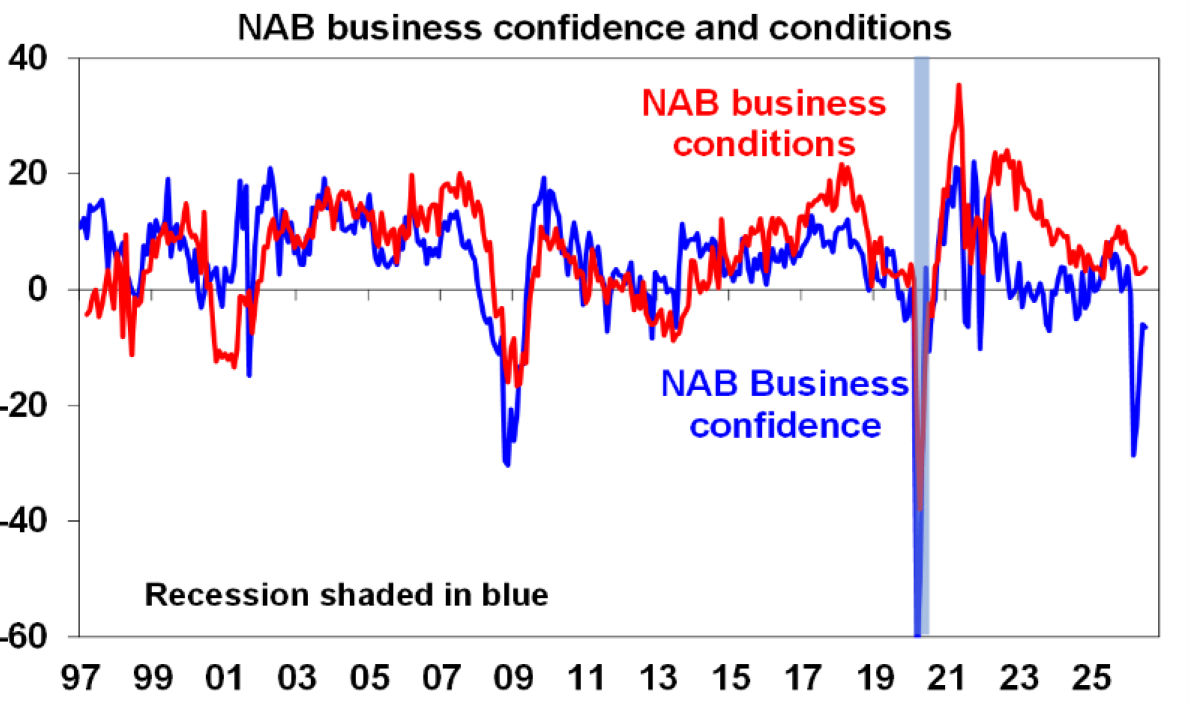
The July NAB business survey saw a slight improvement in business conditions, but confidence remained soft. Overall conditions look softish but there is no sign of collapse.
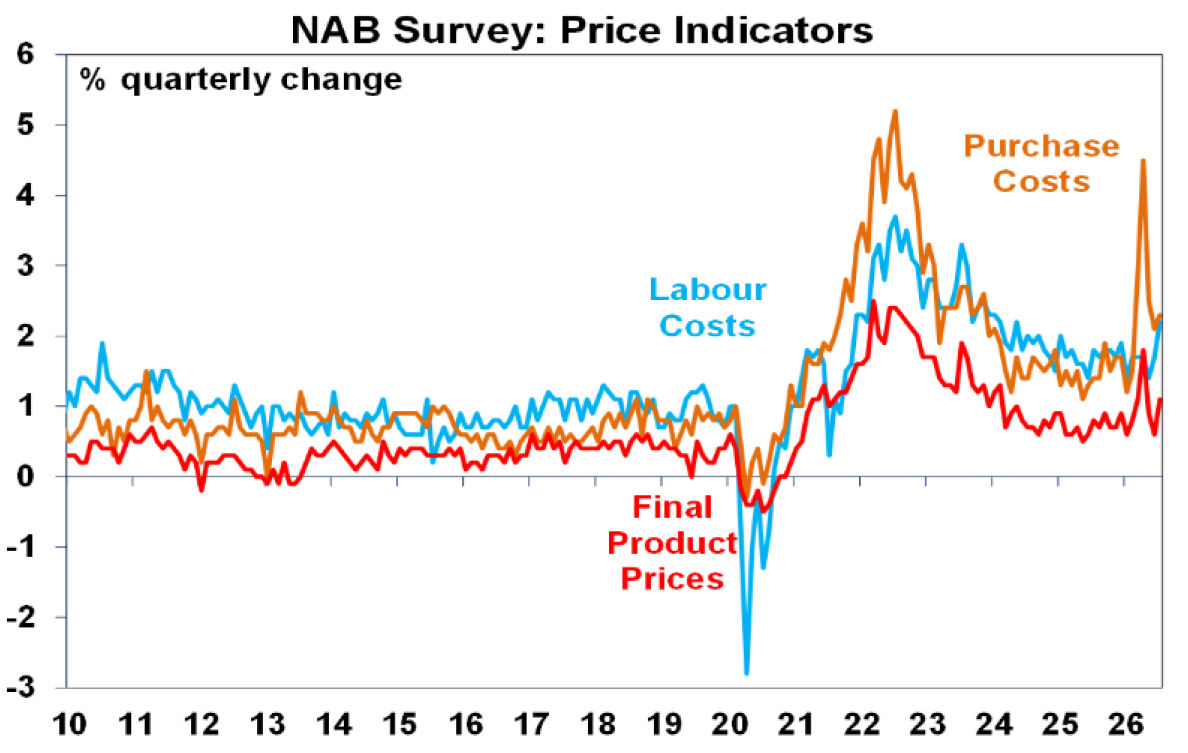
Meanwhile, the NAB survey showed that capacity utilisation rose and cost and price pressures all rose with labour costs rising to their highest since 2023 on the back of the latest rise in minimum and award wages. With these measures remaining above 2024-25 levels and even more above those seen in the pre-pandemic years it points to ongoing inflationary pressures.
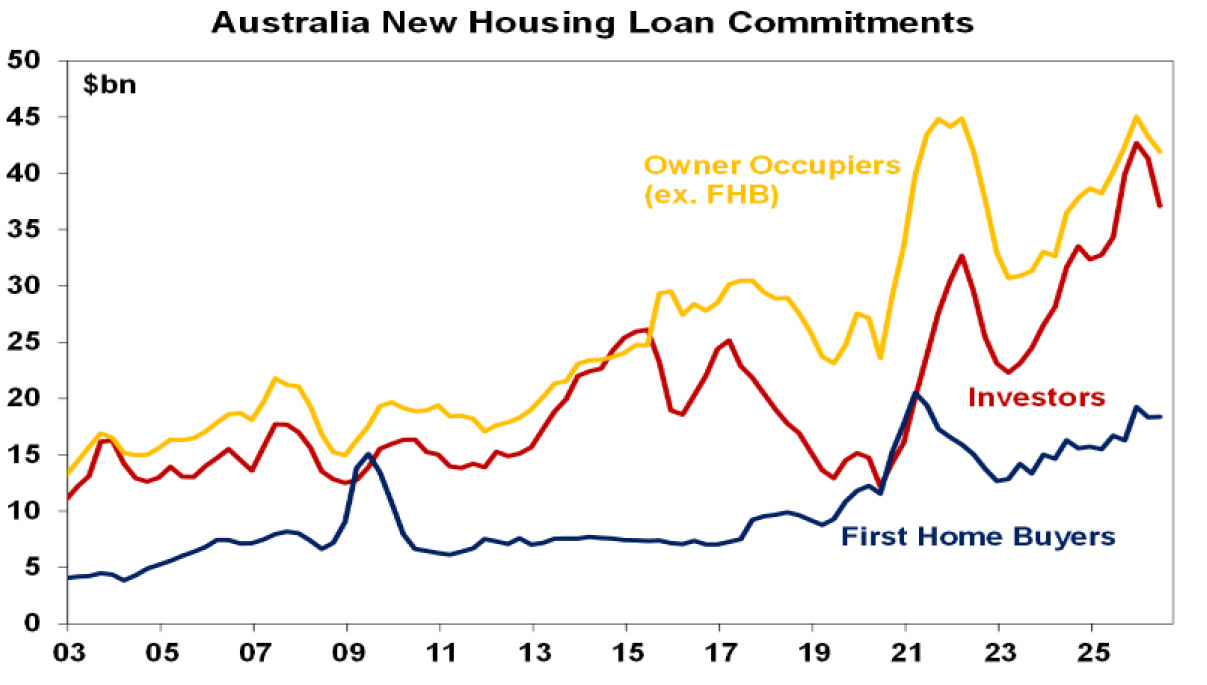
Housing finance commitments fell 5% in the June quarter as rate hikes, tax hikes on investors and poor buyer confidence hit. As would have been expected given the tax changes, finance commitments to investors (-10%) fell more than to owner occupiers (-2%), but there is likely further falls ahead as the Budget was only in the middle of the quarter and reports from the major banks indicate a 15-20% slump in mortgage applications since May (with one report of a 28% fall from investors). This is consistent with other indicators of a downturn in the property market. Fortunately, finance commitments for dwelling construction still rose for now.
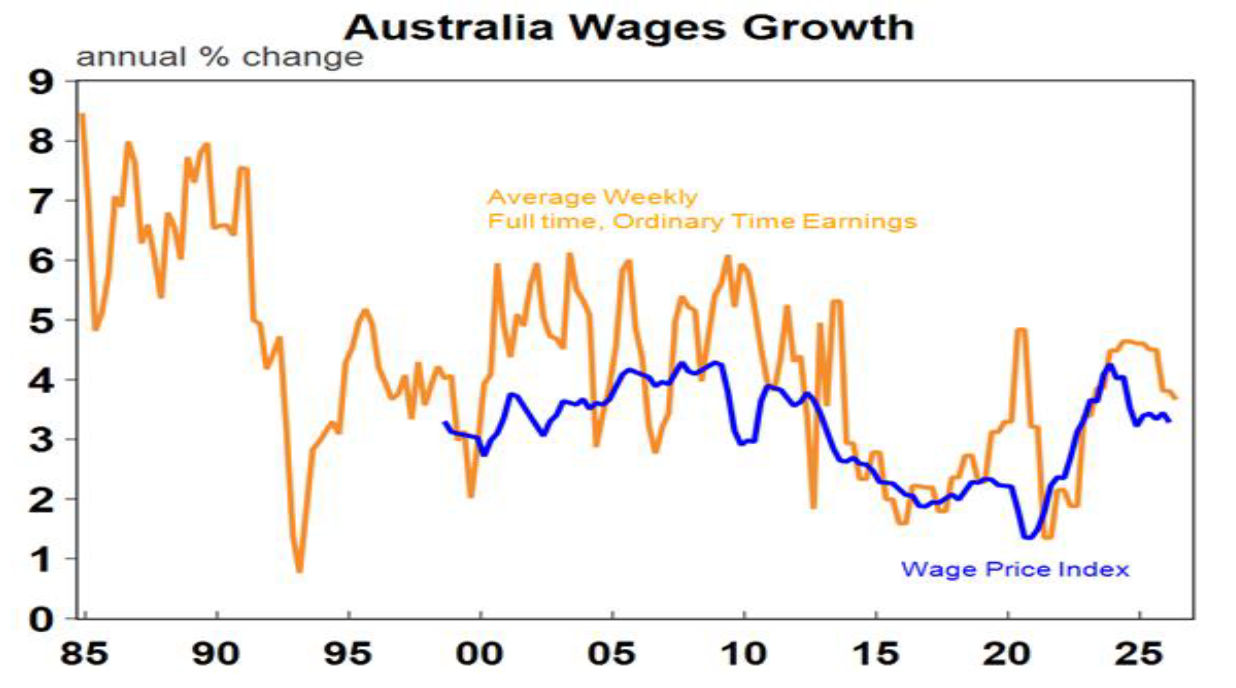
Average weekly earnings for full-time adult ordinary time workers slowed to 3.7% in the year to May its lowest since 2022. This measure is impacted by compositional change in the workforce and so tends to exaggerate the rate of wages growth for a worker doing the same job at the same level. This is best measured by the Wage Price Index and its running at 3.2%yoy. Whatever, it is both are running below inflation which was 4% over the year to May and highlight the slide in living standards. While the simplistic solution is to just force through higher wages growth this risks higher price rises unless it’s backed up by stronger productivity growth. So, the key is for government to undertake a round of productivity enhancing reforms of the sort economists have been talking about for years – deregulation, smaller government, tax reform, etc – to enable wages to rise at a faster pace without generating more inflation. I live in hope!
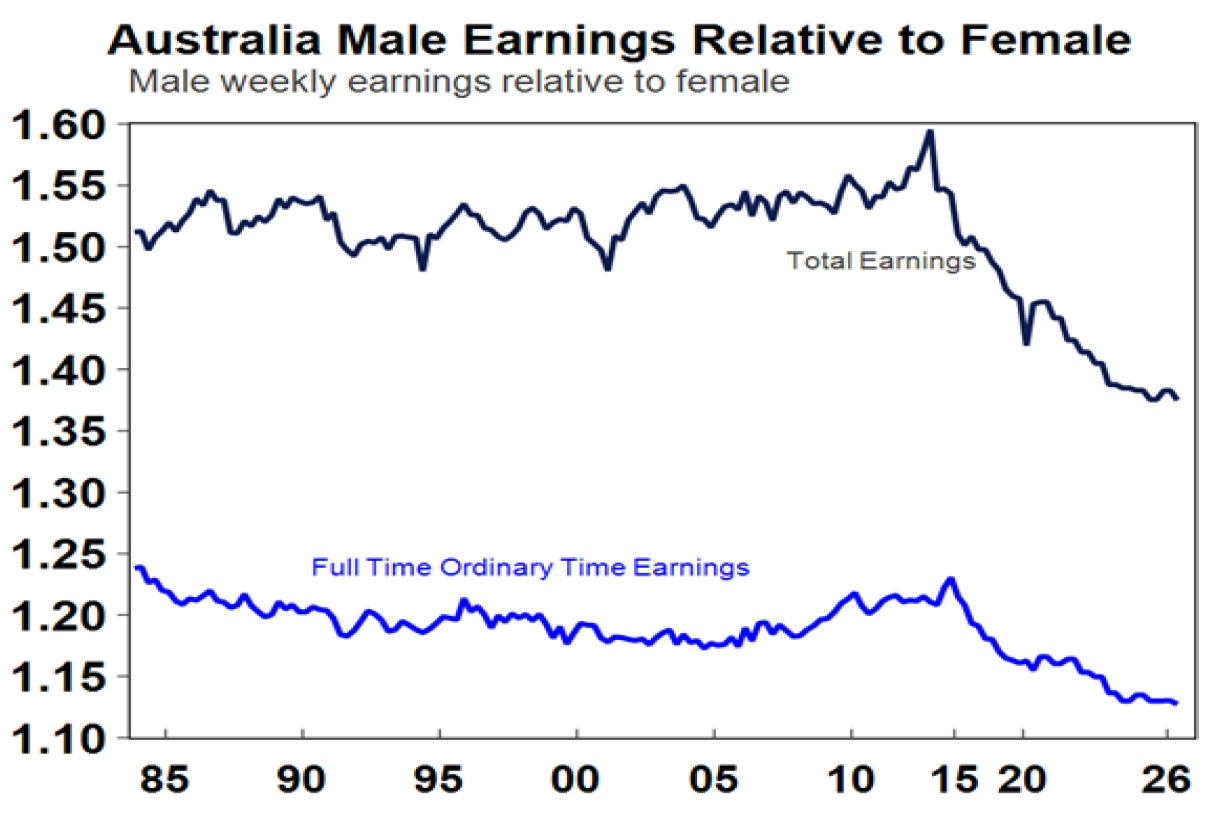
The gender pay gap remains, but at least its narrowing. The next chart shows that an average male employee still earns 38% more than an average female employee – see the dark blue line. Of course, this partly reflect males working more hours than females. If we compare full-time adult ordinary time earnings males earn 12.8% more than females – the blue line. The big factors here are likely to be women being disproportionately represented in roles and industries (like in accommodation, food services, retail and health care) that pay less than in the roles and industries that men are disproportionately represented (like mining, utilities, finance and insurance) and womens’ careers being disrupted by child bearing.
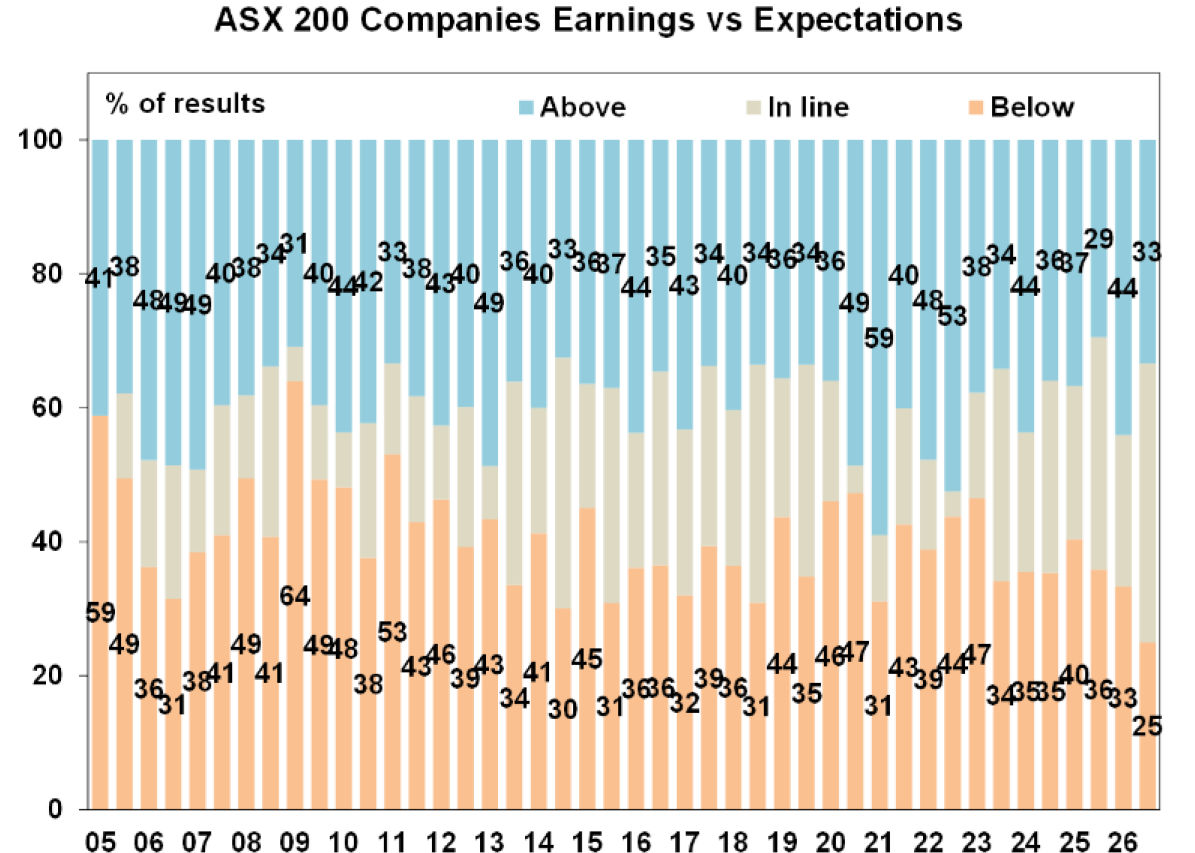
Its early days in the Australian June half earnings reporting season with only 22% of major companies having reported, but soft far the results are on the soft side. Profits are seeing a rebound after three years of falls but its subdued compared to the AI enhanced profit boom being seen in the US and elsewhere. The consensus expectation for 2025-26 earnings growth of 12% has already been revised down to 11.7% with 2026-27 earnings growth expectations also revised down slightly to 10.5%. Strength is narrowly based on a rebound in mining sector profits and solid growth for financials with profits in the rest of the market only likely to see growth of 2.5%. So far banks have been under pressure on concerns about slowing housing finance, Seek fell in response to a slowing jobs market and outlook statements are cautious particularly around the consumer and housing. Just bear in mind too that there is a tendency for companies with good results to report early so results may soften further over the next couple of weeks.
- So far beats are running above misses with 33% of results surprising consensus earnings expectations on the upside, but this is less than the norm of 40%, and just 25% have surprised on the downside which is less than the norm of 41%. But its early days and in aggregate the level of earnings have come in a bit less than expected so far.
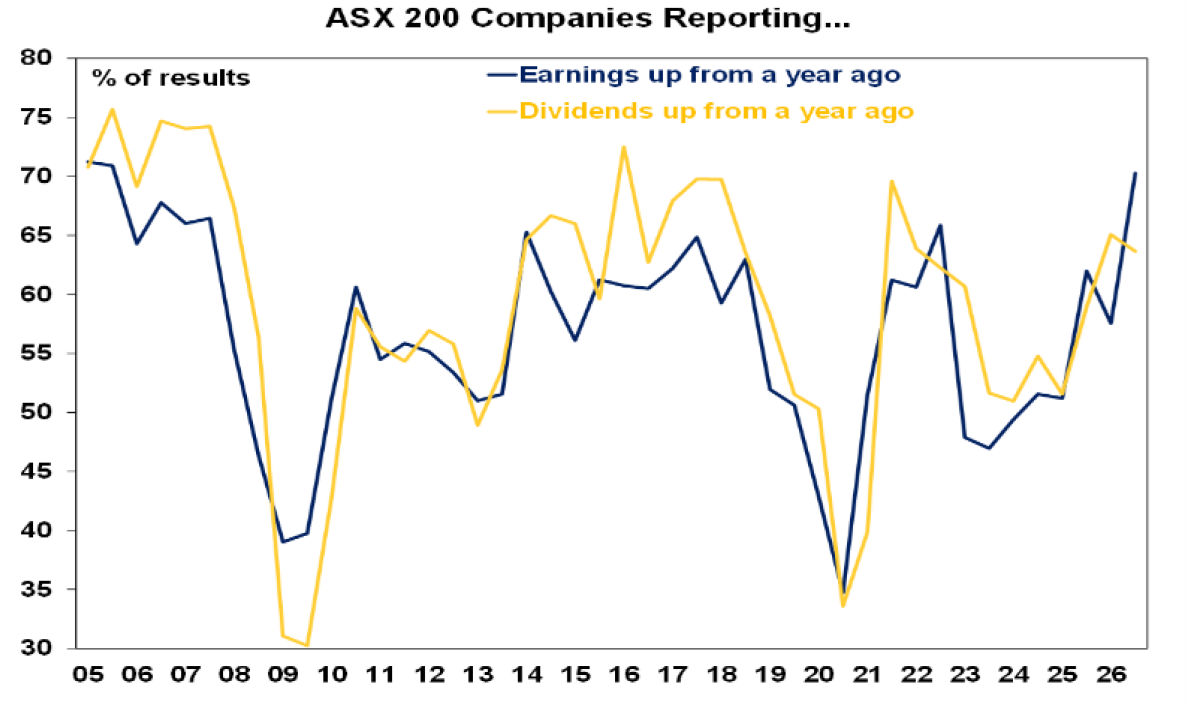
- 70% of companies have seen earnings rise on a year ago, and this is better than the norm of 56% and confirms the rebound in profits but as noted above its coming in a bit weaker than expected in aggregate.
- 64% of companies have increased their dividends on a year ago which is above the norm of 59%, but down slightly from the last reporting season.
What to watch over the next week?
In the US, expect home builder conditions (Monday) and housing starts (Tuesday) to remain soft, industrial production (also Tuesday) to rise modestly and key regional manufacturing conditions and the PMI for August (Friday) to show solid conditions.
Canadian inflation data for July (Monday) will likely show the core measures around 1.9%%yoy.
Eurozone business conditions PMIs for August (Friday) it likely to slow.
UK inflation data for July (Wednesday) is likely to show a core inflation around 2.5%yoy.
Japanese June quarter GDP (Monday) is likely to show reasonable growth of 0.5%qoq after 0.4%qoq in the March quarter with solid gains in consumer spending, business investment and trade a 0.4%qoq gain. July inflation (Friday) is likely to show a rise in core inflation to 1.3%yoy. The Japanese PMI for August (Friday) is likely to remain solid.
Chinese economic activity for July (Monday) is likely to show continuing subdued growth with industrial production up 4.9%yoy, but retail sales up just 1.5%yoy.
Australian wages growth for the June quarter (Wednesday) is likely to be unchanged at 0.8%qoq, resulting in annual growth slowing to 3.2%yoy, however it’s likely to spike in the current quarter reflecting the higher increase in minimum and award wages granted this year by the Fair Work Commission. Consumer confidence for August (Tuesday) is likely to have remained weak given the rebound in petrol prices and RBA hawkishness on rates. Jobs data for July (Thursday) is likely to show just a 3,000 gain in employment after the surprise surge seen in the previous two months with unemployment remaining at 4.4%. The business conditions PMI for August (Friday) is likely to slow slightly with ongoing cost and price pressures.
The Australian June half profit reporting season will continue with about 70 major companies reporting including in the week ahead including JB HiFi, NAB, BHP, HUB 24, Stocklands, Santos, Brambles, Dexus and TPG.
Outlook for investment markets
Global and Australian share markets are likely to remain volatile with the lack of any resolution to the Iran War and hit to global oil supplies, stretched valuations, sticky inflation, political uncertainty associated with Trump & the midterm elections and worries about the impact of AI and whether there is an AI bubble. However, returns should still be okay for the next 12 months as a whole thanks to continuing economic growth with recession avoided and strong global profit growth and likely rate cuts next year.
Bonds are likely to see returns around running yield or a bit less.
Unlisted commercial property returns are likely to be solid helped by strong demand for industrial property associated with data centres.
Australian home prices are expected to fall around 7% top to bottom, of which they have already done around 2%, out to the June quarter next year as a result of poor affordability, RBA rate hikes, reduced investor demand flowing from the winding back of negative gearing and the capital gains tax discount and poor confidence.
Cash and bank deposits are expected to provide returns around 4-5%.
The $A is likely to rise reflecting the wider interest rate differential to the US, although a move to Fed hikes may limit this. Fair value for the $A is around $US0.72.
Dr. Shane Oliver,
Head of Invesment Strategy and Chief Economist, AMP


You may also like
-

Weekly Market Update - 09-10-2026 - AMP Weekly Market Update: US shares near record highs but risks are bubbling, tech rally remains narrow, credit markets turn wary on AI & Firmus IPO shelved, French bond yields surge, and another immigration debate. -

Five things that could stop the data centre boom Discover five major challenges that could slow the data centre boom, from power constraints and regulation to costs, talent and infrastructure. -

What are AI shopping agents, and are they safe to use As agentic commerce agents become an increasingly common way to shop, learn the risks that may come with them, and some ways to use them more safely.
Important information
Any advice and information is provided by AWM Services Pty Ltd ABN 15 139 353 496, AFSL No. 366121 (AWM Services) and is general in nature. It hasn’t taken your financial or personal circumstances into account. Taxation issues are complex. You should seek professional advice before deciding to act on any information in this article.
It’s important to consider your particular circumstances and read the relevant Product Disclosure Statement, Target Market Determination or Terms and Conditions, available from AMP at amp.com.au, or by calling 131 267, before deciding what’s right for you. The super coaching session is a super health check and is provided by AWM Services and is general advice only. It does not consider your personal circumstances.
You can read our Financial Services Guide online for information about our services, including the fees and other benefits that AMP companies and their representatives may receive in relation to products and services provided to you. You can also ask us for a hardcopy. All information on this website is subject to change without notice. AWM Services is part of the AMP group.