


Weekly market update
Investment markets and key developments
A negative start to the weak due to signals from Trump that he would strike Iranian power plants and energy infrastructure, no signs of a broad reopening in the Strait of Hormuz and further deployment of 2,000 US soldiers of the elite US Army’s 82nd Airborne Division turned into mid-week confidence on signs of “constructive conversations” between the US and Iran and Trump indicating a pause on further strikes until March 27th.
12 min read

When I write our weekly market update I like to get a head start on it early in the week. But in these current times, this exercise would prove pointless as every day offers more twists and turns in the Middle East conflict and rhetoric from Trump. A negative start to the weak due to signals from Trump that he would strike Iranian power plants and energy infrastructure, no signs of a broad reopening in the Strait of Hormuz and further deployment of 2,000 US soldiers of the elite US Army’s 82nd Airborne Division turned into mid-week confidence on signs of “constructive conversations” between the US and Iran and Trump indicating a pause on further strikes until March 27th. But Iran rejected the US “15-point plan” which included demands for Iran to dismantle its nuclear facilities, reopen the Strait of Hormuz in return for a reduction in sanctions. Iran wants reparations for war damages, recognition of authority over the Strait of Hormuz and security guarantees. Earlier today, Trump indicated that he would not engage in further energy plant strikes and give the Iranians until April 6th to open the Strait of Hormuz. But on Friday the US and Israel bombed several nuclear targets and steel facilities in Iran while Iran launched strikes across the Persian Gulf causing the oil price to increase and stocks to fall. US Secretary of State Rubio said he expected the operation to conclude in “weeks, not months” and it does appear that both sides want to make a deal, as there are constraints on all the players in the conflict.
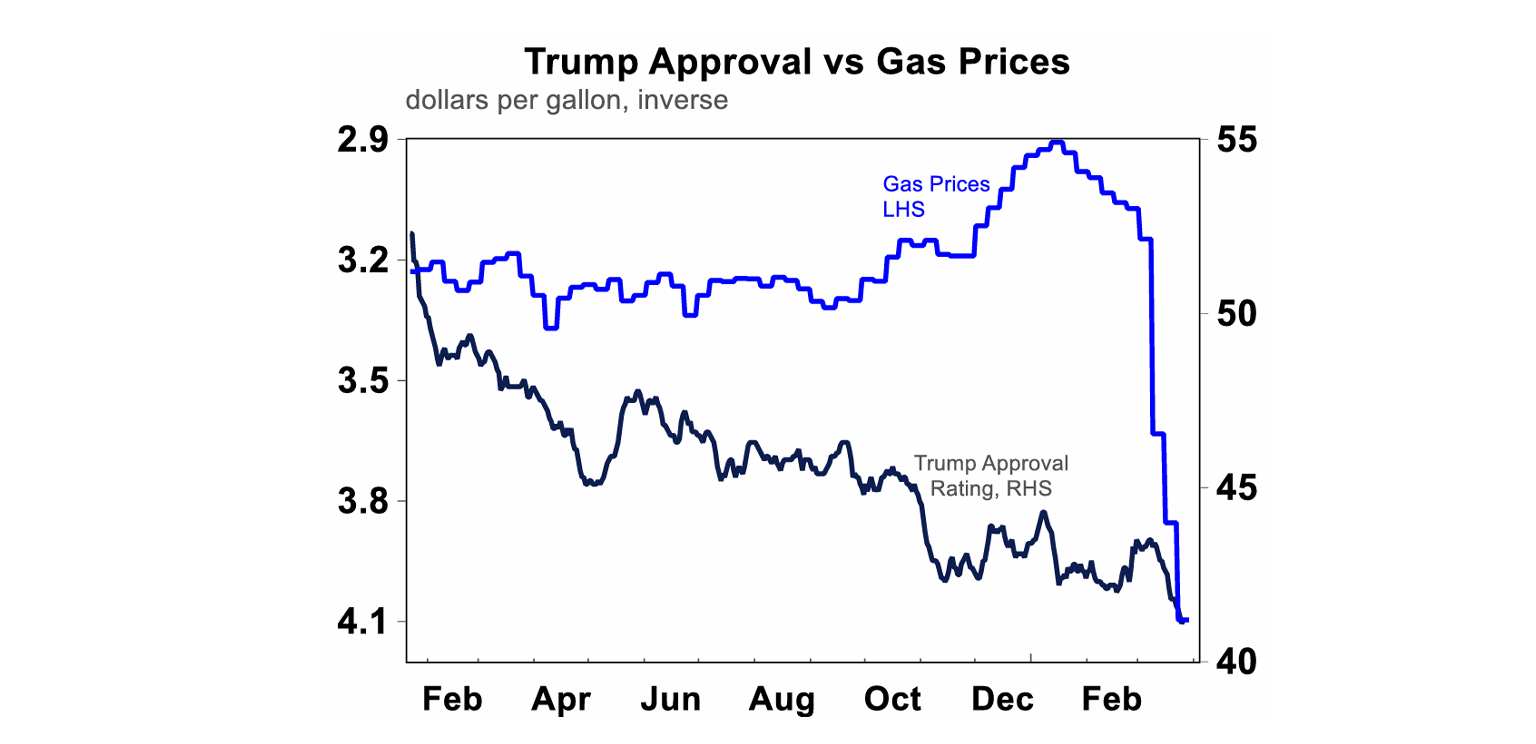
Trump is constrained by a falling (and now record low) approval rating, partly driven by rising gasoline prices – see the chart below.
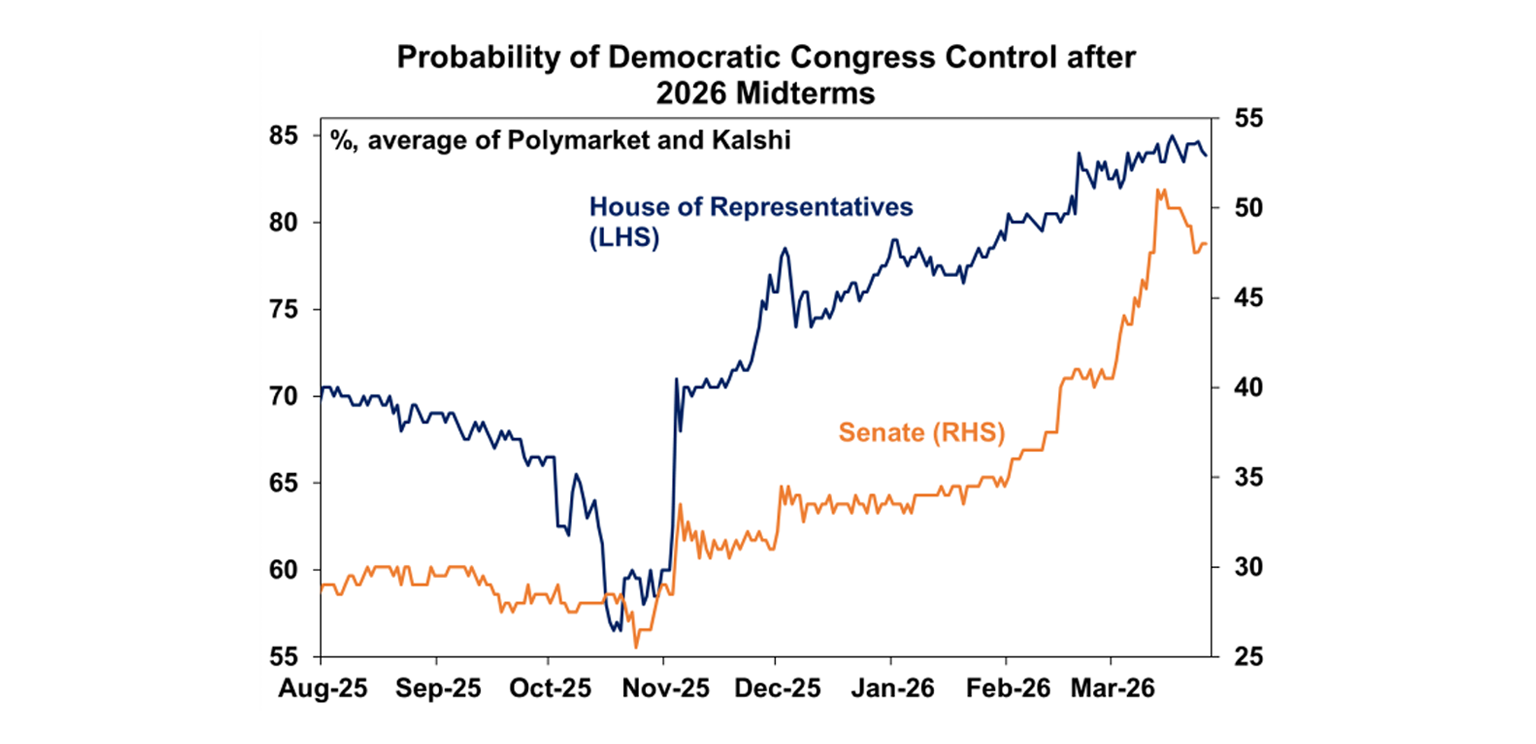
This is a massive problem for him heading into the November mid-term elections as the razor-thin Republican majority in the Senate is likely to be erased (see the chart below) which will likely see the Democrats impeaching Trump and the Republicans not being able to pass many policies.
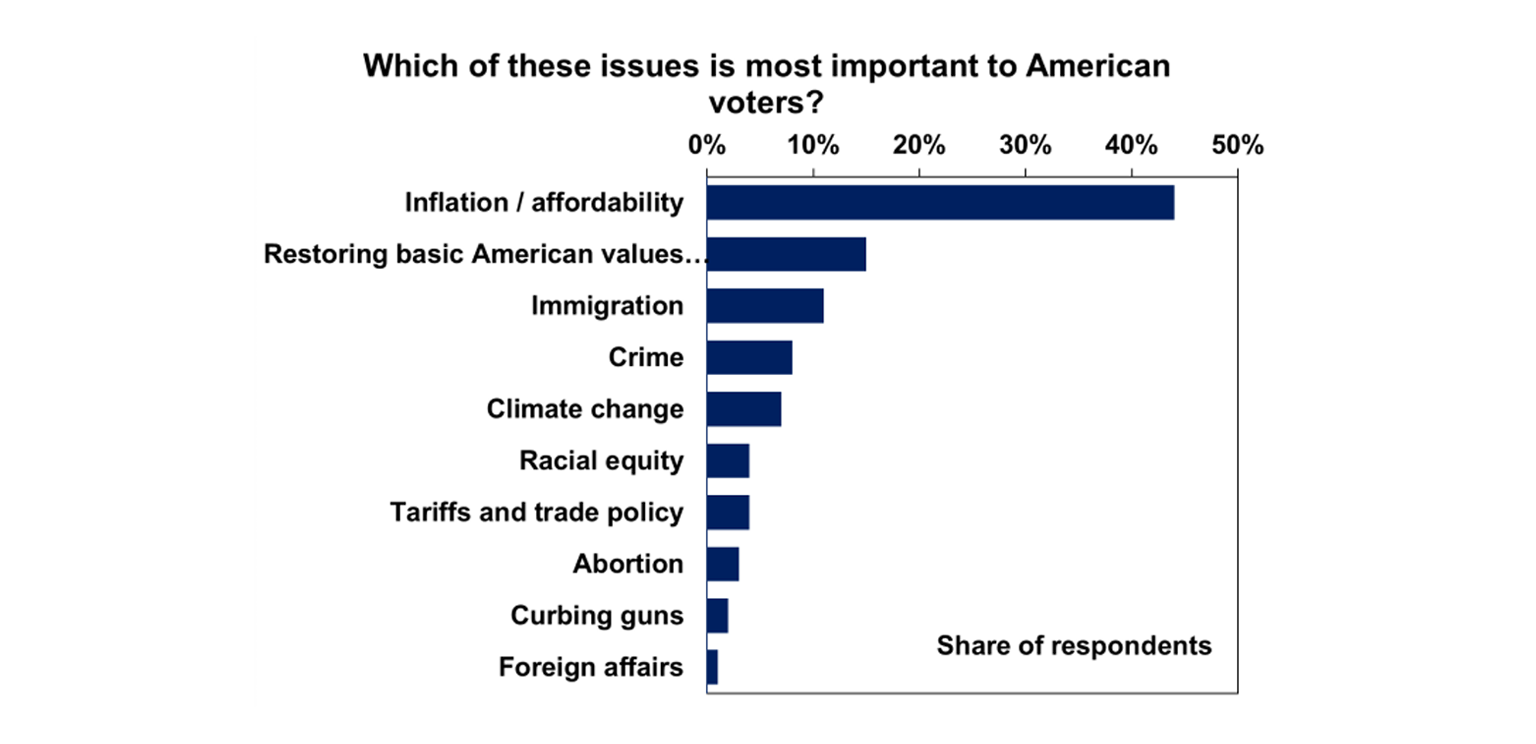
The biggest issue for voters is affordability (see the chart below) and higher gas prices for consumers will are another hit for affordability.
Iran is constrained by a weakening regime and pressure from China to reopen the Strait of Hormuz, which China relies on for oil and other commodity supplies. Iran, in turn, heavily relies on China for bilaterial trade.
Israel is constrained by need the US for military equipment and support for its war in Gaza, so needs to keep Trump onside. So, it is in everyone’s interests for this conflict to be short. However, that’s not how wars often work as negotiations break down or there is a miscalculation. So it could still get worse from here (although this is not our base case).
So, it is in everyone’s interests for this conflict to be short. However, that’s not how wars often work as negotiations break down or there is a miscalculation. So it could still get worse from here (although this is not our base case).
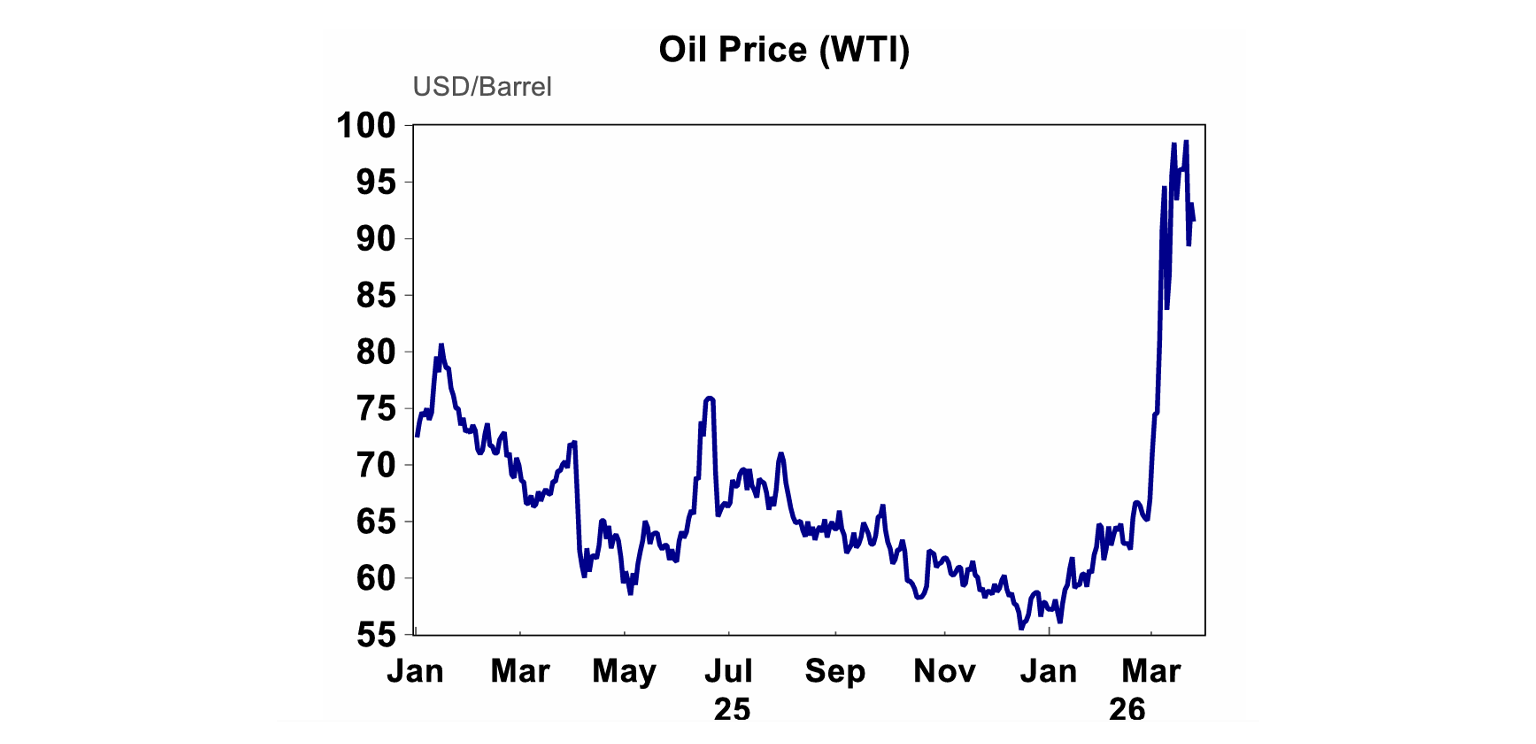
The West Texas Intermediate oil price is hovering between $90-$100/barrel in recent weeks (see the chart below), around a doubling from January levels. Whilst this is a huge spike, it would be more troubling for global growth if prices were over $125/barrel. The Brent oil price is higher, currently at $113/barrel.
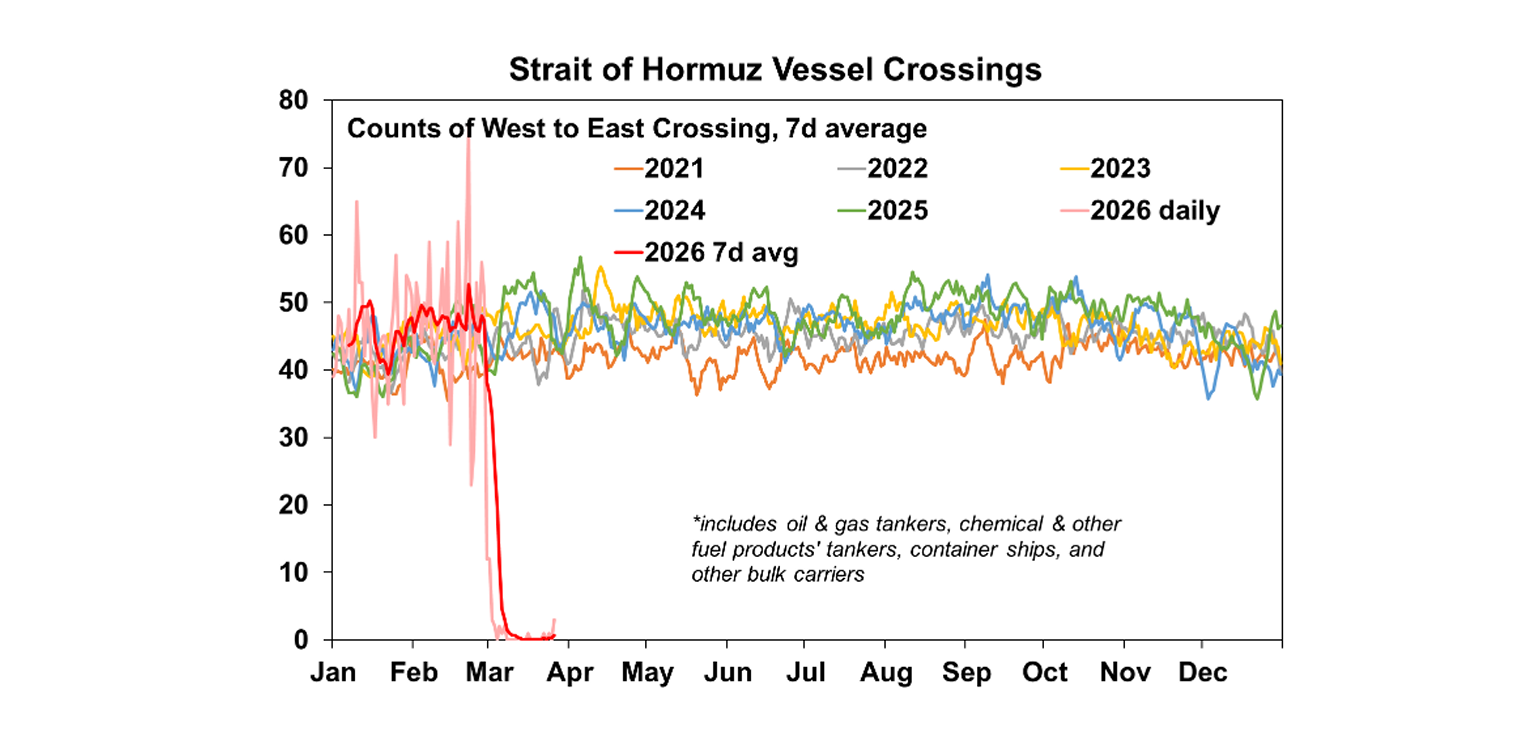
The key for global growth is to watch passageway through the Strait of Hormuz. There has been news that “Iran friendlies” vessels carrying LPG may be able to pass. Vessels crossings data shows basically zero vessels passing through the Strait. The hit to oil supply isn’t quite as large as the ~20% that usually passes the Strait and this is because there are offsets from the release of oil from strategic petroleum reserves, pipeline bypass channels and de-sanctioned Russian/Iranian oil. So this leaves around a 5% supply hit for oil. This is still a very large hit to supply.
Of course the longer this goes on, oil reserves will dwindle and shortages will become more of a problem and the oil price will spike higher. While this is possible if negotiations break down over coming weeks, our base case is that the conflict is resolved by around mid-April. This should hopefully see the flow of oil resume, but it may take a while to get back to pre-war prices (when there was technically an oversupply of oil) and in the interim, the damage has already been done through higher prices and increasing inflation expectations. Trump and Xi’s meeting was also changed to May 14-15th after being delayed due to the war, so this could be a sign that Trump wants the war to end by then!?
Higher oil prices will be passed through the supply chain as crude oil has many uses after it is refined (gasoline, diesel, jet fuel, LPG, everyday plastics, chemicals, fertiliser, pesticides and asphalt). So the impact to inflation is high from the first-round impacts which we can start to see at the petrol stations but more will become evident from second-order impacts and the longer that oil supply is constrained, the longer that inflation will remain high.
Are we about to get a “fuel surcharge” added to some good and services bills in Australia? This has been the chatter this week as businesses are starting to factor in higher petrol costs. According to Energy and Climate Change Minister Chris Bowen around 8% of total petrol stations in Australia are out of some kind of fuel. While there has been no announcement around fuel rationing or a broad-based lockdown announcement, this is a possibility if things don’t improve in coming weeks as oil supplies decline. For now it looks like Australia is negotiating with Asian countries to continue shipping crude oil to Australia in exchange for our commodities like LNG. Although, Cyclone Narelle across Australia’s WA’s north-west resulted in 3 shut LNG plants which provide about 8% of global supply which is another factor that will boost gas prices after Qatar LNG facilities were hit by Iran.
After all the talk in recent weeks about whether the government was adding to inflation or not, news that the government asked the Fair Work Commission to give minimum and award wage workers above-inflation pay rises this year is another blow to the RBA because if enacted and productivity stays sluggish it means higher inflation. The better decision would have been an increase to wages at current inflation rates or the same as last year (at 3.5% which is actually still high relative to wage history). Of course no one wants to see their real wages go down but high minimum wage increases in recent years have been part of the current inflation problem because it influences broader wage demands and inflation expectations and will just mean higher RBA interest rates down the track.
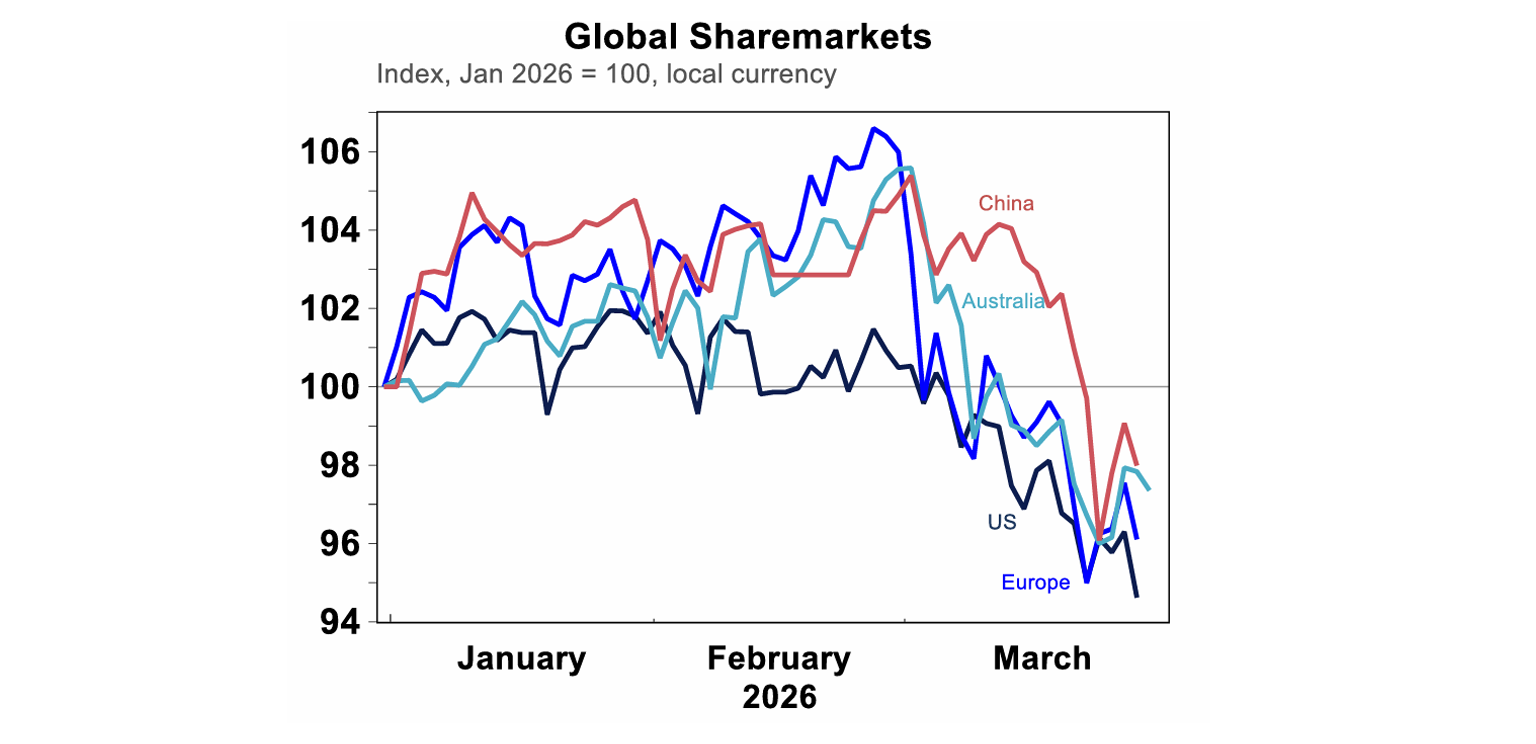
Sharemarkets this week bounced around a bit based on rhetoric surrounding the war. US shares fell by 2.1% (and is down ~9% from its pre-War level) which is a moderate drop given the level of the oil supply disruption. Australian shares are managed a 1% lift this week, with a rise in materials, utilities, consumer discretionary and industrials but a fall in tech and financials. Australian shares are down by around 8% from their highs. After noticeable outperformance earlier in the year, European shares have been hit harder due to likely higher gas prices, because of the reliance on imports.
Prior to the war, the fundamentals looked relatively sound for earnings and economic growth across major markets. Higher inflation in the short-term, risk of delayed rate cuts (or hikes in some cases) means it’s hard to see a significant turn around in share prices until there is some resolution to the supply of oil – so watch what happens to the Strait of Hormuz.
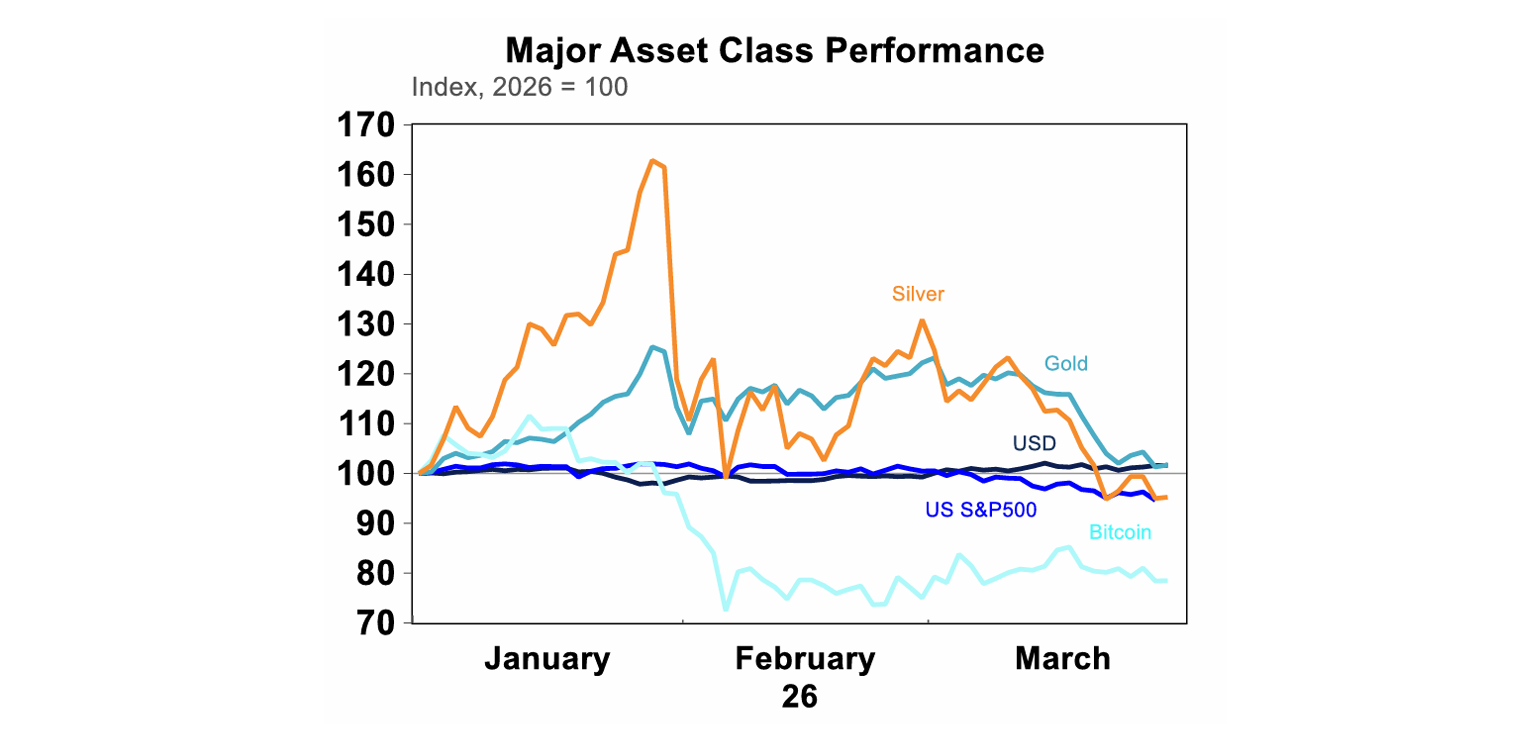
There has been some rotation in performance across asset classes in recent weeks. The $A has weakened below 0.69 US dollars, because of the strength in the $US through this period of uncertainty. Gold has given up its gain for this year although is still up ~45% compared to a year ago. Bitcoin has continued to falter in 2026.
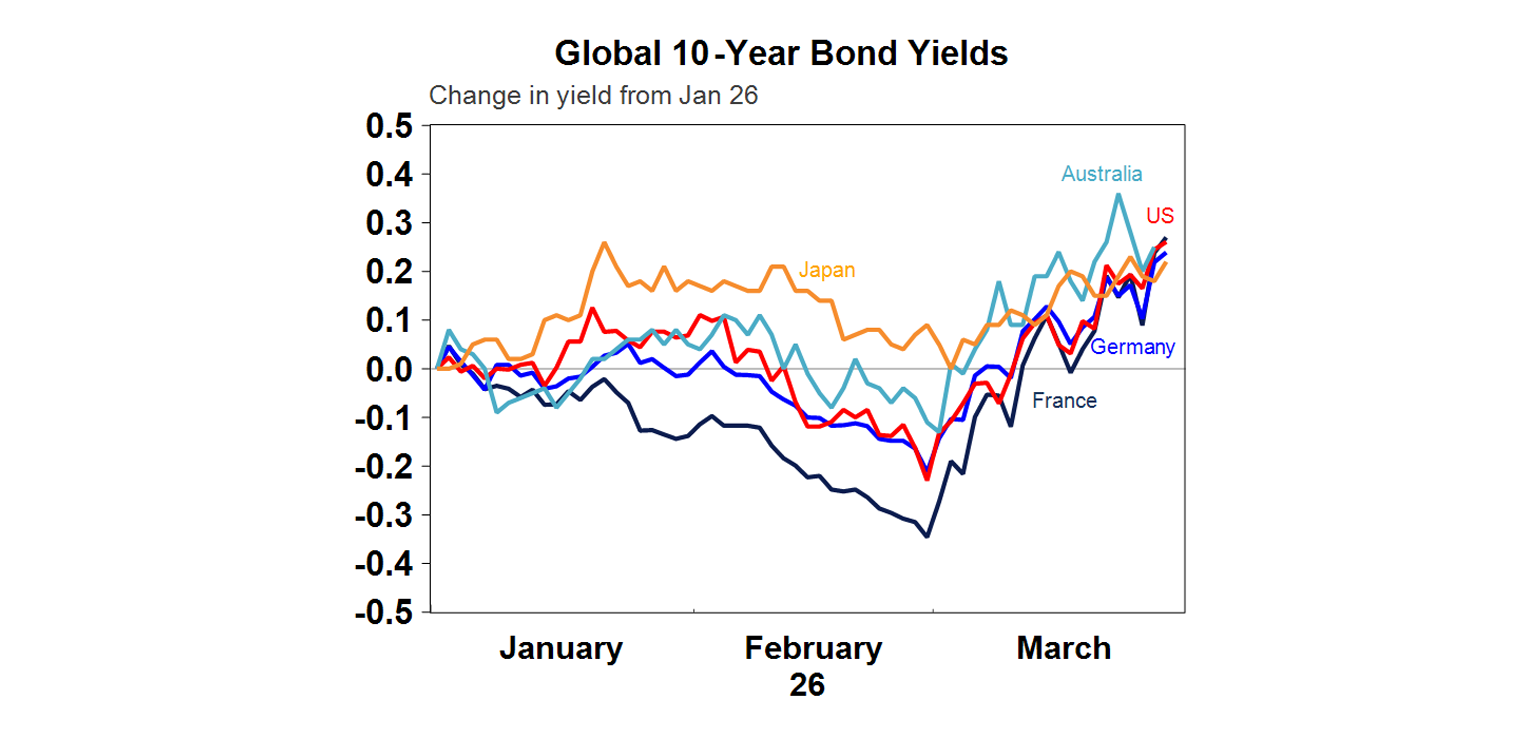
Global bond yields have been rising since the outbreak of the Middle East conflict from the expectation of higher inflation due to the energy price shock.US 10 yr yields are up to 4.4%.
Major global economic events and implications
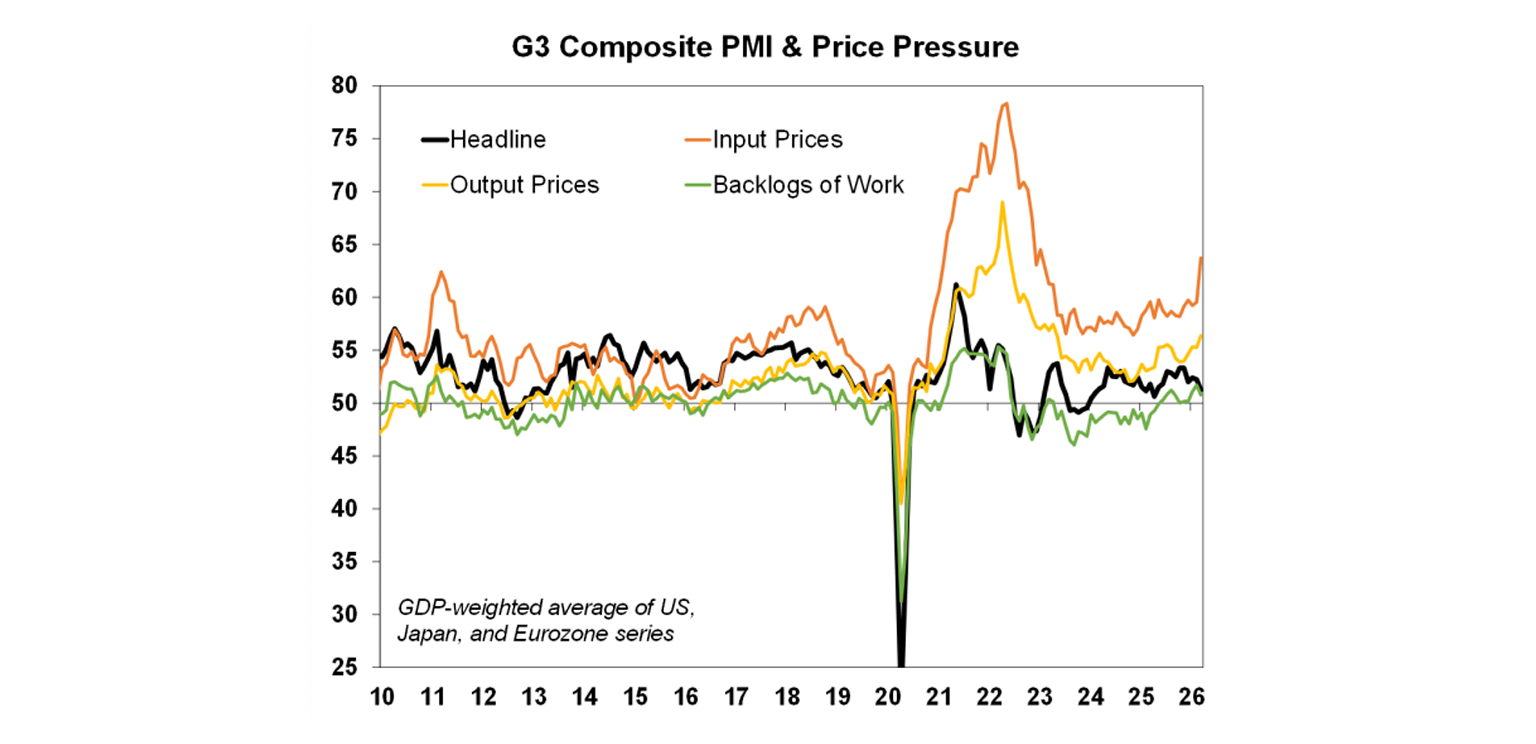
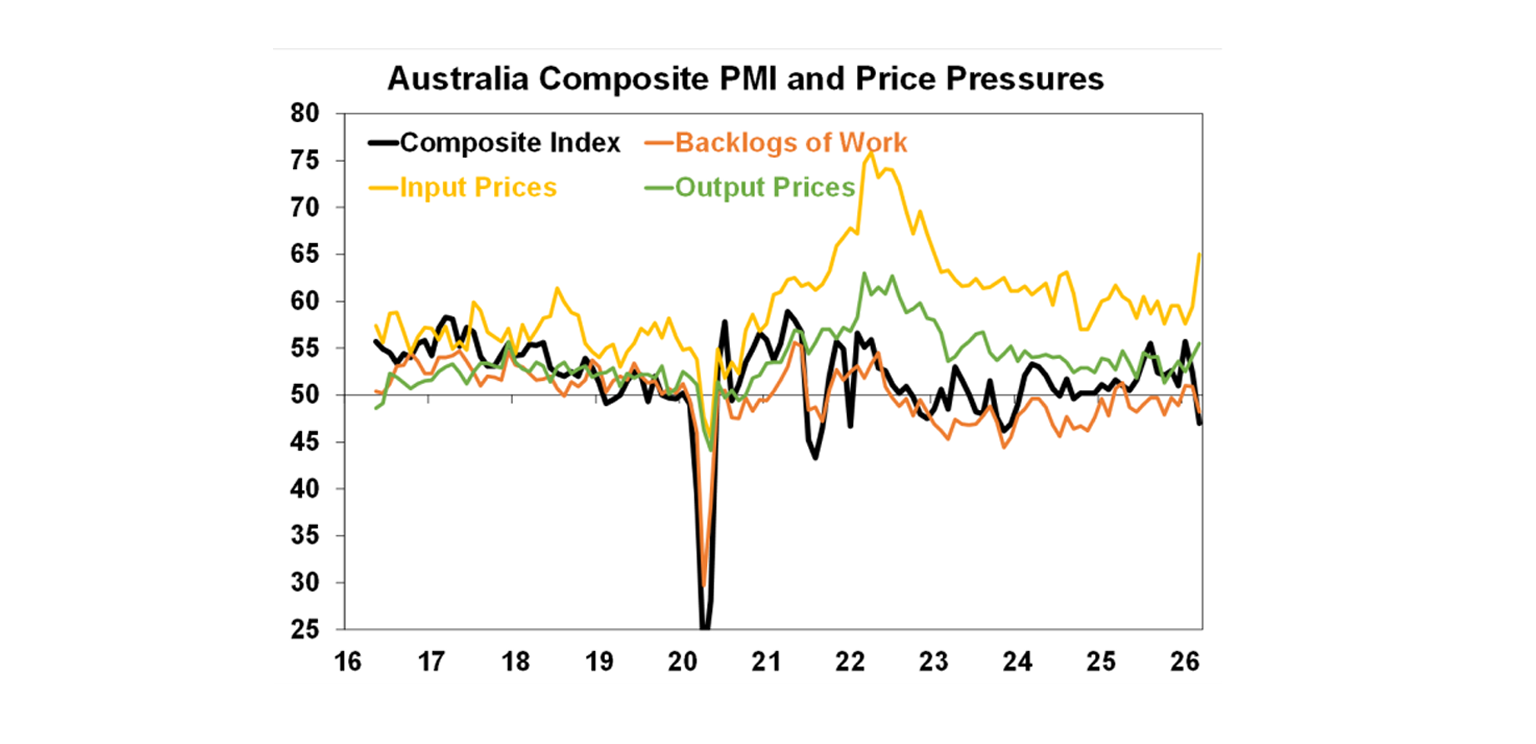
Global PMI’s for March showed the first impact of the Middle East conflict. Input prices rose more than output prices. But work backlogs are still holding up and are not even close to the Covid shock (although I guess it’s still early days!).
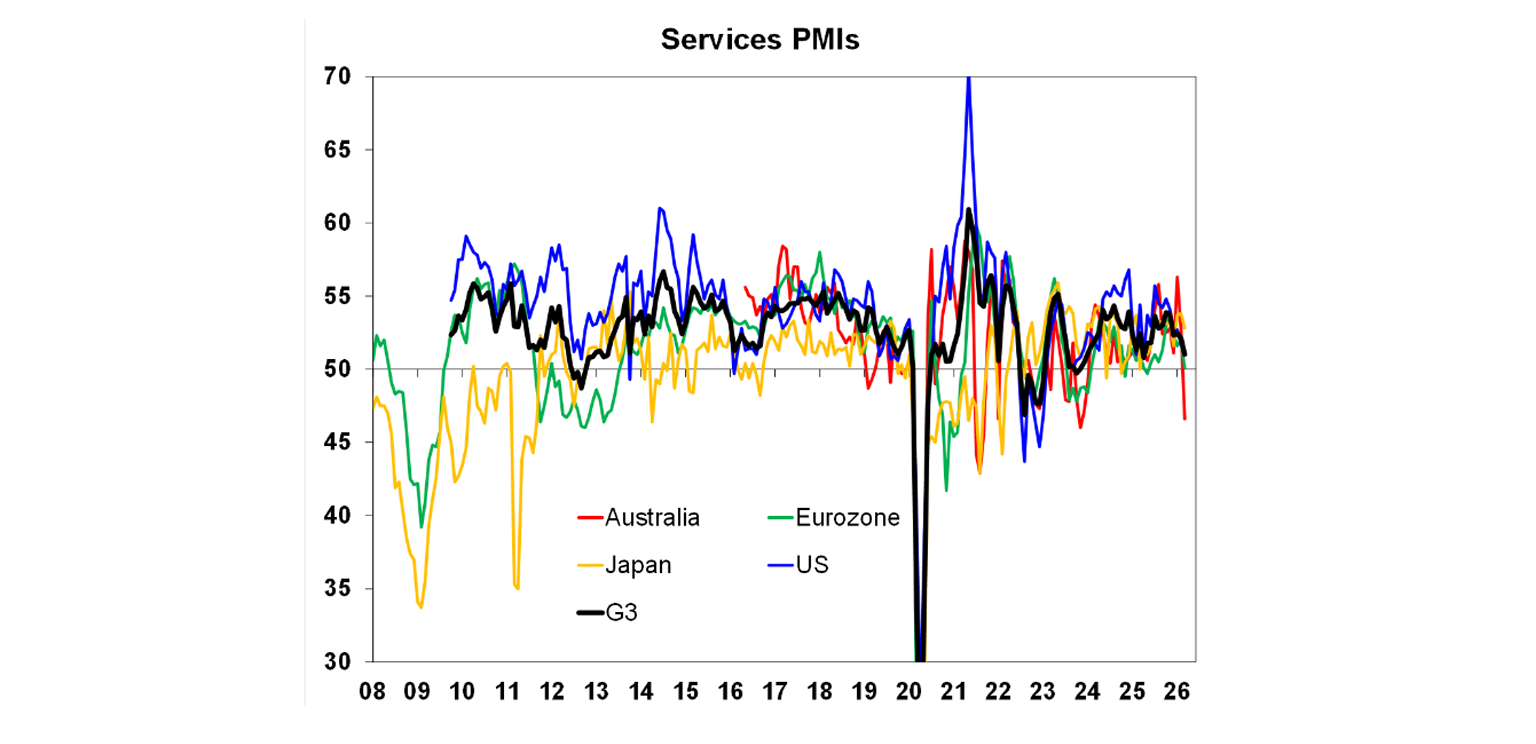
Across the major countries, Australia’s services PMI was the worst hit from the double whammy of higher interest rates and oil prices.
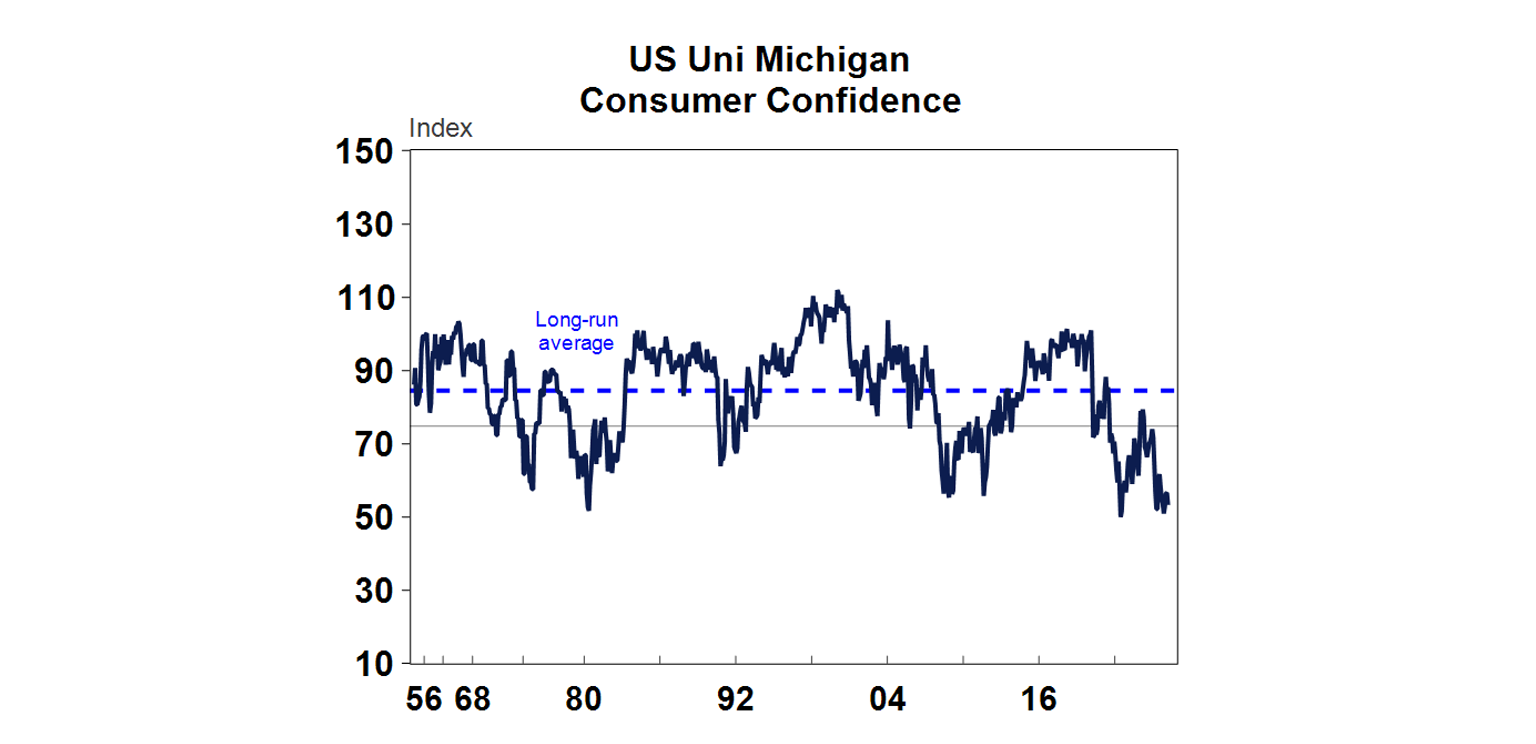
The final reading of the University of Michigan consumer confidence survey showed around a record low (see chart below).
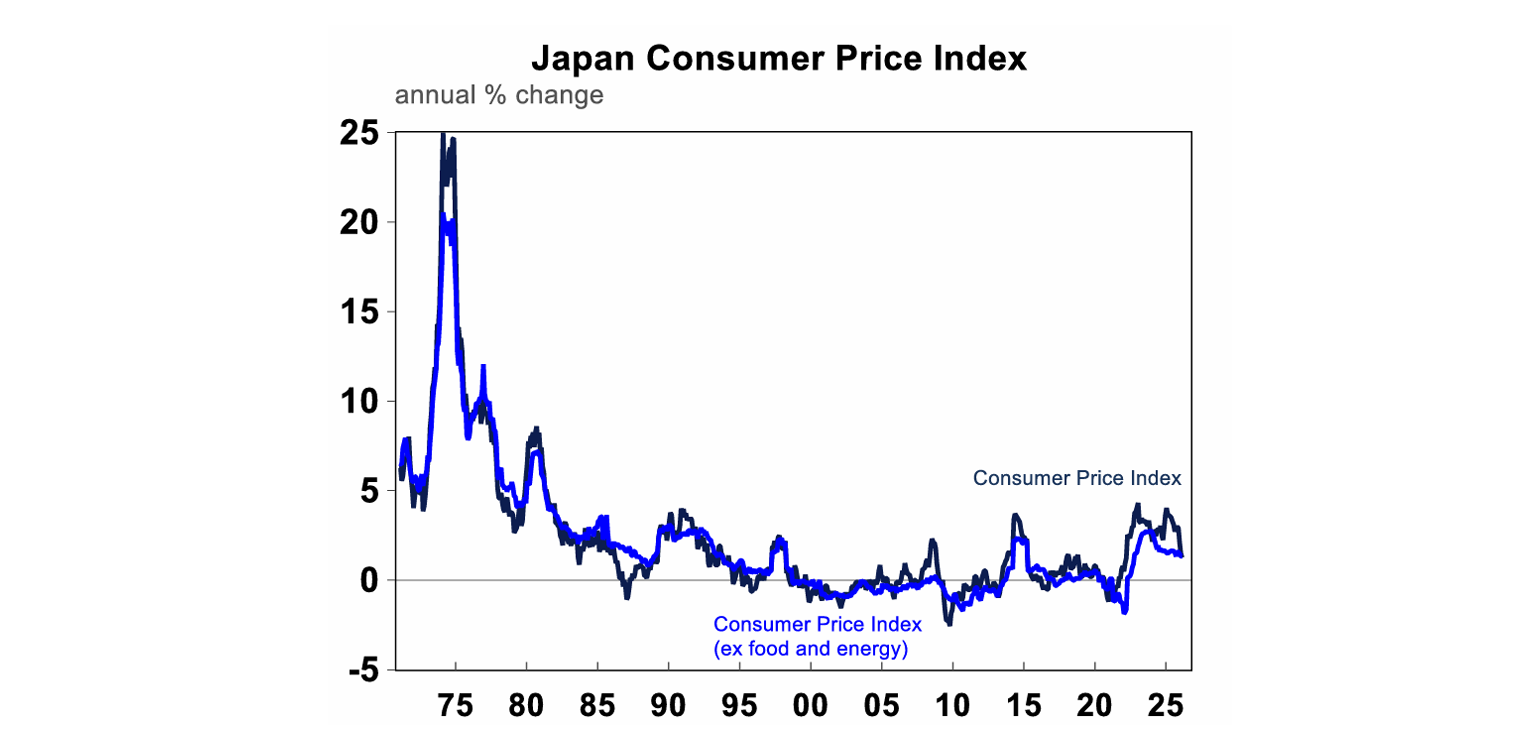
Japan’s February CPI is running at moderate levels, headline CPI was up by 1.3% over the year to February and core rose by 1.4% which still argues for higher interest rates.
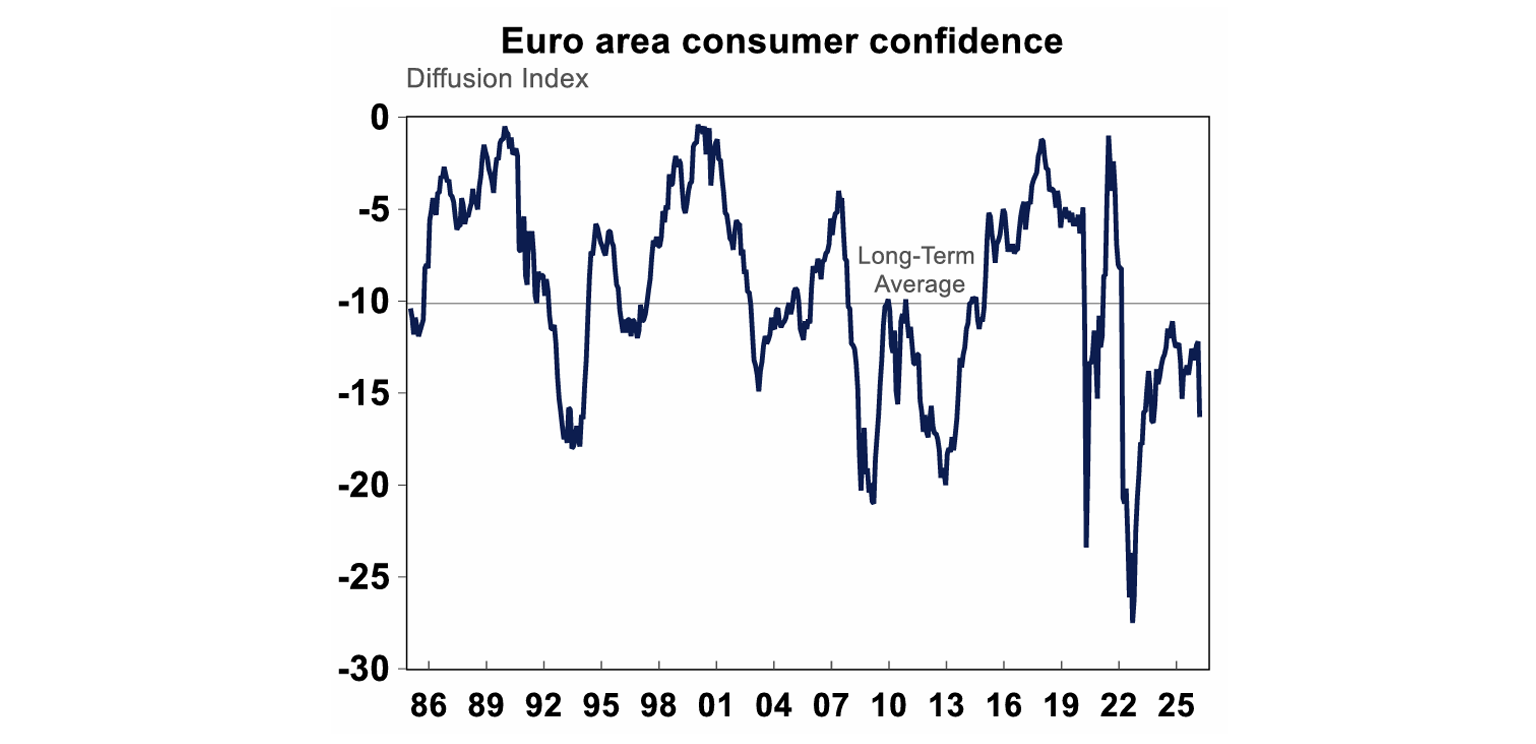
Eurozone consumer confidence took a hit in March, according to the European Commission flash confidence survey (see the chart below), as the war in the Middle East has seen a surge in European energy prices, due to its reliance on imported energy.
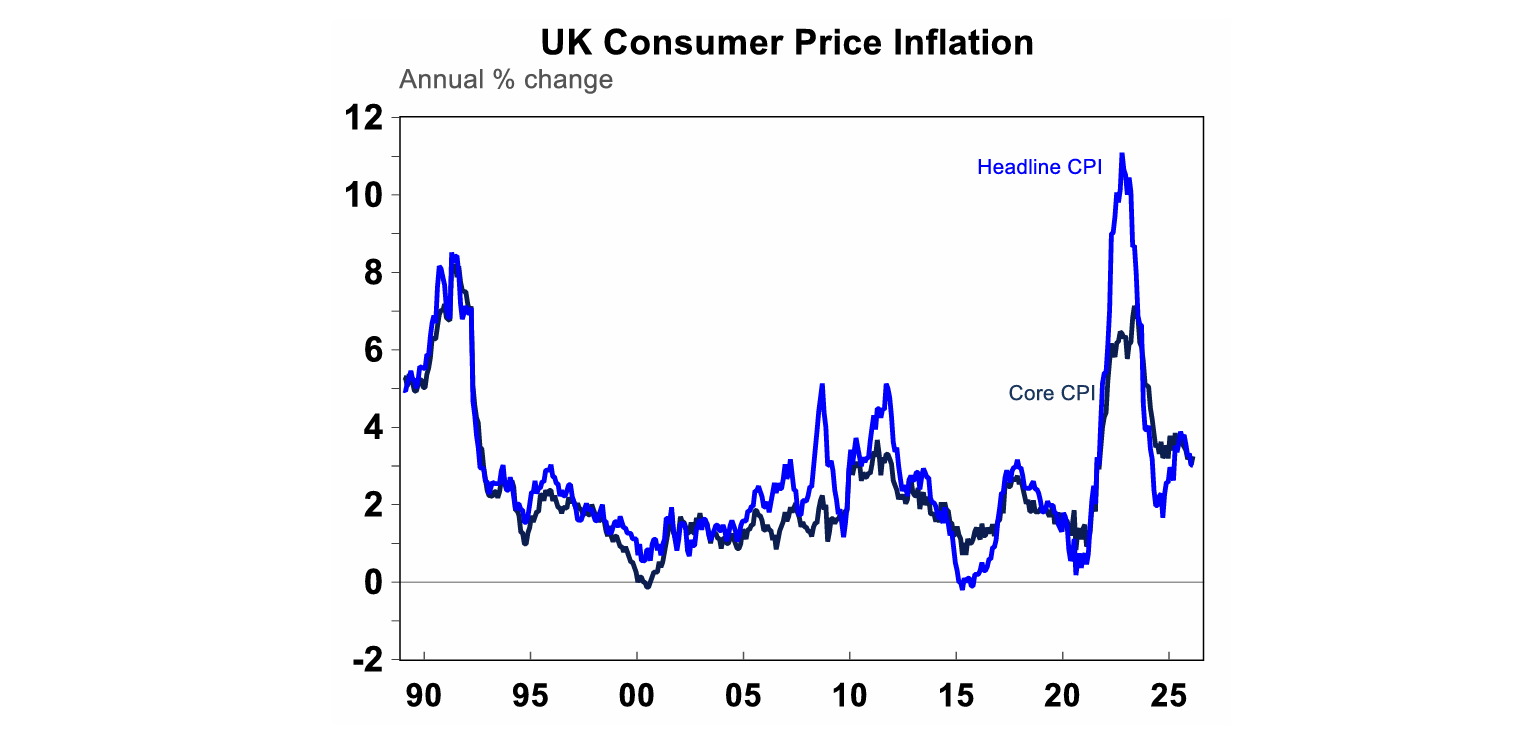
UK CPI was elevated. Headline inflation was 3.0% over the year to February and core was 3.2% - slightly above last month. Services inflation is still a problem in the UK.
Australian economic events and implications
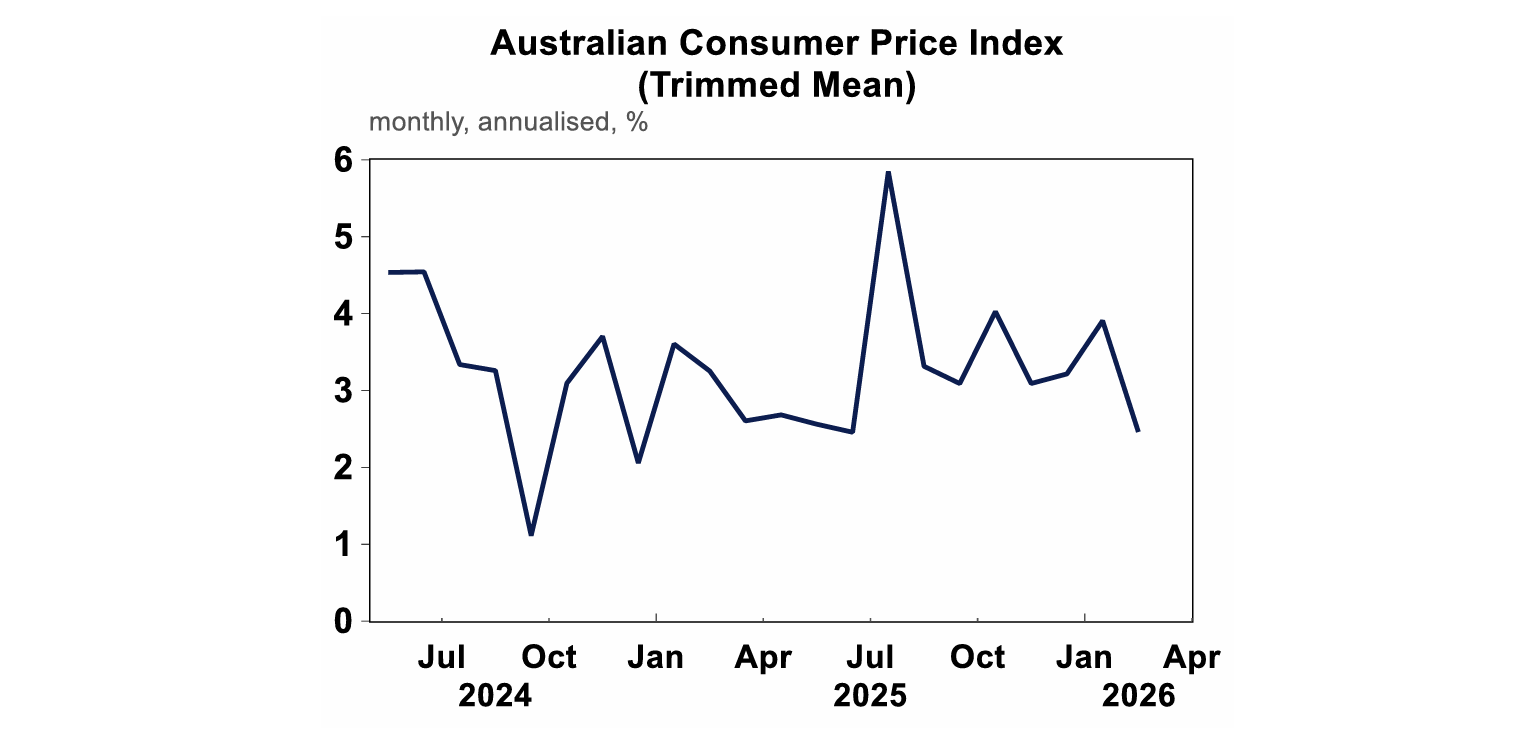
This week’s Australia February inflation data showed that there was a stabilisation in prices prior to the breakout of the war. Headline inflation fell from 3.8% to 3.7% over the year to February and the trimmed mean was up by 3.3% over the year but on a monthly annualised time basis fell to 2.5% - smack bang in the middle of the target band and has been trending down since its July high (see the chart below).
But does this data really matter given that we know March will look totally different due to the impact of higher petrol prices? The ~45% lift in petrol prices means that petrol itself will add around 1.2ppt to March quarter inflation (assuming prices stay around current levels of $2.45/litre for the rest of the month). We expect March inflation will be 4.3% over the year and trimmed mean to be 3.6% over the year. And further ahead, second-round impacts of higher oil prices will seep into other parts of the consumption basket so even if the conflict ends soon prices may still be higher for another 6 months as oil supply takes some time to come back online.
The March PMI was weak, falling to a contractionary read of 47, from 52.4 last month. Unsurprisingly, input prices went up significantly, output prices rose (although not as much) and work backlogs fell. The services reading was worse, declining to 46.6 (from 52.8 last month). This is likely to be a temporary decline as a response to higher interest rates and the increase in oil prices, unless the crisis persists for too long. But it’s also a sign that there are double-whammy impacts from higher oil prices – inflation goes up but growth may slow.
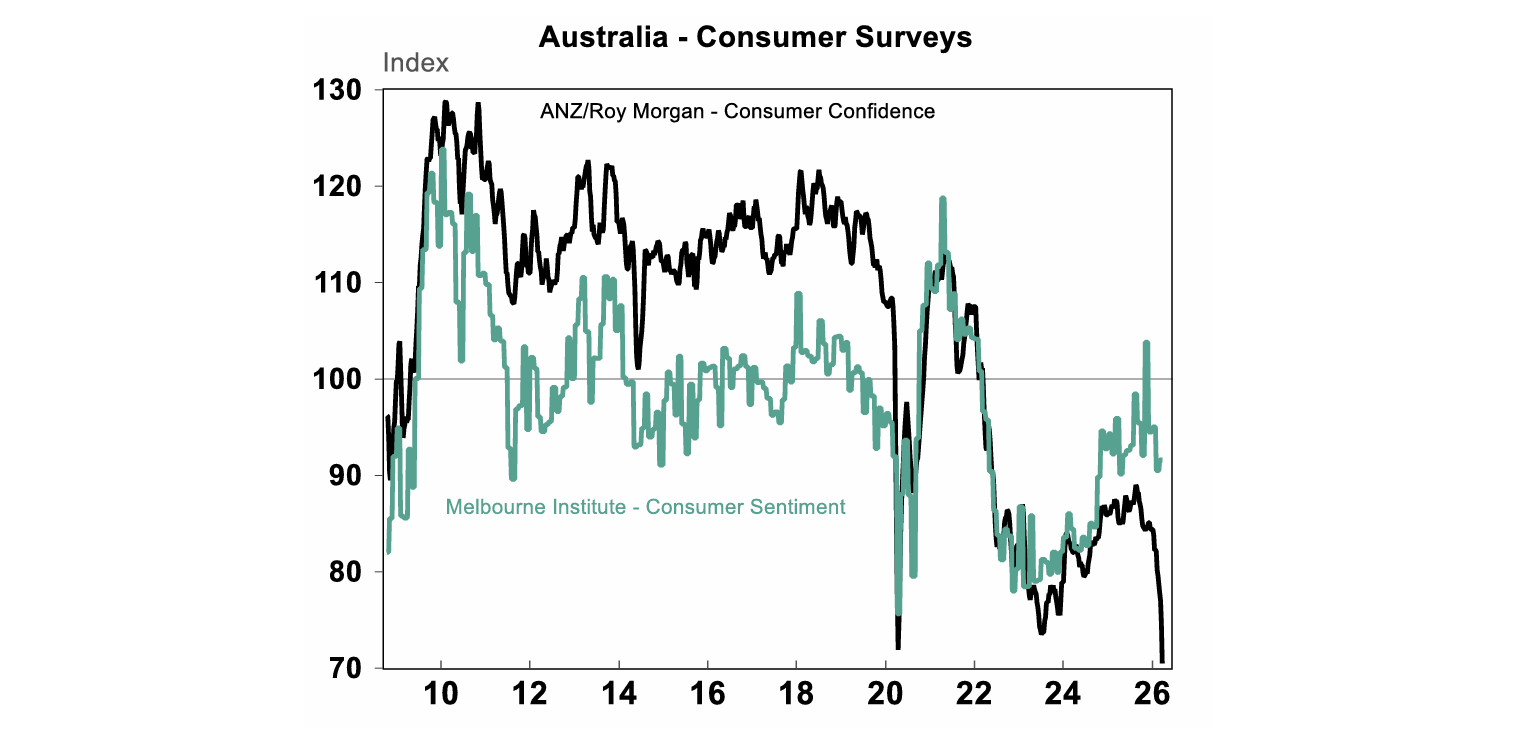
No surprise that the ANZ-Roy Morgan weekly measure of consumer confidence fell to a record low this week (see the chart below), given the hit to consumers from 2 back-to-back rate hikes and the petrol price increases.
RBA Assistant Governor Chris Kent spoke on “Reassessing Australian Financial Conditions” where he noted that financial conditions (which are a broad measure of how easy or hard it is for consumers and businesses to borrow, spend and invest) became slightly accommodative in the second half of last year, which helped to lift economic growth which in turn led to higher inflation and recent RBA rate increases. More recently, financial conditions have tightened again due to the moves in markets from the Middle East conflict but are broadly around neutral. Kent’s analysis also indicated that RBA estimate of the “neutral interest rate” is around 3.5% based on multiple estimates of the neutral rate which means the current level of the cash rate (at 4.1%) is slightly restrictive. The issue with both financial conditions and the neutral rate is that in hindsight they make sense, but don’t tend to be leading indicators that can be used to make better policy decisions. Kent also mentioned that central banks cannot change the negative supply shock but they can ensure the price rise does not lead to higher inflation expectations which sounds hawkish.
What to watch over the next week?
The war in Iran will continue to dominate the news.
In Australia, there will be the RBA March minutes which may show more of the views around 4 dissenters to the March rate hike. February credit, growth expected to be solid (up 0.6%), February building approvals are likely to show a small decline over the month, February trade balance is expected to moderate to $2.1bn and February job vacancies should show a slow improvement.
US data next week includes the Conference Borad consumer sentiment figures (likely to be down), February job openings and quits figures, the March manufacturing and services ISM and the March payrolls which should show a small lift after the unexpected fall last month.
Japan has figures on unemployment. Europe has March inflation figures and the unemployment rate and China’s PMI’s are out.
Outlook for investment markets
Global and Australian share markets are at high risk of further falls in the near term in response to the War with Iran against the backdrop of stretched valuations, political uncertainty associated with Trump & the midterm elections, increasing worries about private credit and AI & tech valuation worries. We continue to see a 15% or so top to bottom fall in share markets along the way this year, but the risk is that it could go deeper the longer the Strait of Hormuz remains effectively closed. However, returns should still be positive for the year as a whole thanks to Fed rate cuts likely later in the year, Trump still likely to pivot to consumer friendly policies ahead of the midterms and solid profit growth.
Bonds are likely to provide returns around running yield.
Unlisted commercial property returns are likely to be solid helped by strong demand for industrial property associated with data centres.
Australian home price growth is likely to slow to 5% or less due to poor affordability and the RBA raising rates with talk of more to come.
Cash and bank deposits are expected to provide returns around 4.25%.
The $A is likely to rise as the interest rate differential in favour of Australia widens as the Fed cuts and the RBA hikes. Fair value for the $A is around $US0.72.
You may also like
-

Weekly market update - 24-07-2026 Renewed global worries weighed on the Australian share market which fell around 0.3%, but with its lower exposure to tech shares providing some protection. -

Oliver's insights Charts to watch 21 July 2026 Share markets had a strong first half despite the oil supply shock as expectations for de-escalation, okay economic data, strong profits and the AI boom provided an offset. -

Weekly market update - 17-07-2026 Following the renewed escalation in the US/Iran conflict, the Strait of Hormuz is effectively closed again with Iran attacking ships and the US attacking Iran and blockading its ports. Both are now back to attacking energy infrastructure which is a signficant & concerning escalation.
Important information
While every care has been taken in the preparation of this document, neither National Mutual Funds Management Ltd (ABN 32 006 787 720, AFSL 234652) (NMFM), AMP Limited ABN 49 079 354 519 nor any other member of the AMP Group (AMP) makes any representations or warranties as to the accuracy or completeness of any statement in it including, without limitation, any forecasts. Past performance is not a reliable indicator of future performance.
This document has been prepared for the purpose of providing general information, without taking account of any particular investor’s objectives, financial situation or needs. An investor should, before making any investment decisions, consider the appropriateness of the information in this document, and seek professional advice, having regard to the investor’s objectives, financial situation and needs. This document is solely for the use of the party to whom it is provided.
This document is not intended for distribution or use in any jurisdiction where it would be contrary to applicable laws, regulations or directives and does not constitute a recommendation, offer, solicitation or invitation to invest.