


Weekly market update
Investment markets and key developments
Global share markets had a volatile ride over the last week with some sharp falls amidst increasing worries about tech valuations and overinvestment in AI, some weak US jobs data & ongoing fears of a US strike on Iran, but then a rebound in US and Eurozone shares on Friday as dip buying kicked in.
6 min read

Global share markets had a volatile ride over the last week with some sharp falls amidst increasing worries about tech valuations and overinvestment in AI, some weak US jobs data & ongoing fears of a US strike on Iran, but then a rebound in US and Eurozone shares on Friday as dip buying kicked in. This left US shares down 0.1% for the week but with a wide divergence between the Nasdaq which fell 1.8% and the Dow Jones index which rose 2.5% as a rotation away from tech continues. Eurozone shares rose 0.9% for the week and Japanese shares rose 1.8% but Chinese shares fell 1.3%. Australian shares were dragged down by 1.8% for the week by the falls in US shares up until Thursday not helped by a hawkish rate hike from the RBA, with falls led by IT, resources, utilities and telcos. Bond yields fell in the US and Japan, were flat in Australia and rose in Europe.
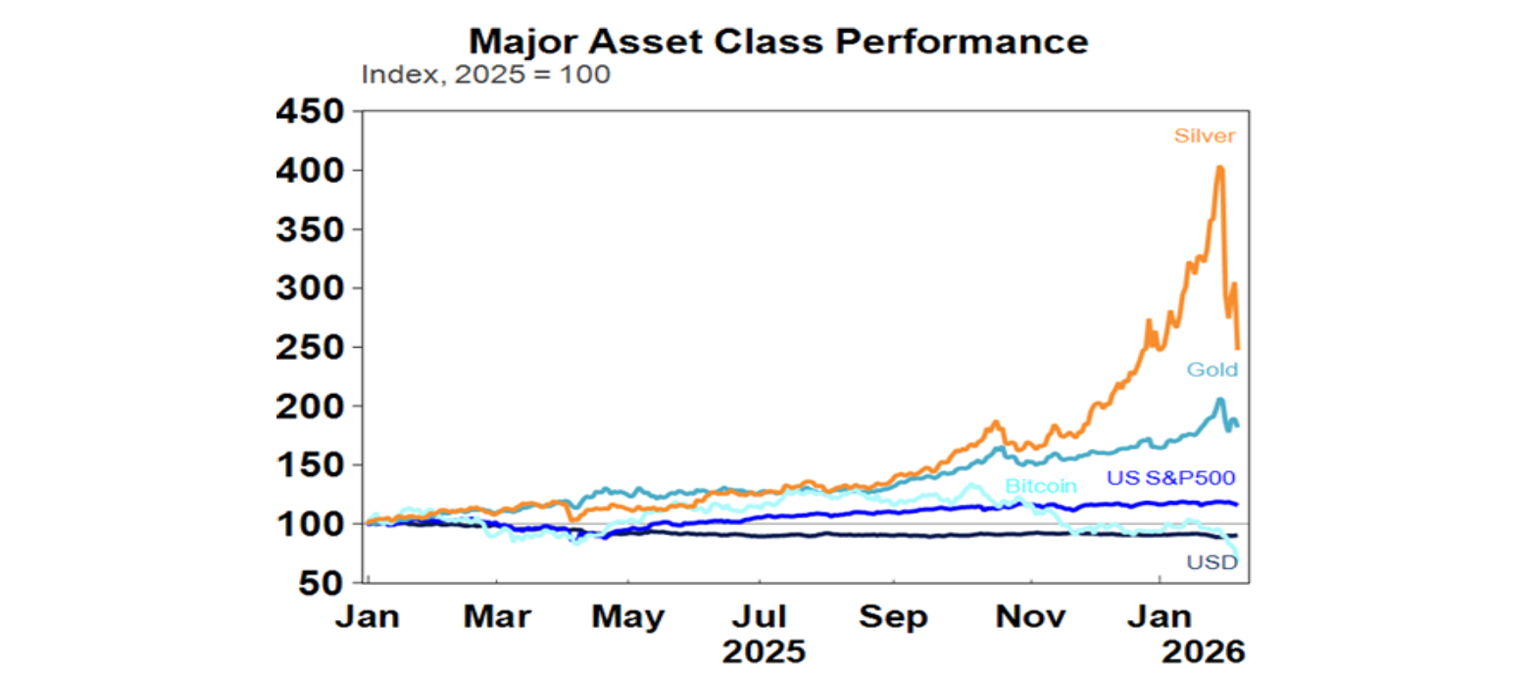
Gold ended the week flat, but silver fell further. It spiked more than gold recently so was more vulnerable as fallout from the nomination of a less dovish candidate for Fed Chair (ie Kevin Warsh) continued. Ongoing erratic policy making in the US and the high levels of geopolitical risk remain supportive for precious metal demand so this still looks corrective (after prices ran up too far too fast) – at least for gold. Bitcoin plunged though not helped by the falls in shares and has had around a 50% top to bottom fall since its high last October. See below for more on bitcoin. Oil prices fell back a bit on news of US/Iran talks but are still up on December lows. Metal and iron ore prices fell with share markets. The $A rose back above $US0.70 despite a rise in the week for the $US.
A hawkish hike from the RBA with higher for longer inflation. While we thought the RBA would leave rates on hold, we also thought it would be a very close call, so it was not surprising to see the RBA decide to hike. What was a bit surprising though was how hawkish the RBA’s messaging and revised forecasts were. It’s now seeing trimmed mean or underlying inflation of 3.2% this year which is up 0.5% on its November forecast and it doesn’t see it getting back to around the midpoint of the target range till June 2028, despite assuming the cash rate being 90 basis points higher and the $A being nearly 5% higher. Its forecasts imply trimmed mean inflation averaging 0.9%qoq in the first half of the year then falling to 0.7%qoq. This reflects a far more negative view on capacity constraints than previously. With inflation expected to stay above target for an unacceptably longer period of time, its effectively endorsing money market expectations for nearly two more rate hikes. Headlines of 6% union wage claims will only add to RBA hawkishness.
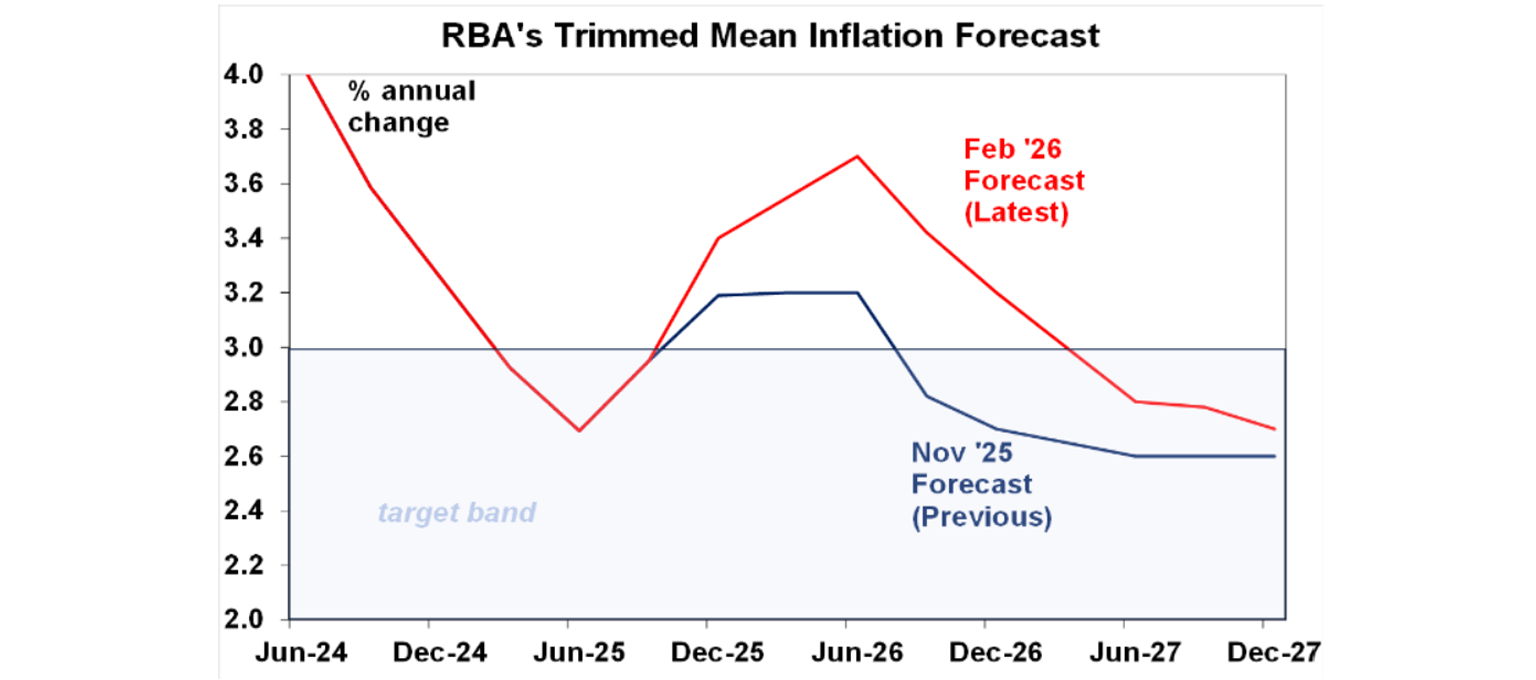
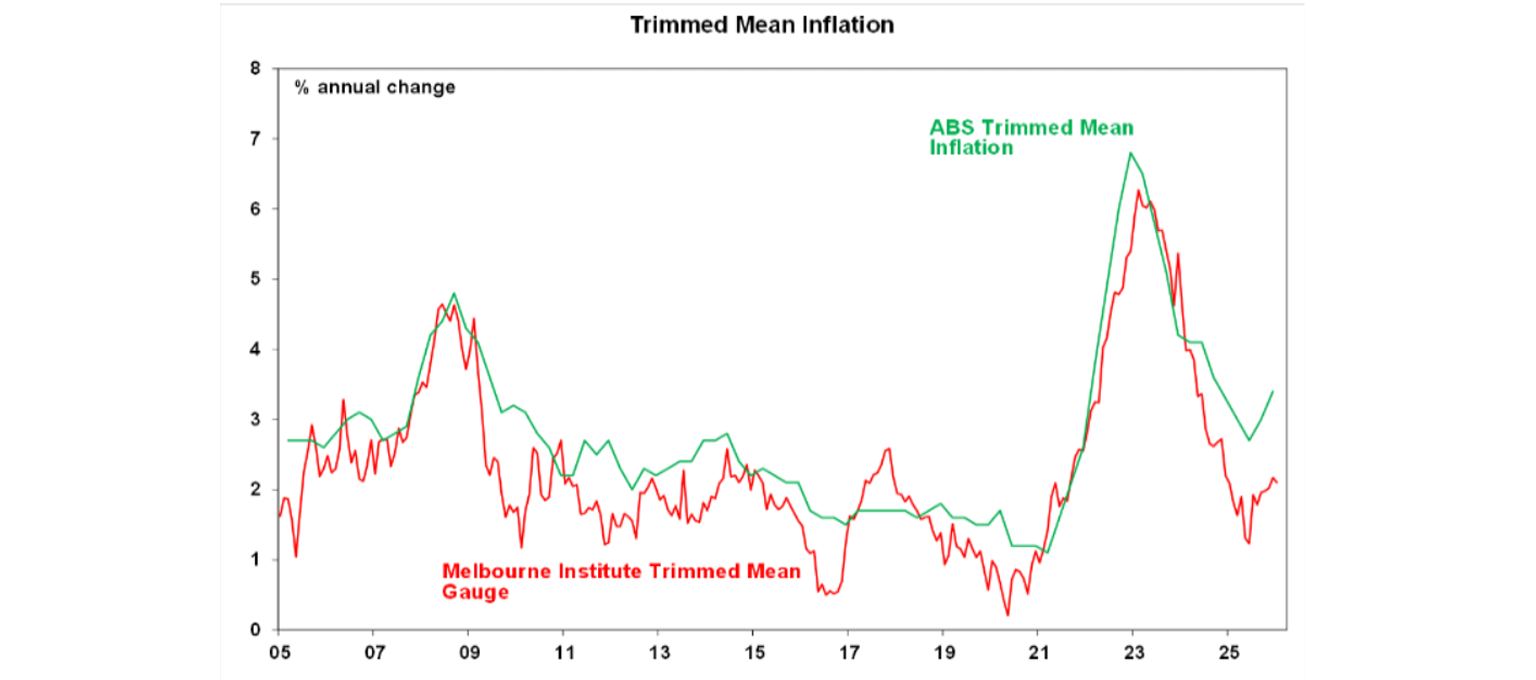
We are a bit more optimistic. The RBA’s inflation forecasts actually imply a reacceleration in inflation and reversal of the downtrend seen in the new monthly trimmed mean (see the next chart) which seems a bit too pessimistic, particularly with business survey output price readings running around levels consistent with the target. And the pickup in consumer spending is likely to take a hit as the rate hike and expectations for more to come will dent consumer confidence for those with a mortgage.
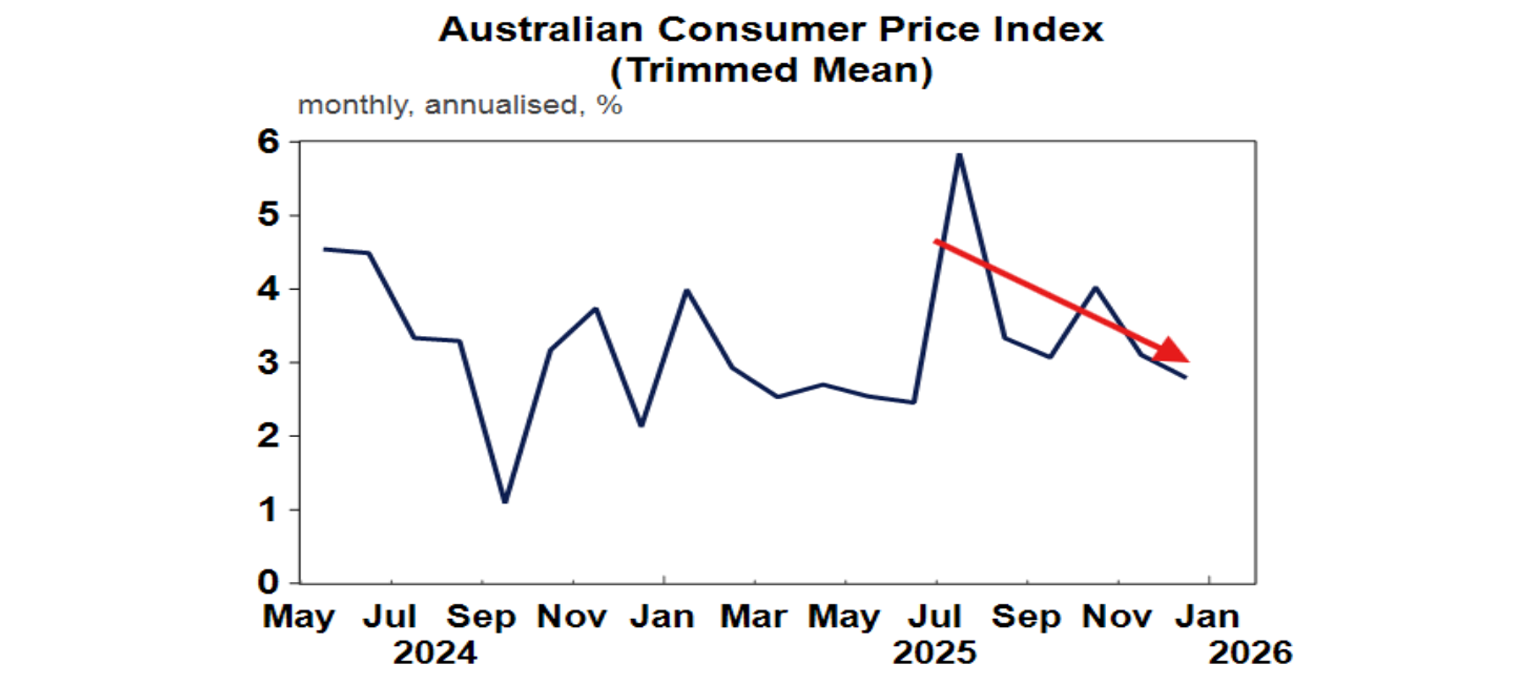
So, our base case is that the RBA will be able to leave rates on hold at 3.85%. That said, we don’t have a lot of confidence in this as the risks are skewed on the upside if domestic demand growth continues to strengthen adding to concerns about the economy bumping into capacity constraints and if inflation does not fall as we expect. The key to watch for what happens next year will be the inflation data. Another move in March seems unlikely given that the RBA has just moved but March quarter CPI data to be released in late April, ahead of the RBA’s May meeting will likely be key. If it shows a further cooling in trimmed mean inflation as we expect then the RBA will likely hold. Monthly CPI releases ahead of this will provide some guidance and will need to show a continuation of the downtrend seen in the previous chart.
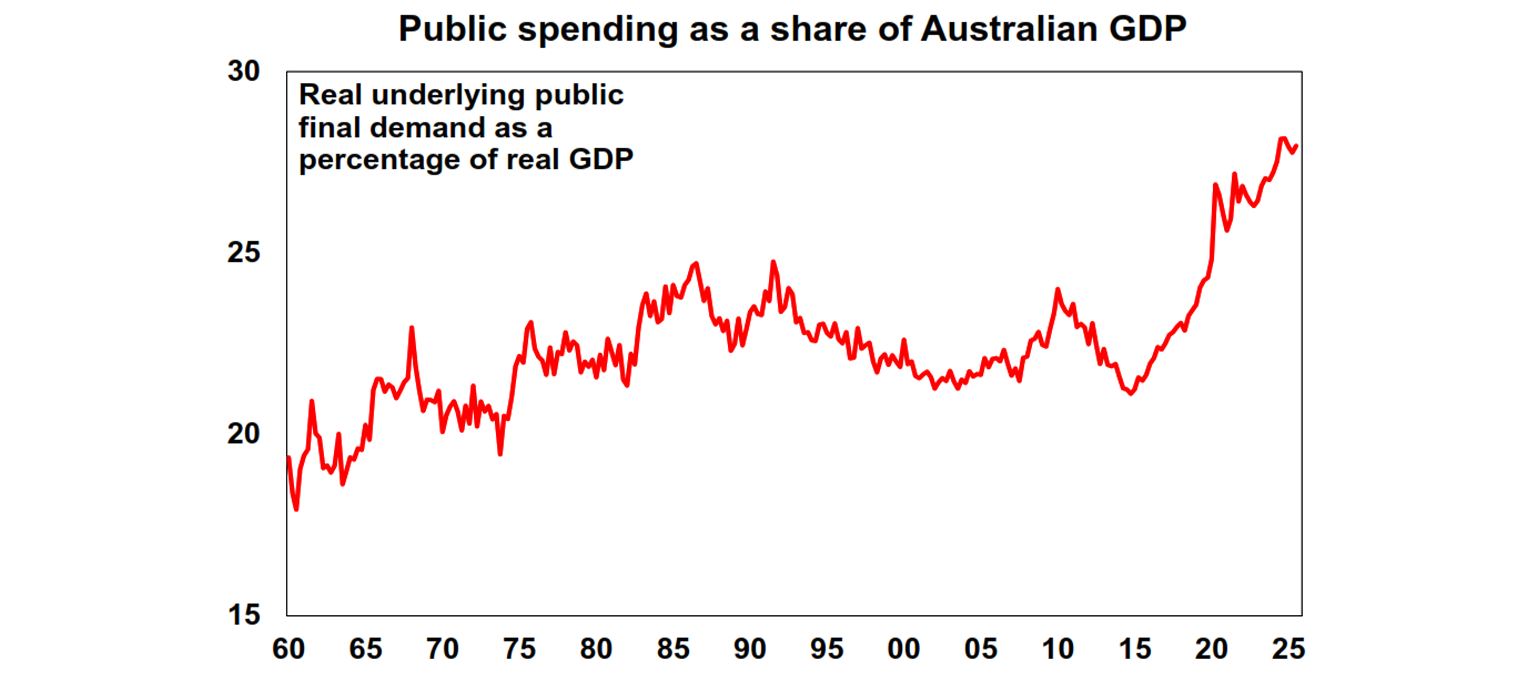
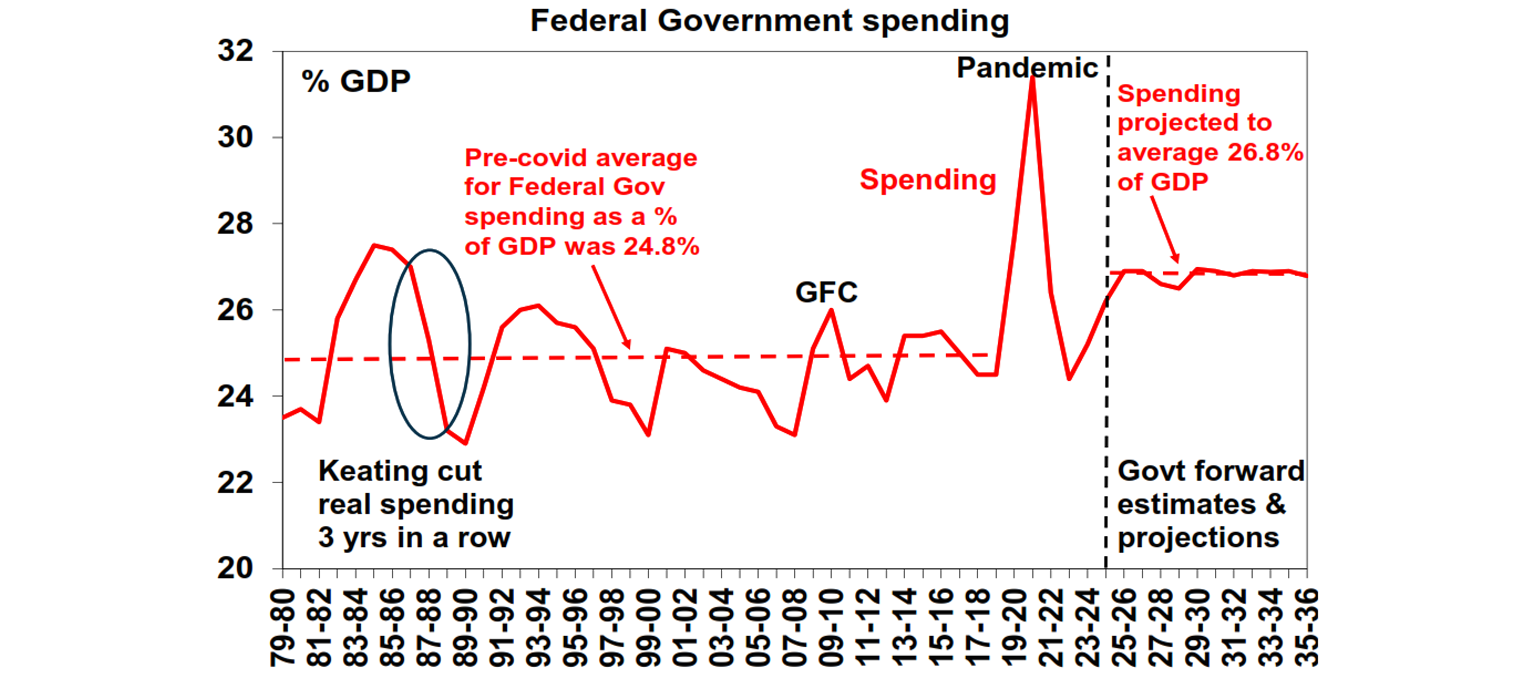
What role is government spending playing in the inflation problem? Of course, government spending cannot be directly blamed for higher holiday travel costs and the ending of state energy rebates boosting annual electricity price inflation. But it is playing a role in the rise in annual underlying inflation seen last year. This is because inflation reflects demand – which includes both private and public demand - for goods and services in the economy running ahead of the ability of the economy to meet that demand (ie supply) and this is resulting in “capacity pressures”. It's true that private demand (ie consumer spending and business investment) has picked up more than expected and growth in public demand as measured in the national accounts has slowed but the basic problem is that the level of public spending (or demand) in the economy is still running around a record (at least back to 1960) 28% of the economy. This high level of public spending has constrained the recovery in private spending that can occur without seeing the economy bump up against capacity constraints, which flows through to higher prices. So the best thing that Australian governments can do to in the near term to help bring down inflation would be to cut the level of government spending toward more normal levels which would free up space for private sector demand growth without higher inflation. Failure to do so risks higher for longer inflation and hence increased pressure on interest rates which leaves all the pressure on consumers to cut spending and home building and on businesses to cut investment. This is what economists call crowding out. From a longer-term perspective the key is to expand the supply capacity of the economy to better meet higher levels of demand and this means that the Government needs to implement productivity enhancing reforms like deregulation and tax reform. Of course, this is something that has been much discussed over the last year, with much hope flowing around the Economic Reform Roundtable last August. The upcoming May Budget will hopefully see action on this.
At the Federal level, spending is still rising rapidly, not falling. The next chart shows Federal Government spending (which of course includes transfers to the states) as a share of GDP. It shows that after big swings around the pandemic, spending as a share of GDP has risen from 24.3% in 2022-23 to a forecast 26.9% this financial year as a result of nominal spending growth of 7.2% in 2023-24, 8% in 2024-25 and 8.2% this financial year. Federal spending growth is forecast to slow in the next two years, but experience tells us this is likely to be revised up once we get there! Again this is seeing public spending settle at a much higher share of the economy than pre-covid which in turn is resulting in capacity pressures as the private sector has sought to spend more after being in the dog box.
Reports that the Federal Government is considering reducing the capital gains tax discount are good news as its way too generous and distortionary. But it needs to be part of an overall tax reform package which should not be about raising more revenue. And don’t expect it to solve the housing affordability crisis where the key issue is the ongoing housing shortage.
Is tech starting to eat itself? The past week saw another tech scare this time with concern that AI will automate a lot of software companies out of business following Anthropic’s Claude replicating legal software. It could just be another brief scare like that around DeepSeek a year ago – but disruption from AI will be huge and an outworking could be a dramatically shrunken tech sector. This is also occurring at a time when investors are concerned that big tech companies may be over investing in AI related data centres and so despite strong earnings results from companies like Microsoft, Alphabet and Amazon their shares fell on concerns about their big capex plans. At its core are worries that tech sector valuations are excessive. Of course, for non-tech it could turn out to be a bonanza in terms of savings and on this front its noteworthy that the equal weighted US S&P 500 index (+5.5% year to date) is way outperforming the market cap weighted index (+1.3% year to date) as investors rotate away from tech.
There has been much action around President Trump in the US as usual over the last week. In good news the partial Government shutdown ended after just a couple of days with funding out to September 30, except for Homeland Security and where funding will lapse after 13 February if Democrats aren’t satisfied that ICE will be curtailed! President Xi and Trump also had a positive phone call ahead of Trump’s April visit to Beijing suggesting that the US/China détente continues for now. Apart from worries about tech valuations, the main threat for investment markets remains Iran where the risk of a US strike remains high if talks in relation to US demands that it cease its nuclear ambitions and support for terrorist organisations fail. A strike on Iran could threaten Iranian oil supplies which are around 3.5% of global oil production. A disruption to this could be offset by spare capacity in Saudi Arabia and the UAE. But the threat to oil supplies could escalate if the Iranian regime concludes it has nothing to lose by disrupting neighbouring countries oil production or the Strait of Hormuz through which around 20% of the world’s oil supplies flows which could then drive a spike in oil prices threatening global growth. Trump likely has minimal tolerance for this though given it’s an election year – but whether it turns out to be another case of TACO or TUNA remains to be seen.
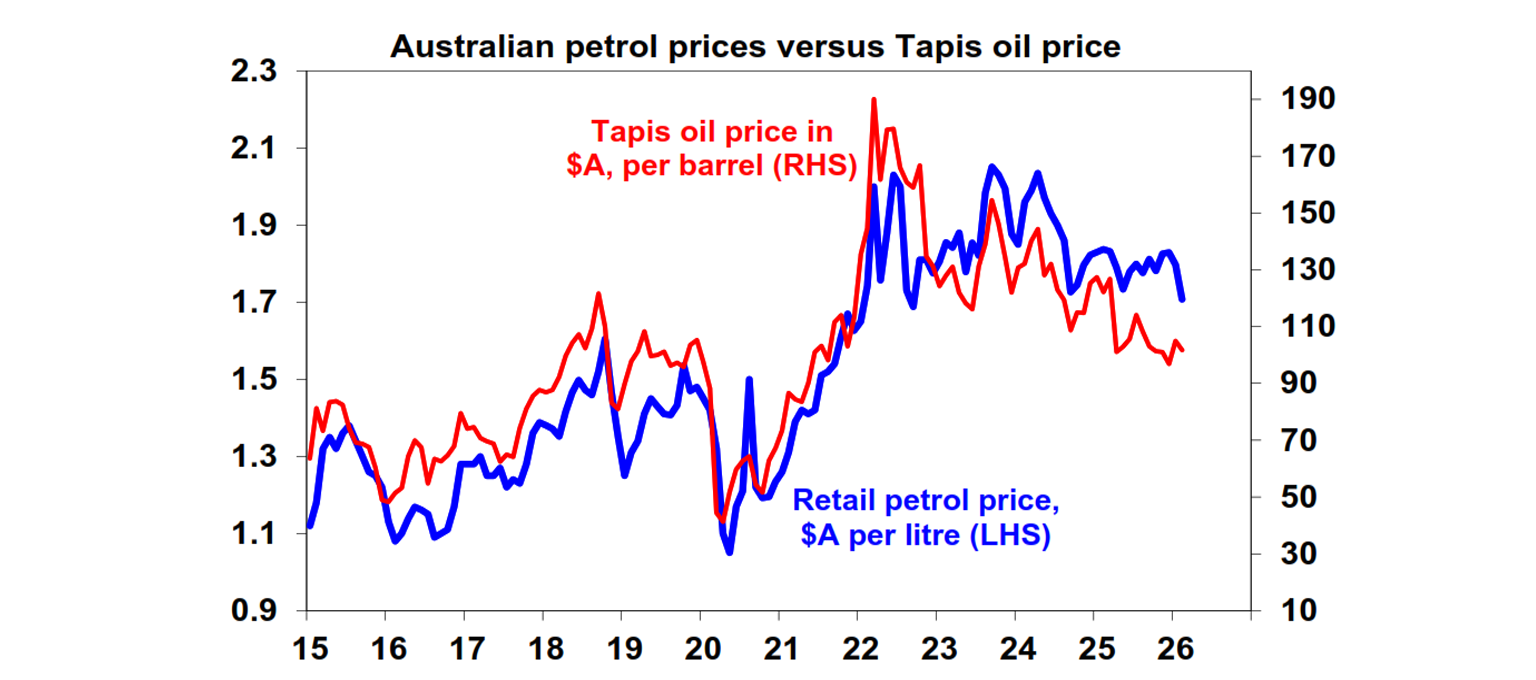
Oil prices have ticked off December lows to reflect some of the risk, but the move is consistent with normal volatility and has been partly offset by the stronger $A so the implications for Australian petrol prices are minor so far. Based on the chart below Australian petrol prices should be lower given where the oil price is in Australian dollars.
Overall, our view remains that this year will see a volatile ride for investors on the back of geopolitical threats, Trump bluster, the US midterm election, interest rate uncertainty and worries around an AI bubble and wider tech issues like seen in the last week with Claude. High and still rising investor optimism points to a high risk of a decent pull back in shares at some point. So, we still see another 15% or so correction sometime in the next six months.
But ultimately, we see it turning out okay for shares this year with reasonable returns on the back of good global economic and profit growth, Trump focussing on policies to help US households ahead of the midterms, the Fed cutting rates once or twice more, and profit growth turning positive in Australia. At the same time the US dollar is likely to remain in a downtrend as Trump’s policies continue to dent US exceptionalism and safe havens like gold are likely to trend higher as investors seek out a hedge to protect against risks around geopolitical conflict, high public debt levels and the threat to Fed independence. This will likely see ongoing strength in the Australian dollar.
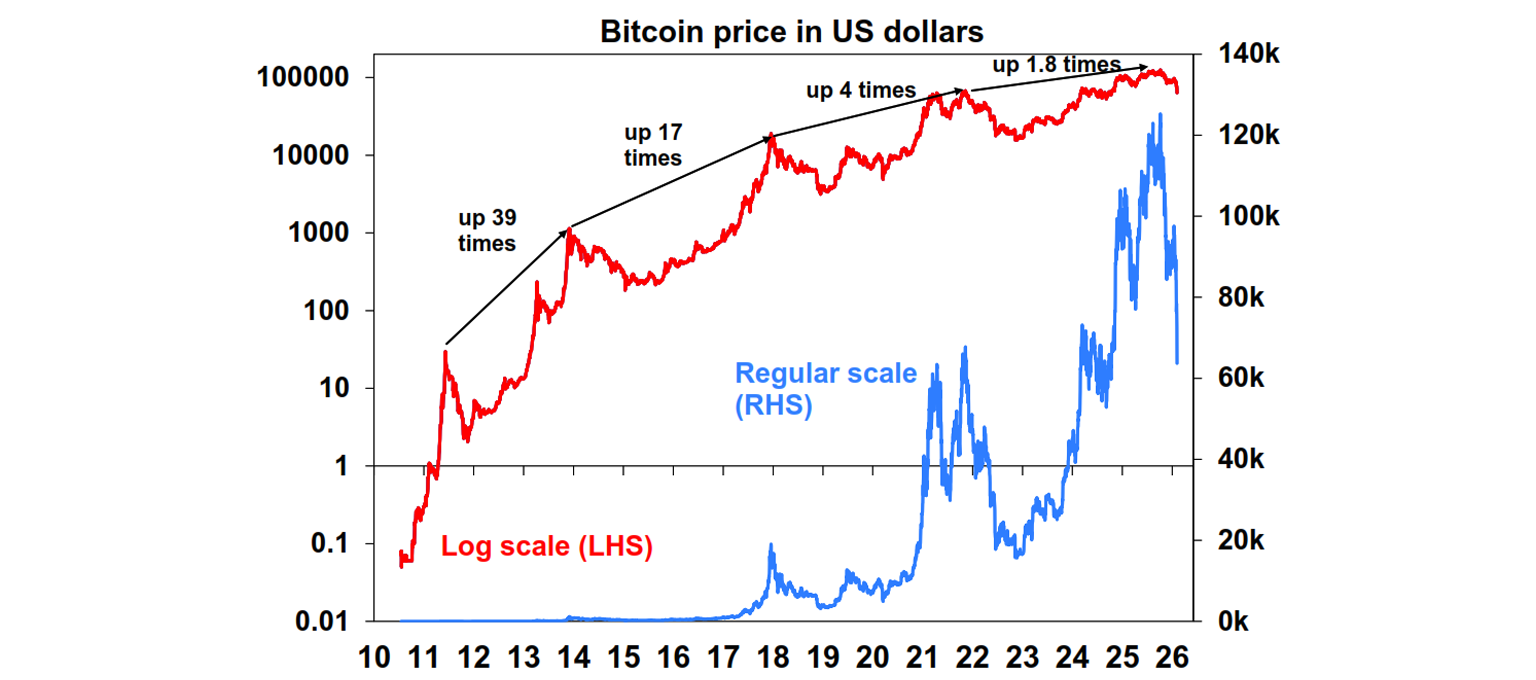
What’s happening to bitcoin? From last year’s high to its recent low bitcoin has fallen around 50% and even though it bounced on Friday its increasingly looking like it’s in another “crypto winter”. As can be seen in the next chart these come along roughly every four years and have seen falls of around 80%, with the last one being in 2021-22. Bitcoin has algo been increasingly correlated with shares with a high beta so the fall in US shares has led to magnified falls in bitcoin. Bitcoin is a hedge against paper currency debasement, but gold is more established, and is also an accepted hedge against geopolitical risk and had underperformed bitcoin until recently. For investors there is a case to have an allocation to bitcoin as it becomes mainstream but its plunge reminds that its highly volatile so any allocation to it should be small and risk controlled and it can be seen from the chart that its returns (measured from peak to peak) do appear to be slowing as it moves from a fringe start up to something more mainstream.
Major global economic events and implications
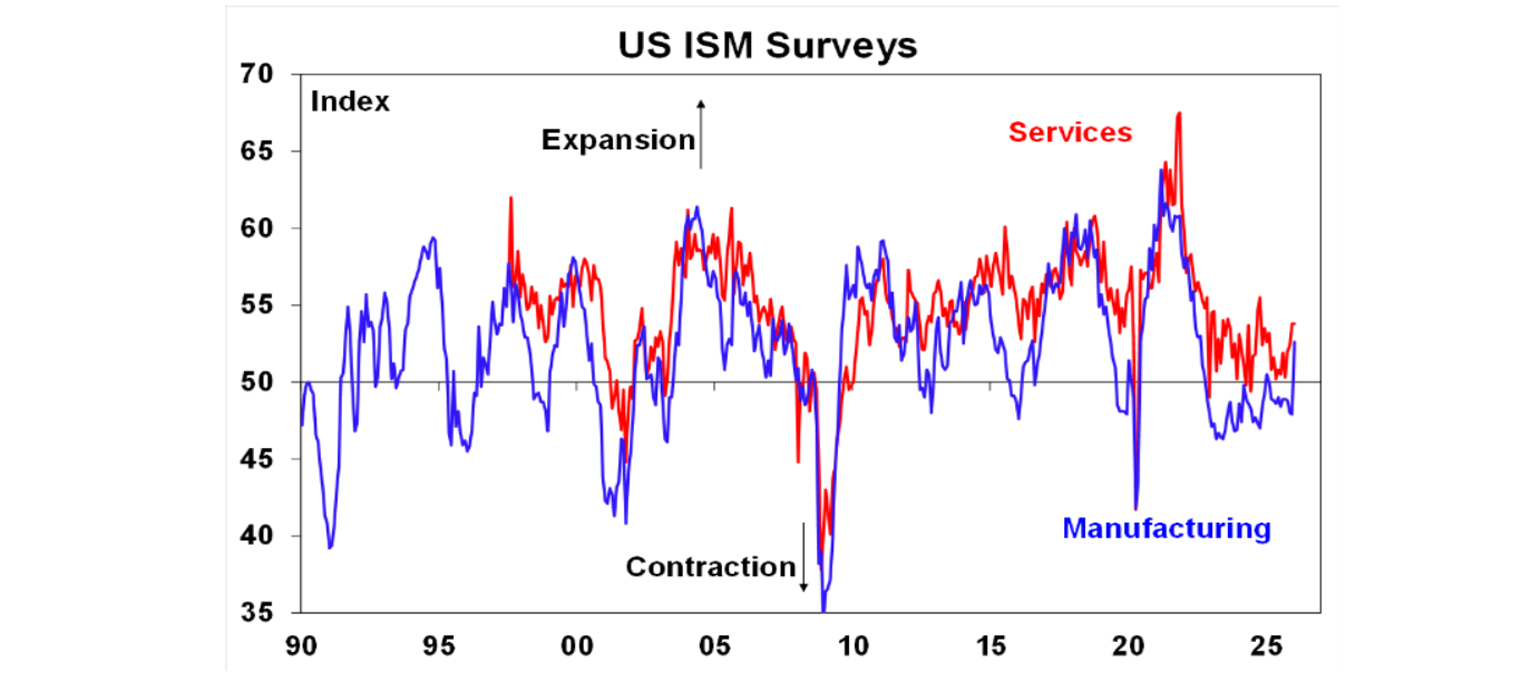
US business conditions were strong in January according to the ISM survey with manufacturing bouncing back into positive territory and to its strongest since 2022 and services remaining solid. Both continue to see relatively elevated readings for prices paid though although they are down from their highs last year.
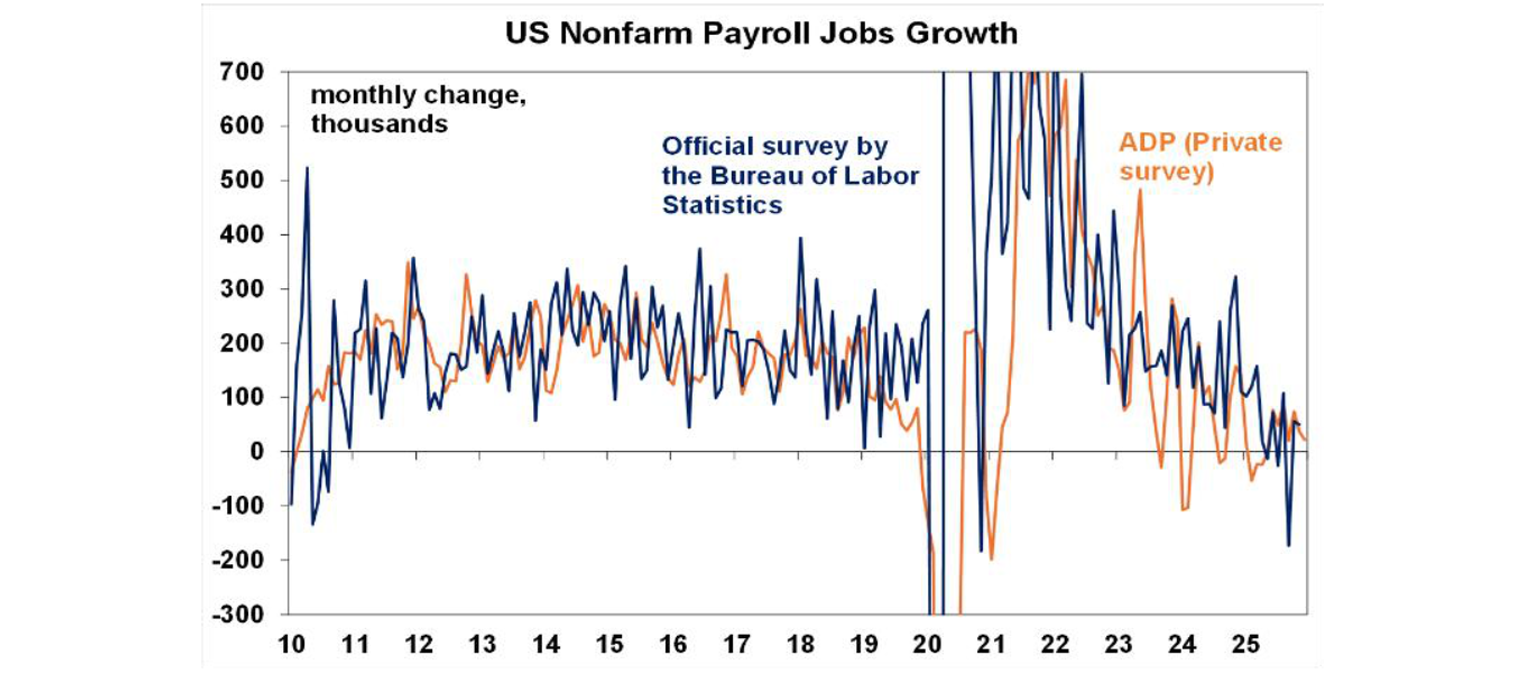
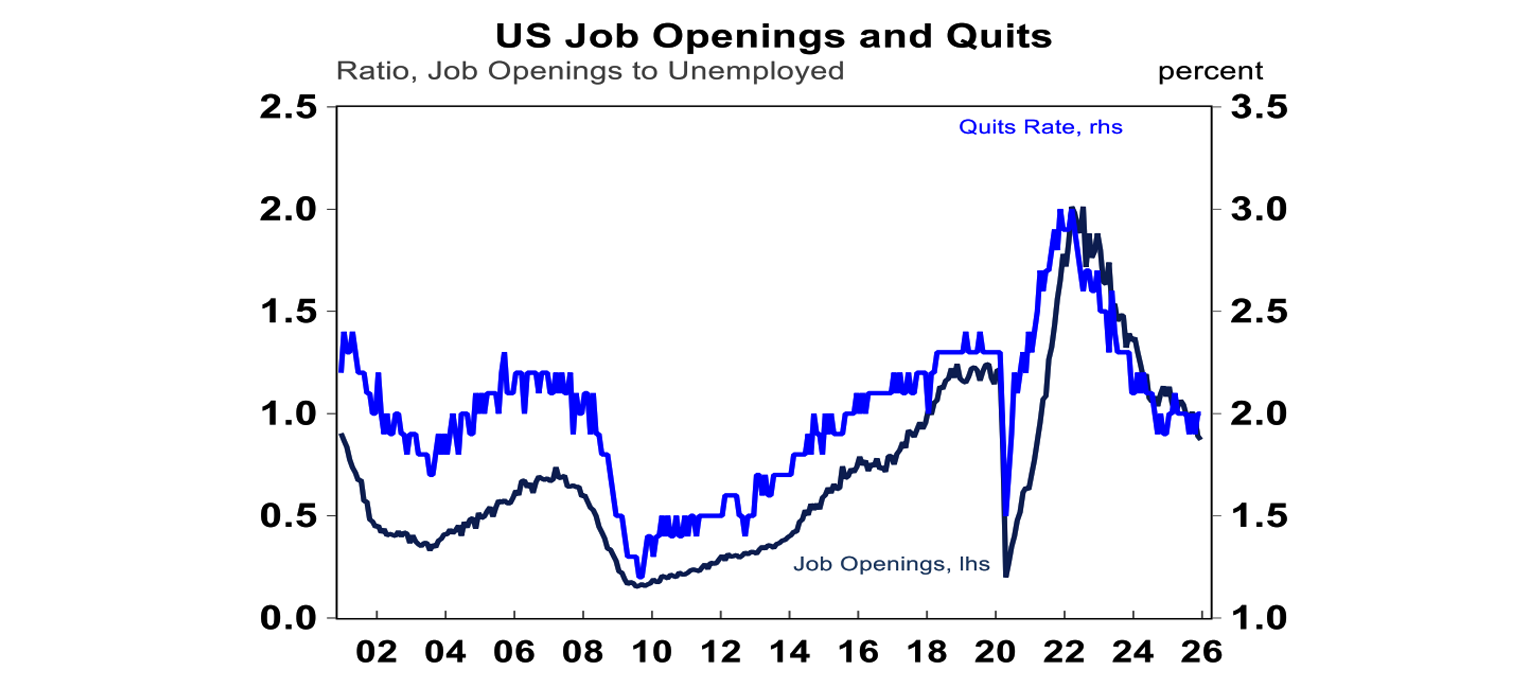
US jobs data was messier though. The ADP private sector jobs survey remains weak, job openings fell sharply in December, hiring remains low and the Challenger survey showed job cuts spiking in January. Against this the quits rate rose, the BLS layoff rate measure remains low and while jobless claims rose they remain low. This is a messy picture for the Fed keeping the likelihood of further rate cuts alive.
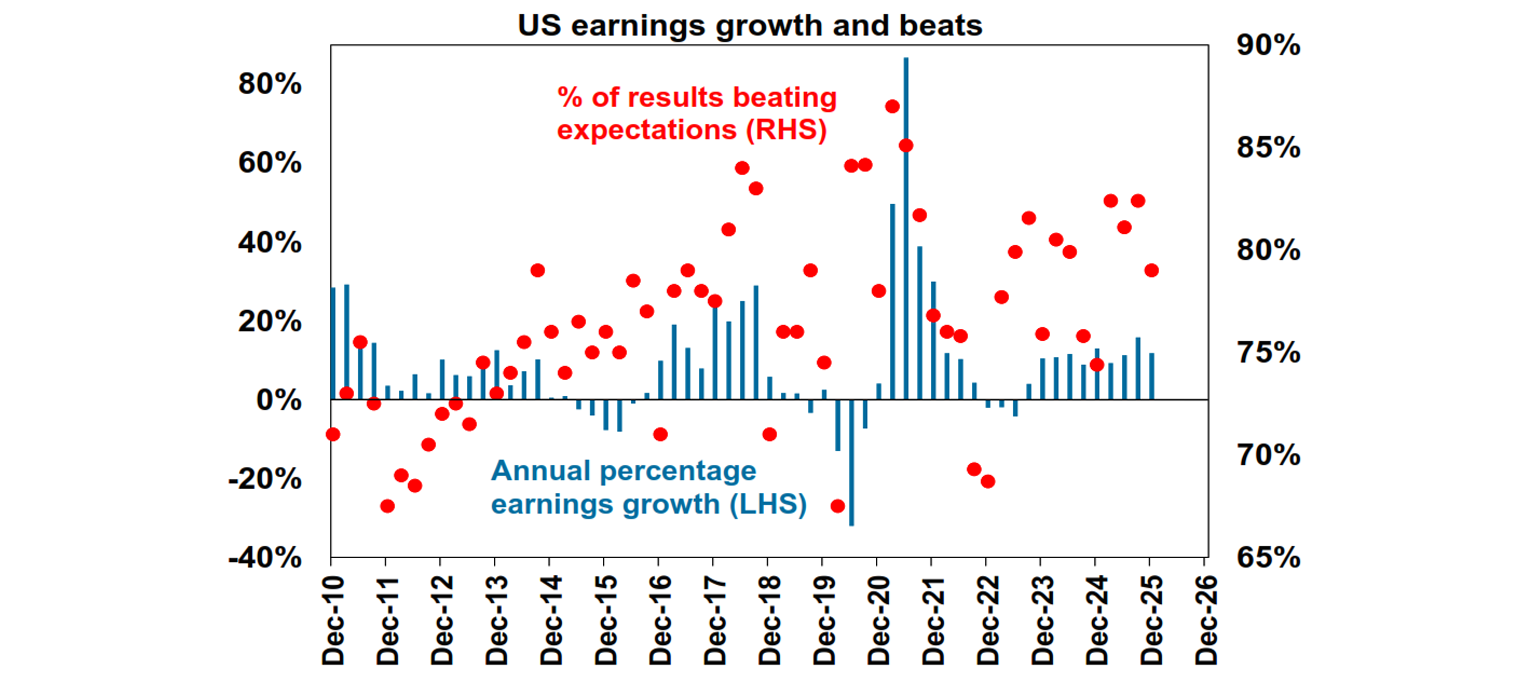
So far nearly 60% of S&P 500 companies have reported December quarter earnings, with 79.4% beating expectations, above the norm of 76.6%. Consensus earnings expectations have increased to 11.8%yoy but are likely to come in around 12.5% allowing for normal beats. Tech is leading the charge again with earnings up 26%yoy, financials up 12%yoy and materials up 9%yoy. While tech earnings have been strong again there is increasing concern that they are overinvesting in data centres and the like.
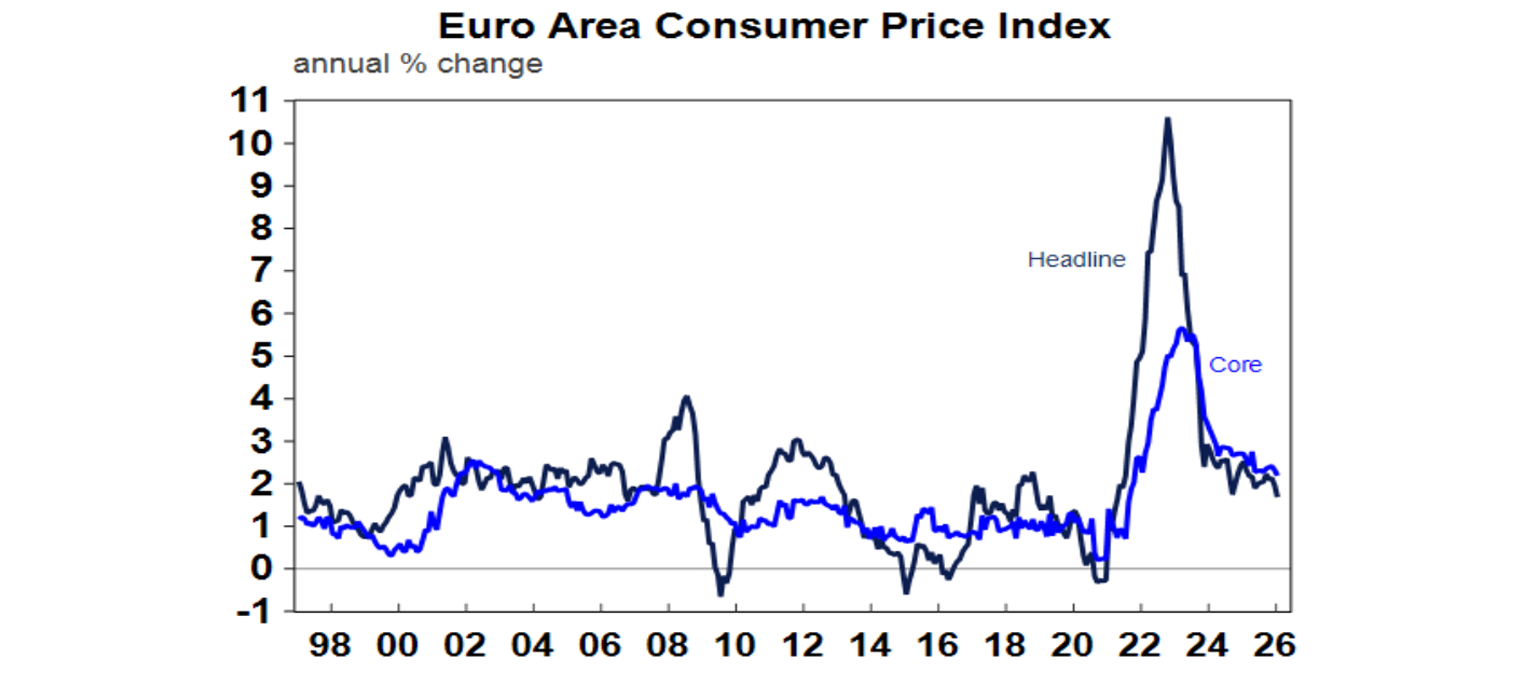
The ECB left rates on hold at 2%, with neutral guidance noting geopolitical risks but German stimulus (with German factory orders rising strongly). The money market sees a 25% chance of another cut. January core inflation fell to 2.2%yoy and as its around target is consistent with the ECB remaining on hold.
The Bank of England also held at 3.75% but shifted dovish with forecasts for higher unemployment and lower inflation and a 5/4 vote to hold. It looks likely to cut again by April.
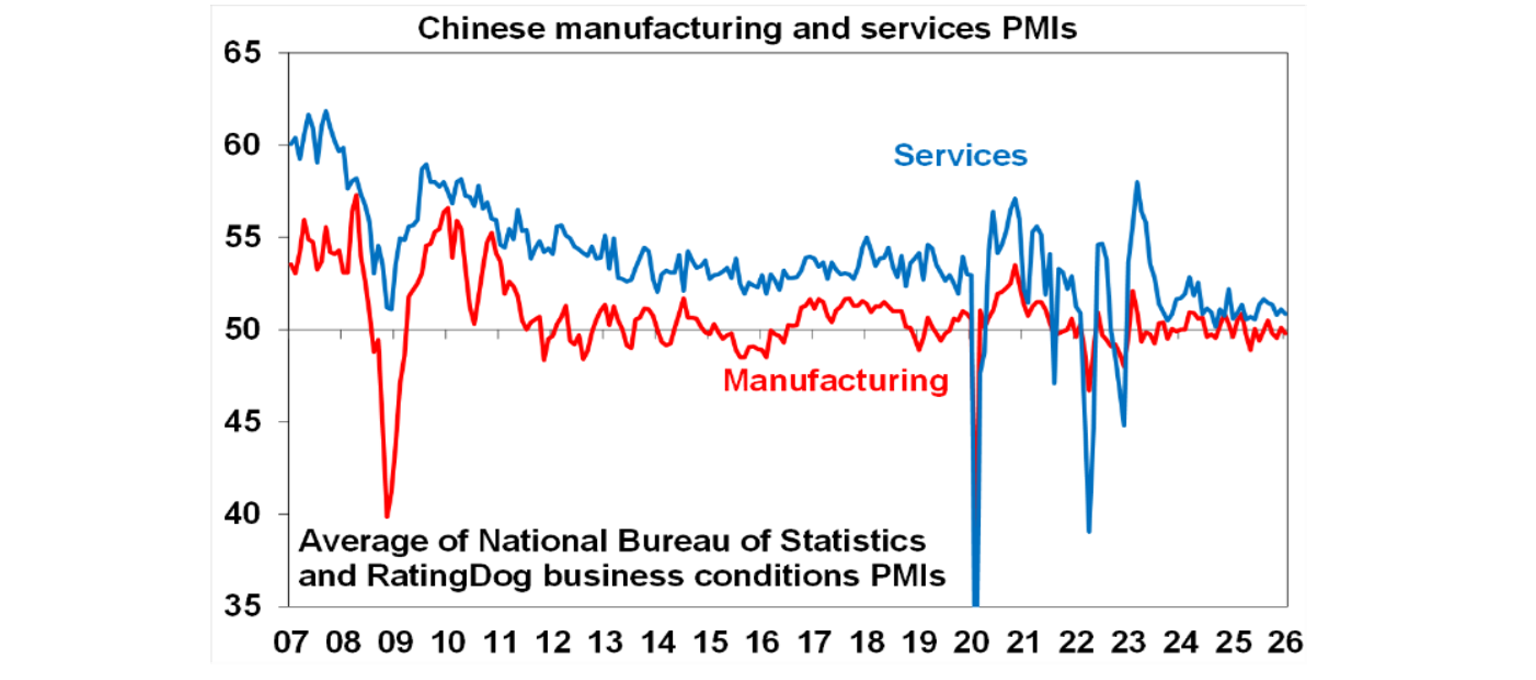
Chinese business conditions PMIs softened on average in January with a fall in the official PMIs but slight gains in the Rating Dog PMIs. They remain in the same range they have been in for the last two years.
Australian economic events and implications
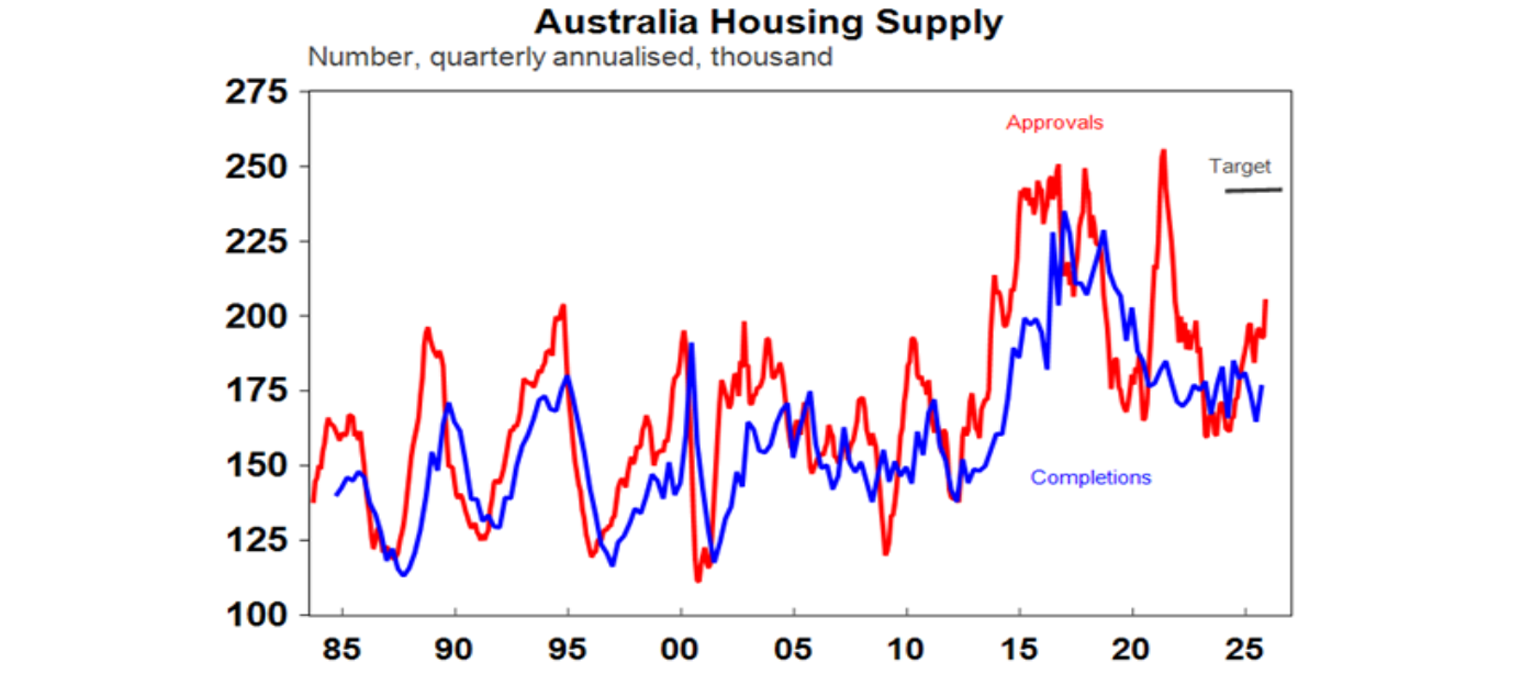
Home building approvals plunged 15% in December due to volatile unit approvals. The trend remains up though and is running around 200,000 dwellings a year pointing to a pickup in completions. But it’s still well below the Housing Accord target for 240,000 dwellings a year. The RBA’s forecasts for dwelling investment to slow then go negative in 2028 imply that it does not see the Housing Accord target being met as it would require a rise in dwelling investment growth – unless there are a lot of tiny homes in the mix!
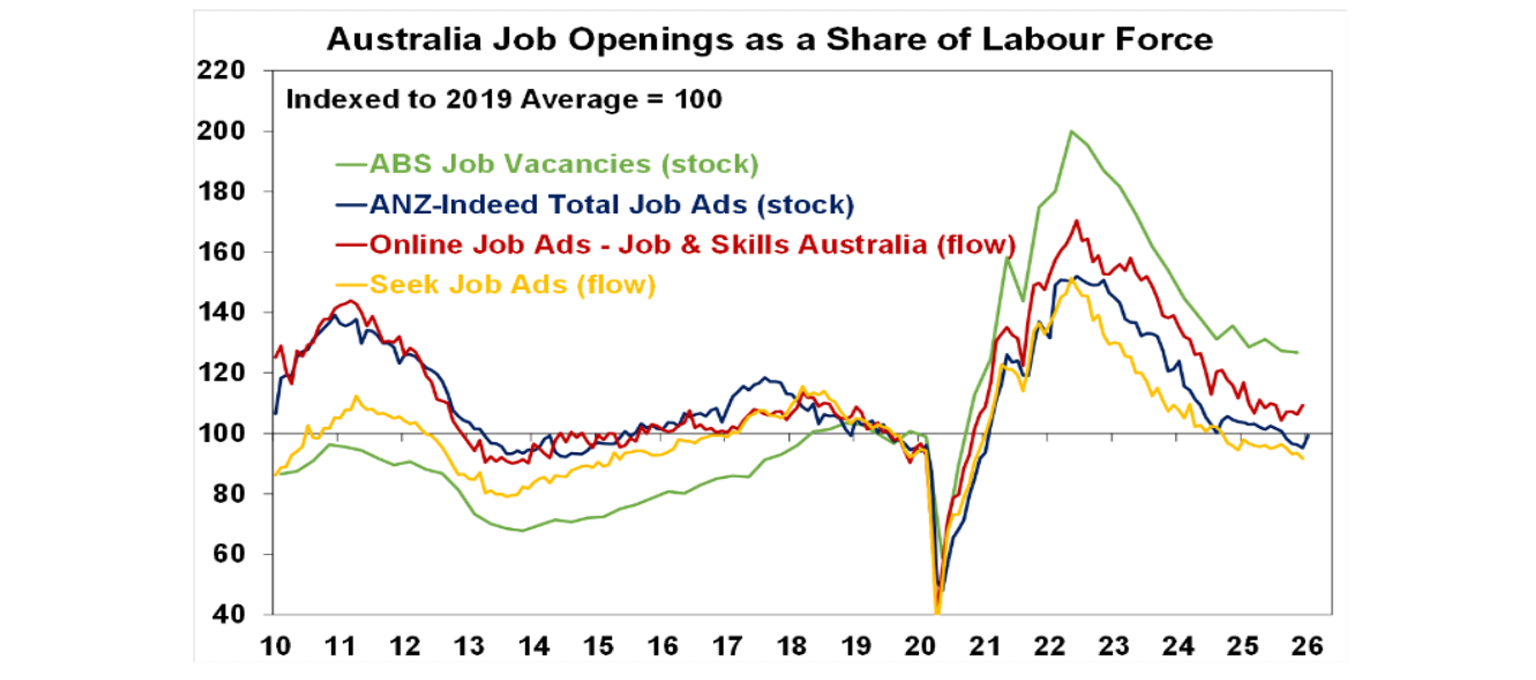
ANZ-Indeed job ads rose 4.4% in January, but they can often be volatile over the December/January period.
Home price momentum has slowed. It bounced back to 0.8%mom in January, but it’s down from the highs last year. Sydney and Melbourne look very soft, and Adelaide, Brisbane and Perth are showing signs of slowing a bit.
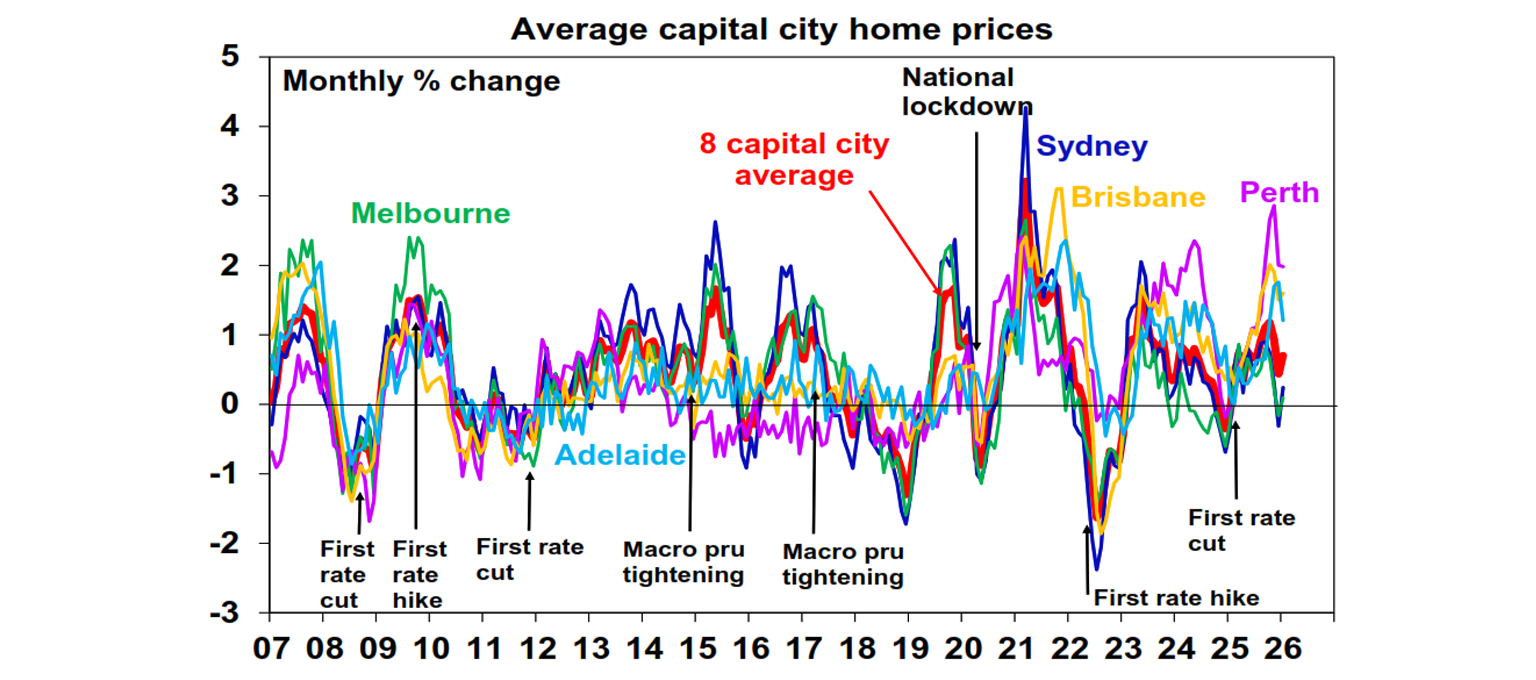
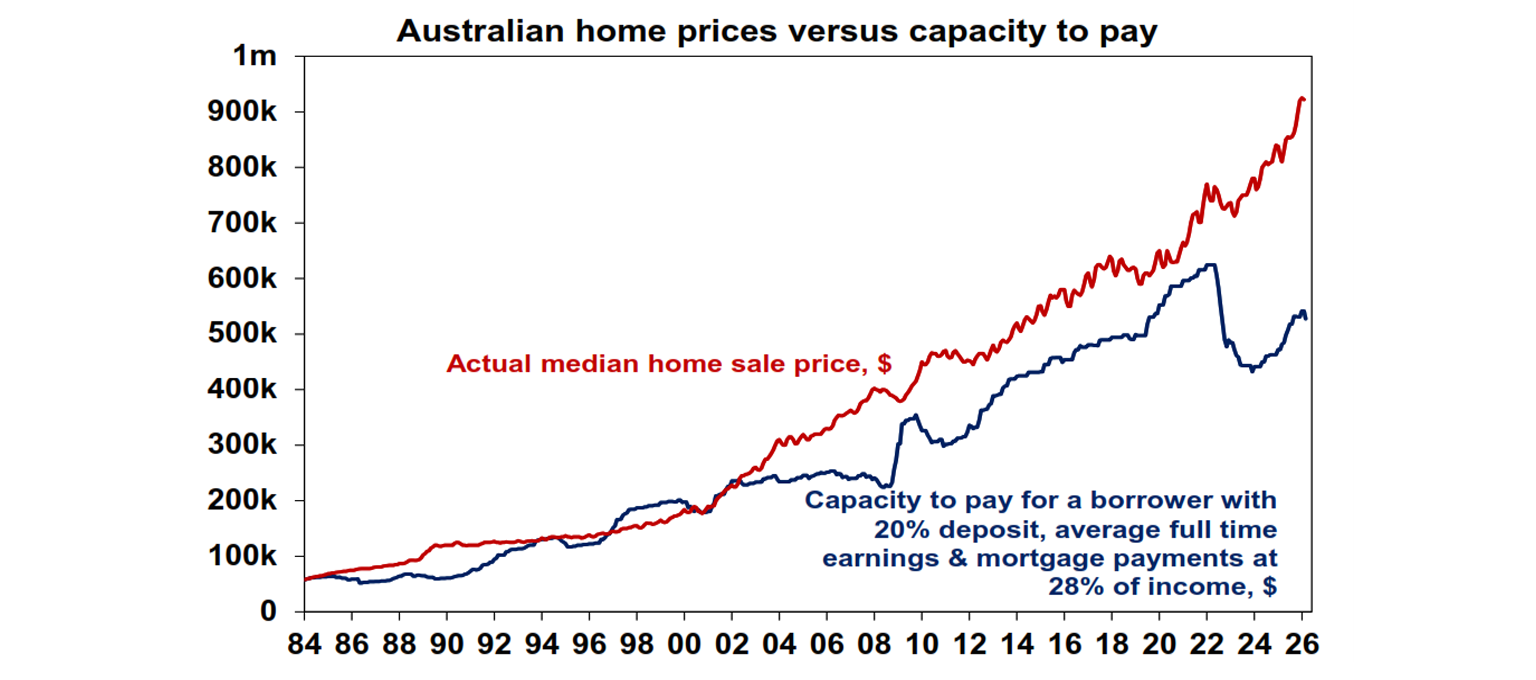
Expect home price growth to soften further. With mortgage rates on the way up again the capacity to pay for a home for a home borrower on average earnings has likely peaked well below its 2021-22 high. Sure, home prices rose in 2023 despite rate hikes but that was because immigration surged. Roughly speaking each 0.25% rise in mortgage rates knocks about $11,000 off how much a person on average earnings can borrow to buy (and hence pay for) a home.
The Melbourne Institute’s Trimmed Mean Inflation Gauge was flat in January. It’s been undershooting the ABS measure but has also seen some downtrend in monthly rises since July last year and so its flat result in January suggests we may see a soft outcome in the ABS measure.
What to watch over the next week?
In the US, the focus will be on delayed January jobs data (Wednesday) which is expected to show a slight rise in payroll growth to 70,000, unemployment remaining at 4.4% and growth in average hourly earnings slowing to 3.7%yoy. CPI data for January (Friday) is likely to show a slight fall in headline and core inflation to 2.5%yoy, December quarter employment costs (Tuesday) are expected to have increased by 0.8%qoq with a slowing to 3.4%yoy, retail sales growth for December (Tuesday) are expected to remain robust but existing homes sales (Thursday) are likely to have fallen.
Japan will see reaction to its lower house election with the LDP well ahead in polling.
Chinese January CPI inflation (Wednesday) is expected to slow to 0.4%yoy, with producer prices likely down 1.6%yoy.
In Australia, December household spending (Monday) is expected to have increased 0.3%mom or 6.1%yoy but consumer confidence (Tuesday) is likely to show a further fall reflecting the recent rate hike. The NAB business survey will also be released on Tuesday. December quarter housing finance data (Wednesday) is likely to show 2%qoq growth.
The Australian December half earnings reporting season will start to ramp up and should show a transition to rising profits after three years of falls. The consensus expectation is for earnings growth of 11.7% this financial year mainly driven by a 30% surge in mining sector profits, with banks seeing around 9% growth, energy seeing a 19% fall and the rest of the market seeing profit growth around 6%. This follows three years of falling profits. 30 major companies are due to report in the week ahead including CBA, CSL, AMP, ASX, Origin, Cochlear and Westpac.
Outlook for investment markets
Global and Australian share returns are expected to slow to around 8% this year. Stretched valuations in the key direction setting US share market, political uncertainty associated with Trump and the midterm elections, AI bubble and tech valuation worries and geopolitical risks are the main drags, but returns should still be positive thanks to Fed rate cuts, Trump’s consumer friendly pivot and solid profit growth. A return to profit growth should also support gains in Australian shares even though the RBA has increased rates. Another 15% or so correction in share markets is likely along the way though.
Bonds are likely to provide returns around running yield.
Unlisted commercial property returns are likely to be solid helped by strong demand for industrial property associated with data centres.
Australian home price growth is likely to slow to 5% or less due to poor affordability, the RBA raising rates with talk of more to come and APRA’s move to ramp up macro prudential controls.
Cash and bank deposits are expected to provide returns around 3.85%.
The $A is likely to rise as the interest rate differential in favour of Australia widens as the Fed cuts and the RBA holds or hikes. Fair value for the $A is around $US0.73.
You may also like
-

Weekly market update - 17-07-2026 Pressure remained on Korean shares which are down 25% from their high on worries about a bubble, profit taking after shares more than doubled, heavily leveraged retail investors closing positions, tightened regulations around buying singe stock leveraged ETFs and not helped by the Bank of Korea raising rates with more hikes likely. -

Oliver's insights - Why have Australian living standards “fallen” and how do we fix it? For the last few years there has been much talk of a “cost-of-living” crisis in Australia and of “falling living standards”. This has flared up again lately with the pickup in inflation resulting in a renewed fall in real wages. -

Weekly market update - 10-07-2026 Ceasefire over but markets are also over the war, Why oil prices can't go too low or too high, Is AI adding to inflation risk or taking it away, and Australia’s wage problem.
Important information
Any advice and information is provided by AWM Services Pty Ltd ABN 15 139 353 496, AFSL No. 366121 (AWM Services) and is general in nature. It hasn’t taken your financial or personal circumstances into account. Taxation issues are complex. You should seek professional advice before deciding to act on any information in this article.
It’s important to consider your particular circumstances and read the relevant Product Disclosure Statement, Target Market Determination or Terms and Conditions, available from AMP at amp.com.au, or by calling 131 267, before deciding what’s right for you. The super coaching session is a super health check and is provided by AWM Services and is general advice only. It does not consider your personal circumstances.
You can read our Financial Services Guide online for information about our services, including the fees and other benefits that AMP companies and their representatives may receive in relation to products and services provided to you. You can also ask us for a hardcopy. All information on this website is subject to change without notice. AWM Services is part of the AMP group.