


Weekly market update
Investment markets and key developments
Whatever fragile ceasefire between the US and Iran cracked wide open this week - with Iranian strikes on Kuwait and Bahrain, Israeli strikes in Lebanon and a US strike on an oil tanker headed to the Islamic Republic.
11 min read

Whatever fragile ceasefire between the US and Iran cracked wide open this week - with Iranian strikes on Kuwait and Bahrain, Israeli strikes in Lebanon and a US strike on an oil tanker headed to the Islamic Republic. One day Trump asserts that a deal is close or in the final stages, the next there are threats to keep the Strait of Hormuz closed until US Labor Day in September. In any case, Iranian-backed militant group Hezbollah said they had rejected the US conditions.
Financial markets, though, seem to have moved on from deal-watching. The working assumption is that an agreement happens eventually, and in the meantime, investors are refocussing on what they can actually measure - underlying economic data and company profits – both of which are holding up well. The US data is looking like its turning up rather than down.
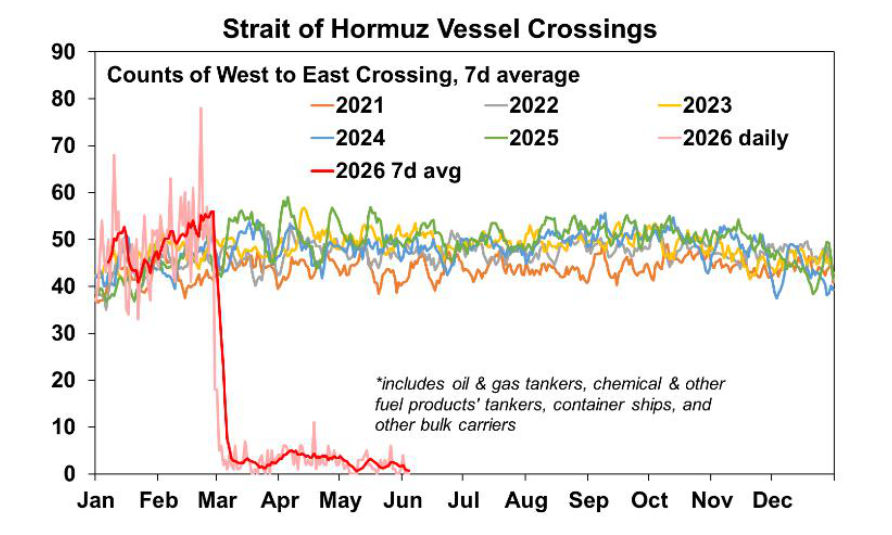
Nevertheless, let’s not forget that we are still in the midst of an oil shock, with very little vessel traffic going through the Strait of Hormuz (see the chart below) which dipped again this week.
Despite the lack of supply, oil prices remain in a range between $90-$110/barrel (see the chart below) and analysts continue to expect prices to continue trending down.
This does show that the oil market was oversupplied prior to the start of the conflict and that oil has bypassed the Strait through other methods (like pipeline) and utilising reserves.
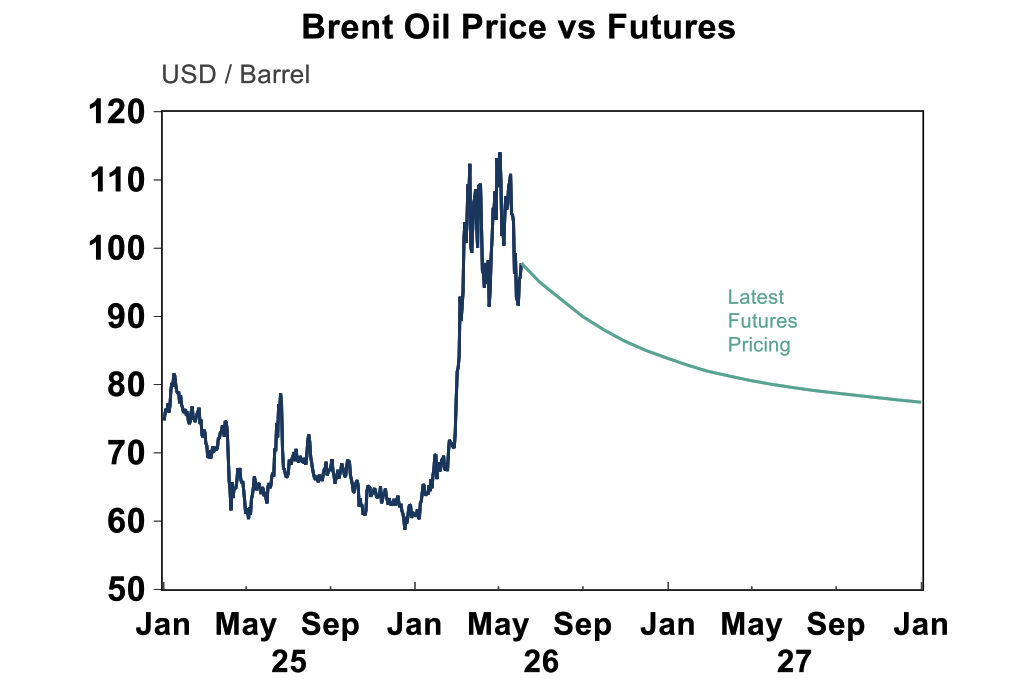
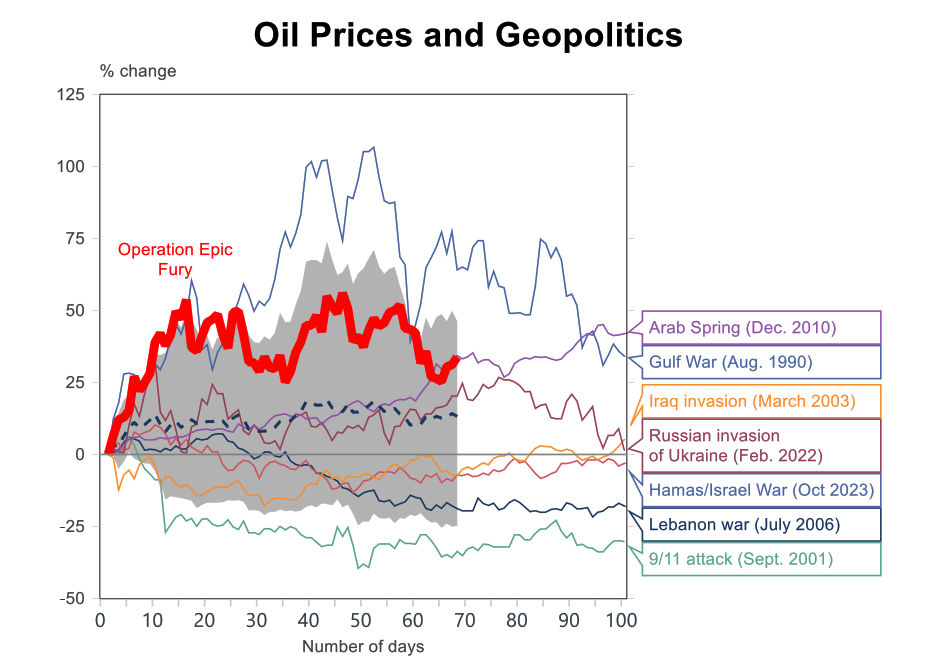
There is still the risk that the longer the ~10% oil supply hit continues that oil prices shoot up and then cause a bigger problem for global growth and inflation. The current disruption remains one of the biggest and longest in history.
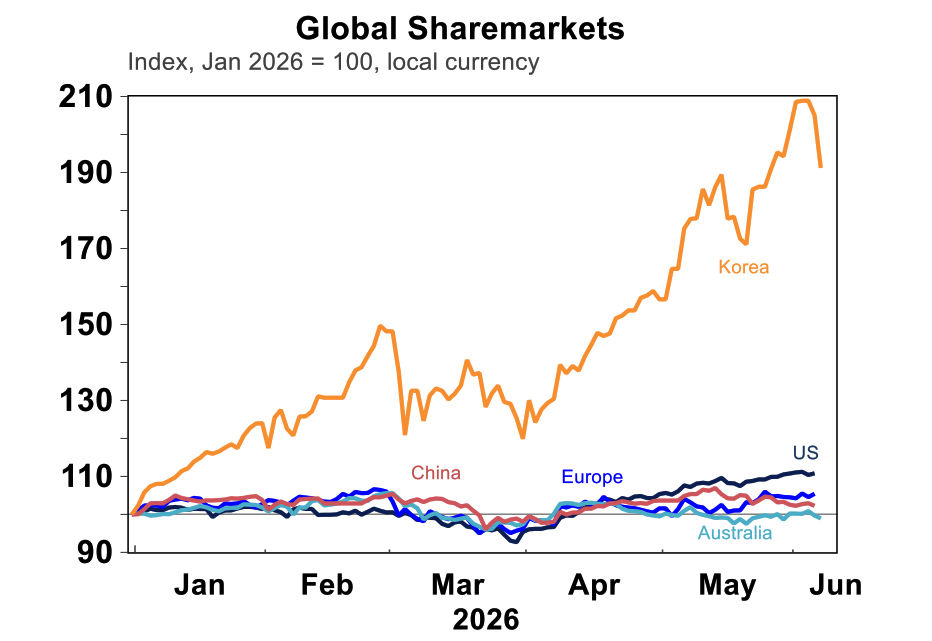
In the meantime, US shares continue to dominate. Over the week, the S&P500 was flat but reached a record-high mid-week and is up 11% since the beginning of the year. Although this doesn’t compare to the parabolic performance of Korean equities, up 91% year to date from the semiconductor demand boom. Australia is massive laggard from rate hikes and recent budget tax concerns, despite better profit growth. The ASX200 was down by 1% this week, with gains in tech, consumer staples, energy and healthcare but more falls in financials (banks), real estate and materials.
It’s hard to get too negative on sharemarkets, especially in the US. Sure there are still a lot of downside risks - like the war and oil prices and the subsequent lift in inflation and slowing in growth, AI bubble concerns, lack of central bank rate cuts and issues in the private credit space but to counter that – US activity indicators are looking better, there is still plenty of spending for AI with plenty of excitement lately for the upcoming listing of Musk’s SpaceX and Anthropic. We see shares continuing to trend higher, although the long list of concerns means that there will be periods of drawdowns.
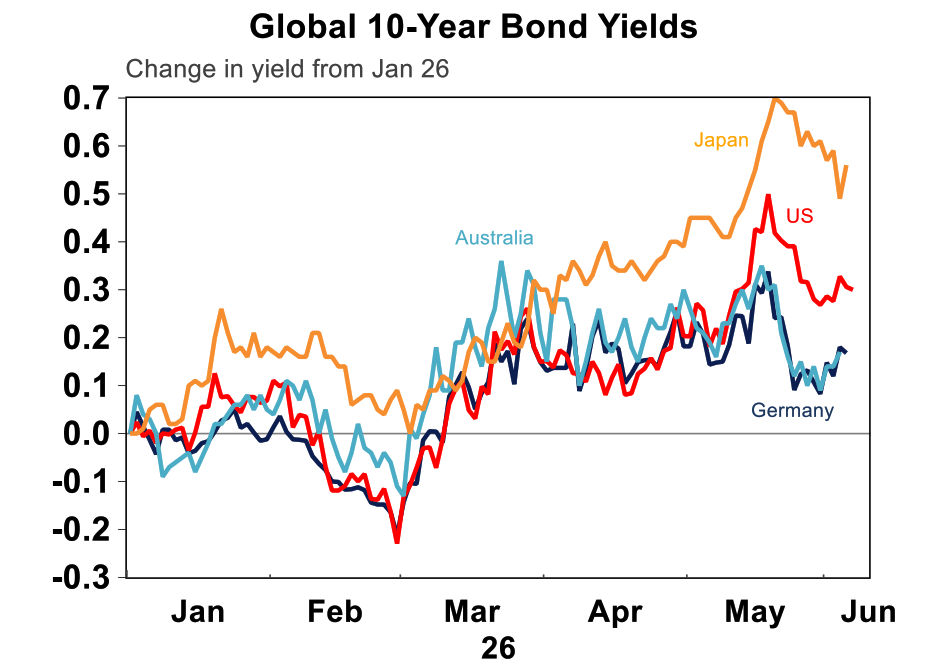
It’s also helpful for shares that bond yields have been trending down again (see the chart below). US and Japan have seen the highest increase to yields this year, with the US 10-year at 4.46%.
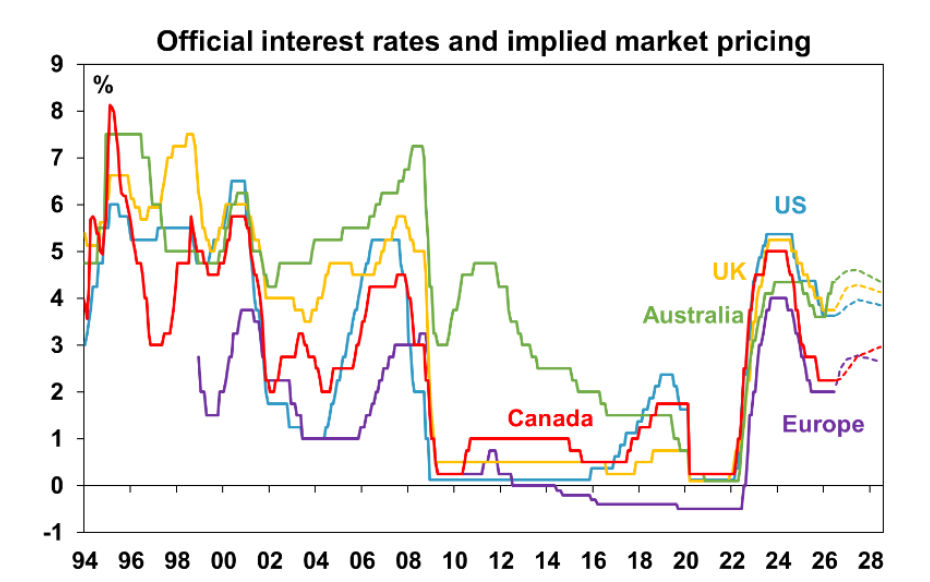
Australia is no longer expected to be an outlier with rising interest rates. Markets are pricing in higher interest rates globally (see the chart below) which is keeping yields elevated. This week, US Fed regional president Logan, spoke hawkishly about the outlook for rates and she sees the risk for higher interest rates later this year. Another Governor Williams was more neutral. Kevin Warsh, the new Fed Chair, will hold his first meeting as Chair in a few weeks so there may be some changes to Fed communication and focus ahead.
Just in case you hadn’t had enough of US political news, there was another tariff update this week. US Supreme Court ruled earlier this year to outlaw the IEEPA tariffs (baseline of 10% on all imports but with most major trading partners between 10%-30%) which led Trump to quickly put a 10% across-the-board tariff under Section 122 but these can only be in place for 150 days before discussion with Congress, with the deadline on 24 June. This week the US Trade Representative announced a new tariff under Section 301 against “unfair trading practices” using “forced labour” (for Australia this includes products such as rice from Myanmar, tobacco from Malawi, beef from Brazil and cotton and polysilicon from China). This new tariff will be subject to a 30-day public consultation (so don’t start straight away) and 60 US trading partners (including Australia, EU and UK, NZ and China) will be subject to tariffs at a baseline rate of 10-12.5%. Countries that were exempt under the old tariffs will still be expect. It’s not unexpected that Trump and his team have found another way to impose tariffs after the initial round were ruled down. E
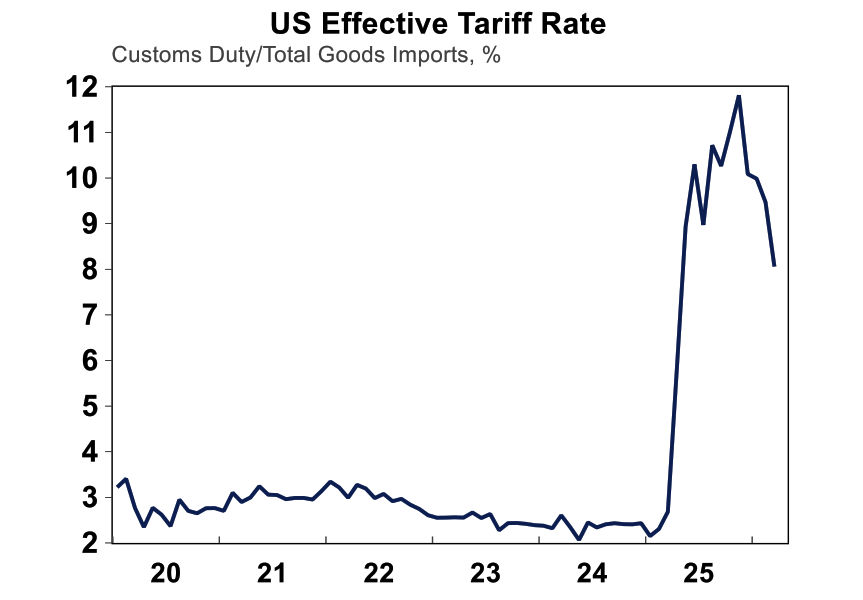
Expect more investigations to get the baseline tariff rate even higher, as the US Trade Representative is also looking at another investigation on excess capacity. This announcement doesn’t actually change the effective tariff rate, as this tariff replaces the other one. The effective US tariff rate peaked at around 12% and recently fell to around 8%, so the inflation impact from tariffs has more or less passed.
The next few weeks are busy in the US with the President’s 80th birthday on 14 June which also lines up with the start of the celebration for America’s 250-year birthday. The event has seen a lot of the line-up pull out but Trump has offered himself as the “Number One Attraction” in place of the “highly paid, third-rate artists”. Although now it looks like it will be “the Greatest Rally, EVER”. Hopefully the president can still find time in coming weeks to broker a longer-lasting deal with Iran!
It’s not just the US where politics has been interesting. Bringing it back home, the House of Representatives passed the Labour government contentious budget tax changes and this bill will now go to the Senate, where it is likely to be met with more of a challenge because Labor does not have a majority in the House and needs crossbench support (primarily from Greens).
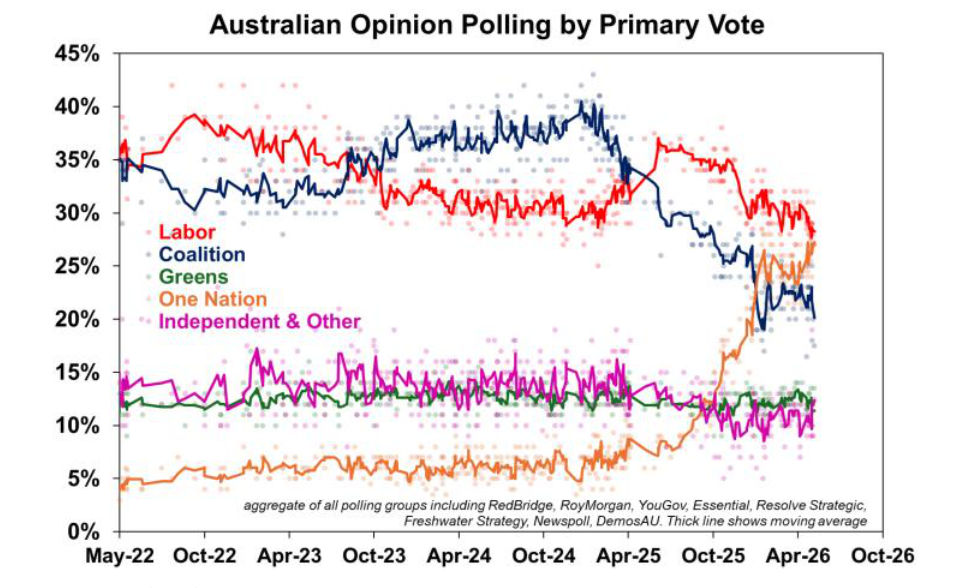
The latest post-budget poll conducted by The Australian Financial Review/Redbridge Group/Accent Research showed that support for One Nation was ahead of Labor at 30% compared to 28%, respectively. Albanese is still the preferred Prime Minister, but is losing his margin to Pauline Hanson (leader of One Nation). Changes in the budget were clearly unpopular with Millennials and Gen X who, according to this poll, had the largest share of people who thought the budget would be “bad” to “very bad” for them. Maybe there are more aspirational young people than the government assumed but the fear-mongering in the media wouldn’t be helping.
The changes in the budget are complex and nuances and will impact people differently which is hard to convey. This is just one poll but it’s likely that others in coming weeks will be similar.
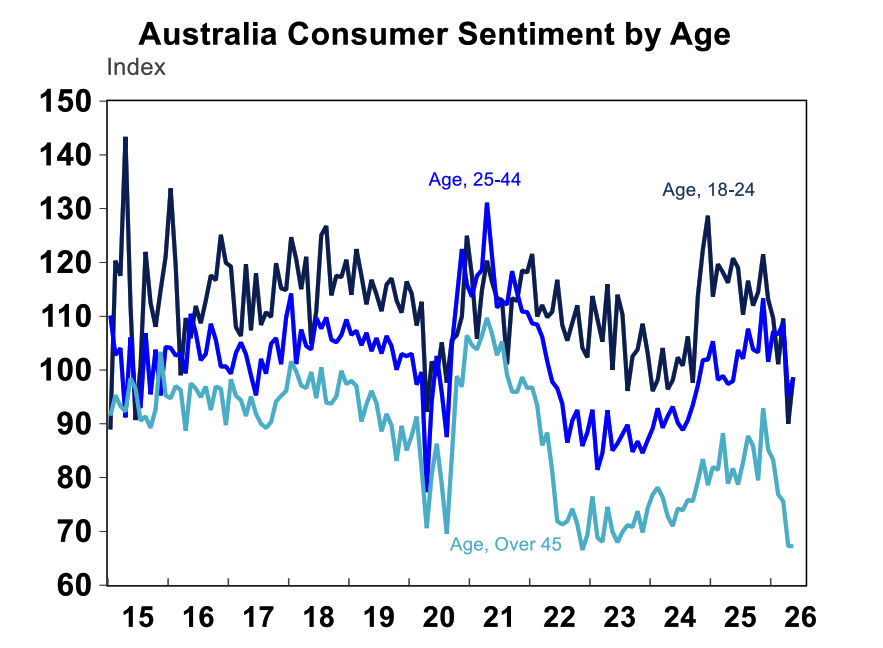
Interestingly, the May Westpac Melbourne Institute consumer sentiment survey which was conducted after the budget showed a rise in confidence for those aged 18-24 and 25-44, while confidence was flat for those aged over 45. Maybe it’s all the negative talkback in the weeks post-Budget that has gotten people down more and that was reflected in the poll result.
More rate hikes needed in Australia? The Fair Work Commission announced a larger-than-inflation increase to minimum (+6%) and award wages (+4.75%) starting from 1 July. This is larger than last year’s increase of 3.5% and exceed the industry submissions to the Fair Work Commission (which were around 3.7%), although were closer to the ACTU’s proposed 6% increase.
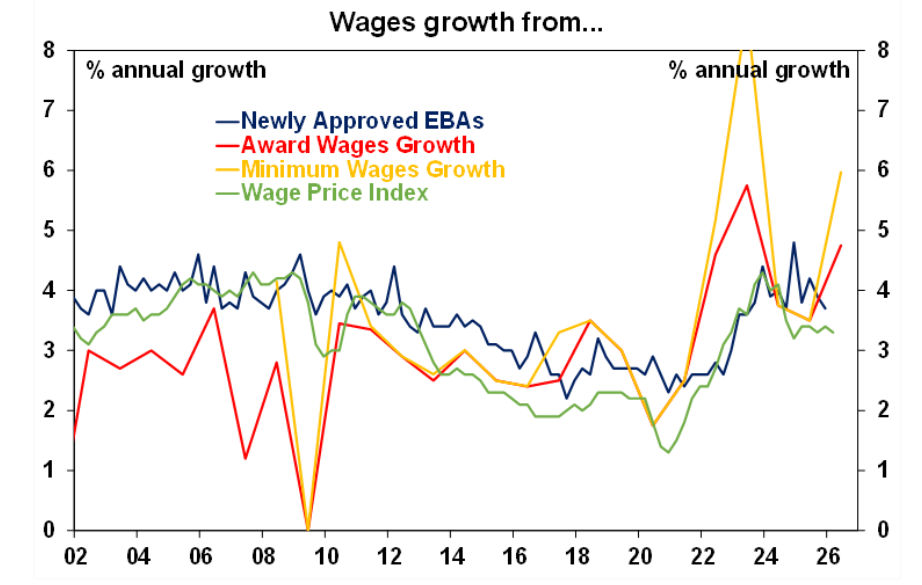
The change impacts around 12% of Australia’s wage bill. However, this increase is likely to lead to a similar rise in enterprise bargaining agreement rates (some of which are derived from award rates) through the “signalling” effect as people demand wage increases on par with others, and this includes the private sector too. This is what happened in 2023. Of course, the labour market has to be strong enough to allow people to demand higher wages (without losing their jobs). While labour market conditions have eased a little in Australia, the unemployment rate remains very low, and many industries are finding it hard to employ the right people. So there appears to be little excess capacity, which means businesses will need to lift wages (we now see annual wages growth accelerating to 3.7% later this year) and increase costs to pay for these increases. All of which means higher inflation. We are now allowing for 2 more rate increases from the RBA, with the next one to occur most likely in August followed up by another hike in November.
Major global economic events and implications
The “hard” data out of the US was strong this week and was confirmed by “soft” qualitative indicators like the Fed’s “Beige Book” which is a look at conditions across the Fed regional banks and showed conditions are good across regional banks.
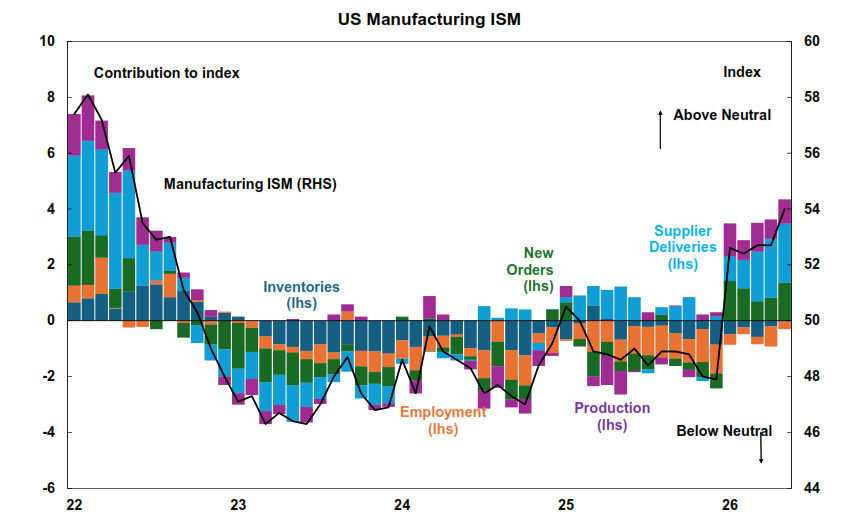
The US manufacturing ISM index increased to 54 in May, from 52.7 last month, a very strong result with manufacturing expanding at its fastest rate since May 2022. Supplier deliveries, production, inventories all rose while employment is still soft.
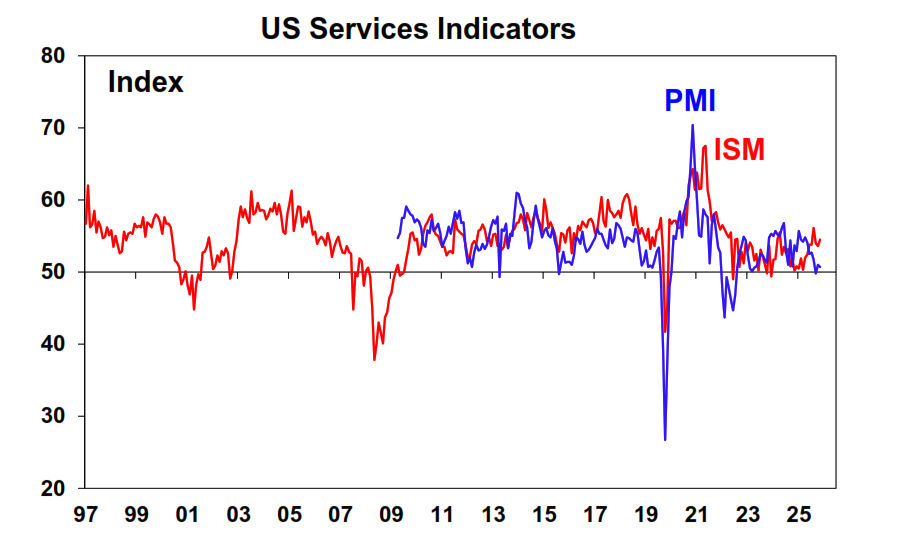
The US services ISM at a four-year high, stronger than the signal from the PMI services read. with a lift in input prices.
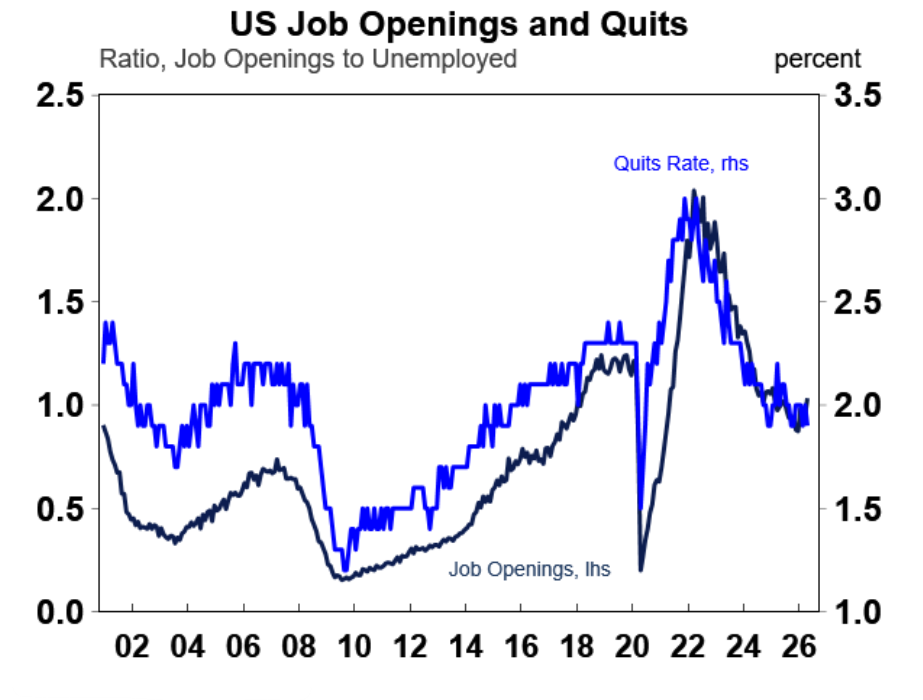
The US labour market is improving after a moderation over 2025. Job openings surged by 731K in April, the largest monthly jump since April 2021. This means there are more vacancies for those looking for work and the “job openings to unemployed” ratio increased to 1 – which means there is 1 available job for every unemployed person, a good position to be in. The quits rate declined a little to 1.9% from 2% last month and has been stable in recent months.
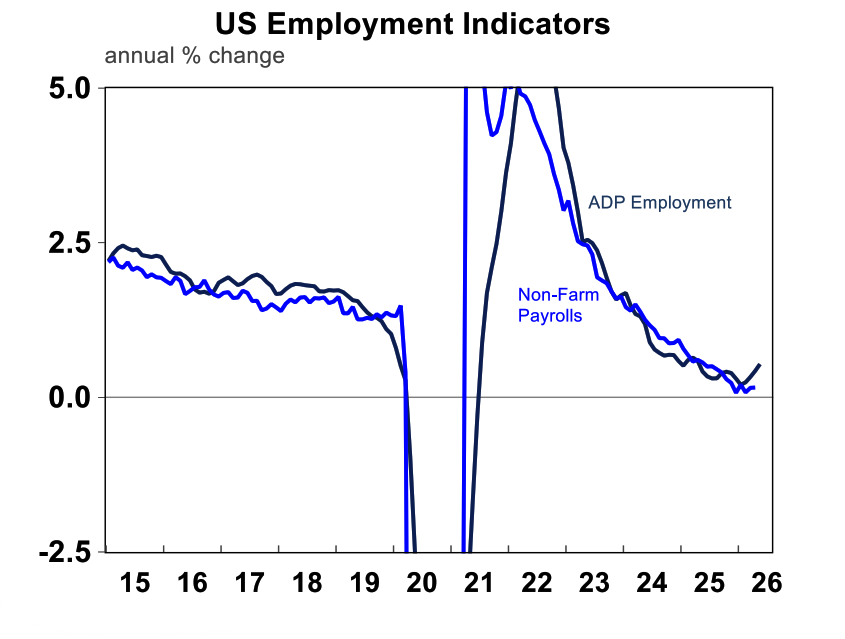
Additionally, ADP employment, a good leading indicator for the official non-farm payroll figures rose by 122K in May, indicating a tick-up in hiring.
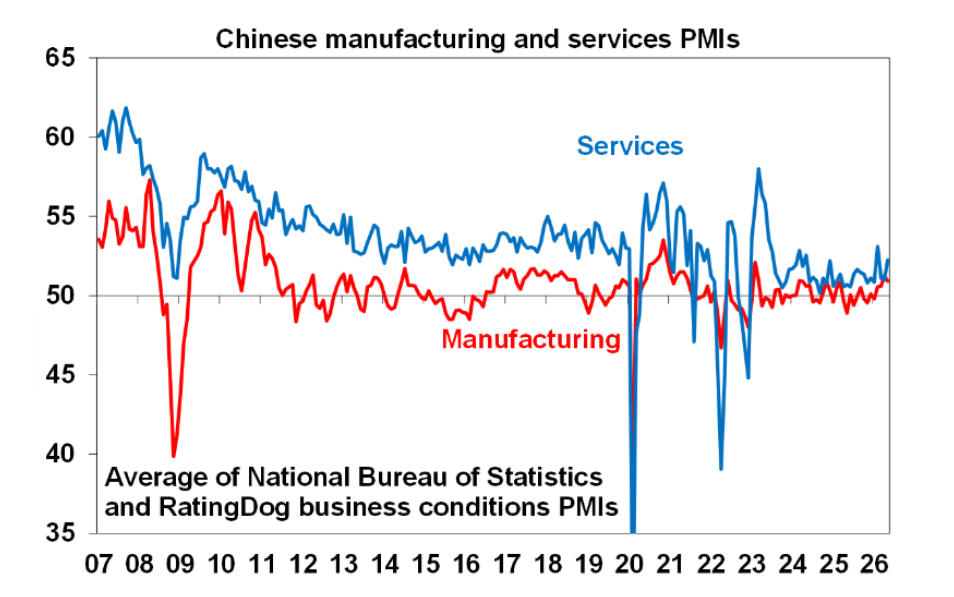
China’s manufacturing index remained in expansion in May (at 51.8) although was lower than last month and services was stronger at 54.4 (from 52.6) – all signs of solid activity.
Australian economic events ad implications
Data deluge in Australia this week. Does the ABS love to torture economists? Overall, activity is mixed with some pockets doing well and others more modest. Nothing was particularly bad, which is good news.
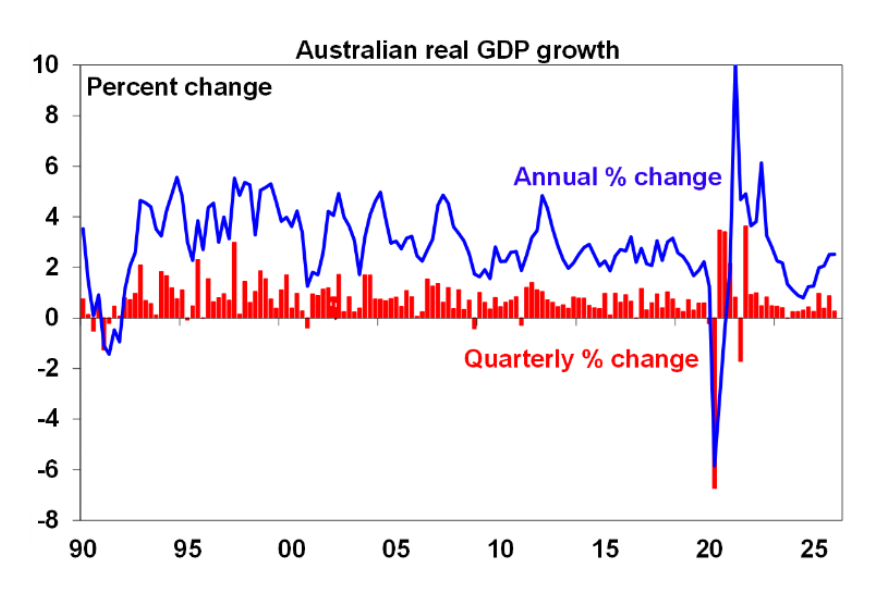
March quarter GDP rose by 0.3% over the quarter, which is a step down from December’s 0.9% but annual growth was solid at 2.5%, and there were some upward revisions to history (which means historical growth looks better now). Consumer spending held up due to more essential spending on electricity (as rebates ended), food (from stockpiling in cyclone areas) and fuel hoarding, while discretionary spending was soft although I wonder if when electricity spending normalises next quarter, discretionary will be better. Residential construction rose marginally from new home building. Business investment rose strongly from data centre investment, although part of this impact is negated by the rise in imports, which weighs on GDP. Exports fell from poor domestic weather and some softer international demand. Inventories were flat and government spending also moderated.
Across the industries, there was a drop in mining production from poor weather which also hit the transport sector. Data centre activity boosted the tech sector which also helped professional services. Manufacturing, construction and wholesale trade all rose.
The problem is that per person, GDP has flat-lined since 2023 (see chart below) which lines up this general economic malaise that consumers feel. For those that have watched the Disney movie “Inside Out 2” I relate it to the character of Ennui. The March quarter data showed a further decline in productivity growth which is also bad news for living standards.
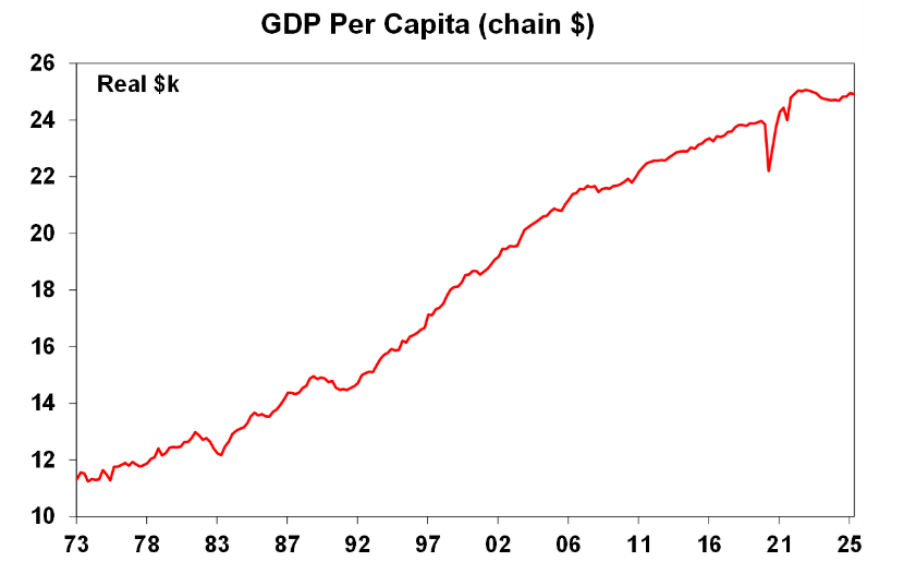
The issue is that GDP growth is going to look pretty soft over the next few quarters from rate hike & higher energy prices. We expect growth to slow to 1.5% by the end of the year. There is still a low chance of an outright “recession” but low growth and elevated inflation has whiffs of “stagflation”.
Alongside the GDP release the ABS looked at wastewater usage to analyse the illegal tobacco consumption in Australia. The ABS do a fantastic job at updating Australia’s statistics but I personally would have preferred the analytics time spent on looking at illegal tobacco instead to be focussed on economic releases that have an important impact on policy and living standards like the household expenditure survey or housing occupancy and costs (which are no longer released in a timely manner due to budget constraints). Why I don’t think looking at illegal tobacco matters so much is because its less than 2% of consumer spending. Even if we accounted properly for illegal consumption, most of that is imported so its impact would be negated from a GDP perspective. So, it doesn’t matter for economic policy. We also knew that more tobacco spending was coming from illegal sources as government revenue from tobacco sales have fallen by 75% in 5 years.
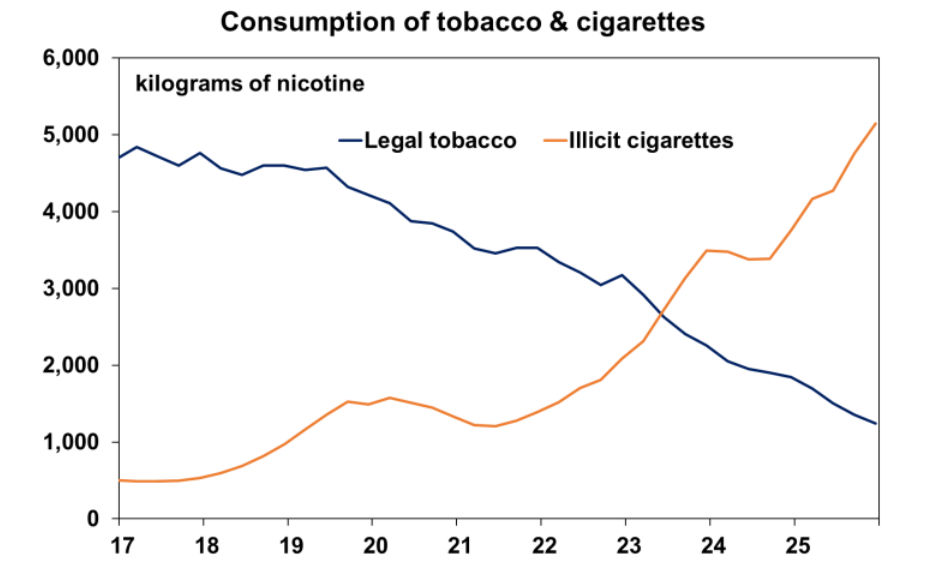
The ABS estimate that there has been a staggering 40% increase in nicotine consumption since 2017 (the population only grew up 14% over that time!) so people are smoking much more. This is all due to illegal cigarettes which account for 80% of the market. I didn’t realise people were still smoking this much…. Apparently illegal tobacco prices have been flat for a decade versus 12% average annual inflation for legal tobacco.
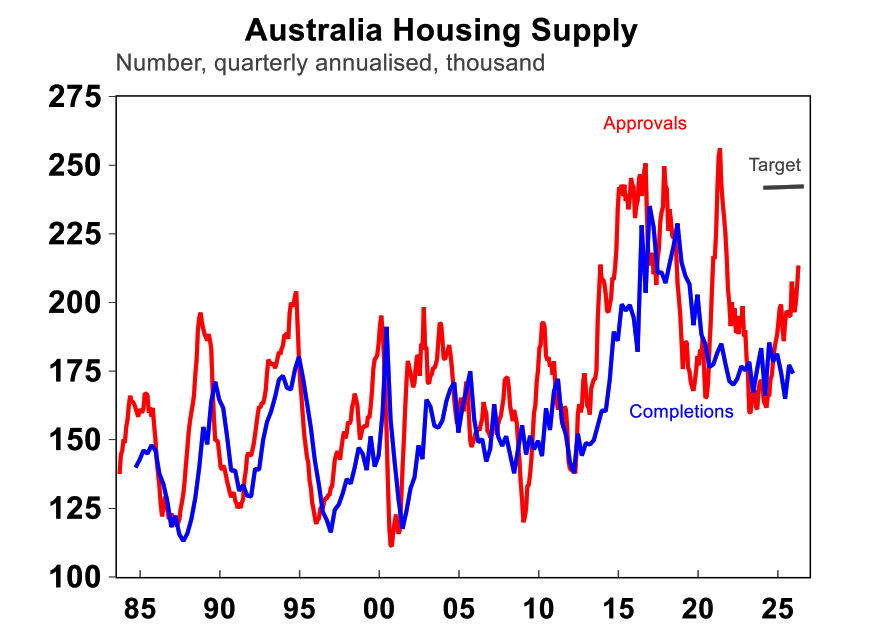
Building approvals fell by 3.4% in April which doesn’t help our housing supply goals.
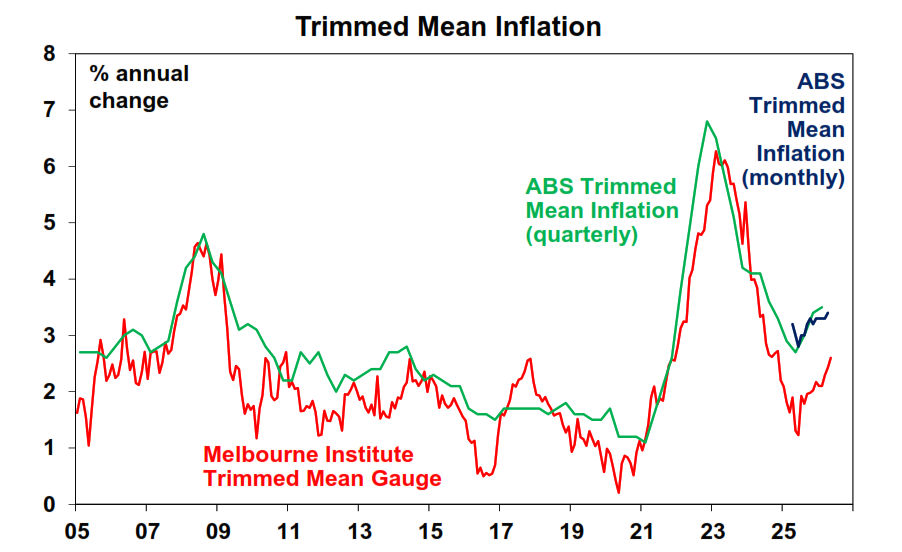
Australian Melbourne Institute inflation expectations fell over the month and annual is up by 4.4% and the trimmed mean trended up – all signs of inflation remaining elevated.
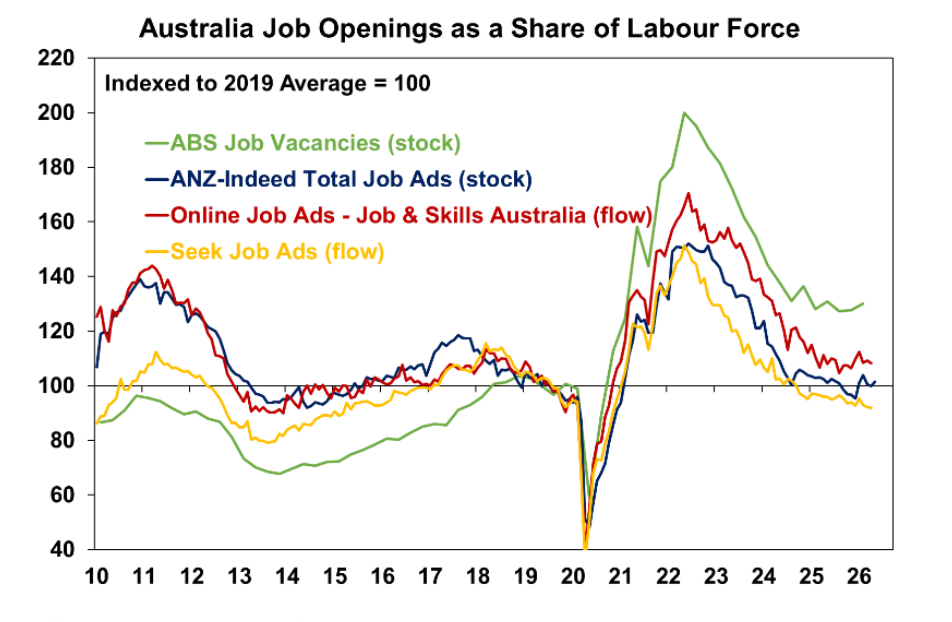
ANZ job ads were up in May and have been flat as a share of the labour force in recent months which is consistent with “low firing, low hiring”.
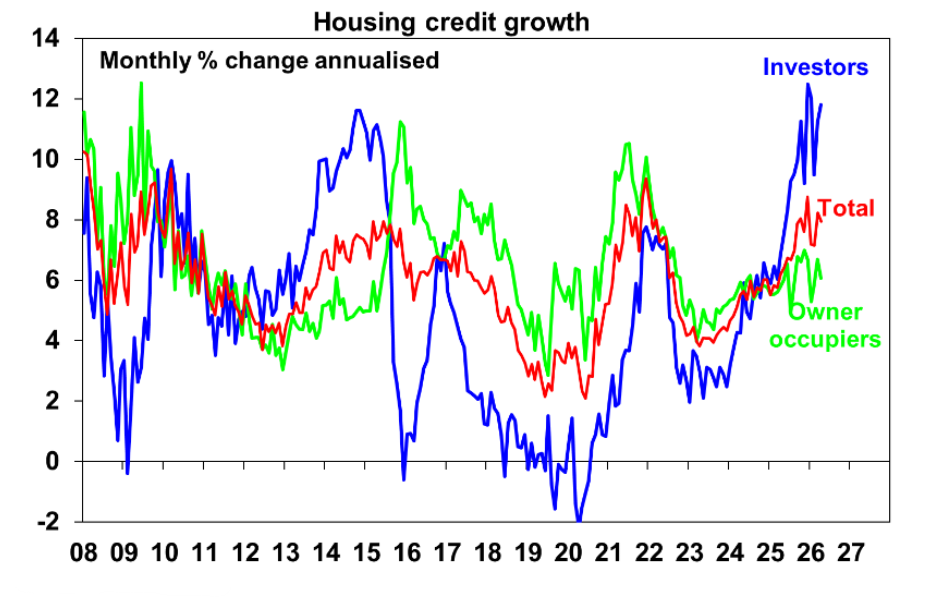
Private sector credit rose by 0.7% in April and was up by a strong 8% over the year. Investor credit has been particularly solid but is likely to slow from the budget changes to taxes related to housing. Business credit growth has also been rising strongly.
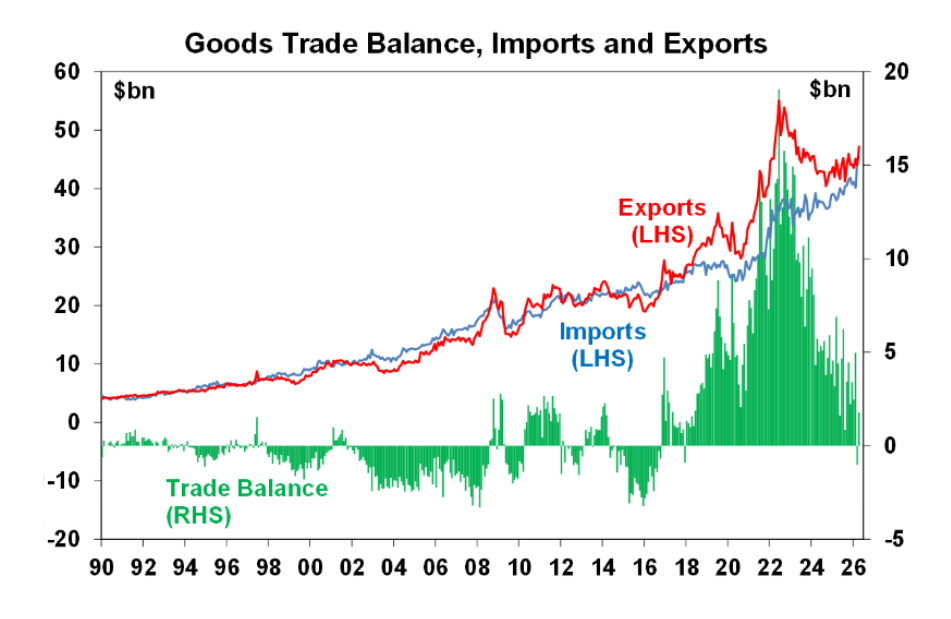
The April trade balance went back into surplus of $1.8bn, from $1bn last month driven by higher exports for iron ore and coal. Imports rose due to higher prices for diesel and aviation fuel and there was a fall in computer equipment (partly offsetting the huge rise in data centre investment in the March quarter).
RBA external board member Ian Harper gave his first public speech on “Economic Conditions and the Outlook”. He sounded hawkish noting that “long-term inflation, for the first time in a long while, looks like it is expected to be higher than it has been”. The RBA sounds concerned that long-term inflation expectations had already been trending higher in Australia and the lift in energy and related products gives it another leg up. I bet he was not one of the dissenters to the recent rate hikes.
Michelle Bullock and RBA officials didn’t say anything too extreme in their appearance before the Senate Economics Legislation Committee (Budget Estimates 2026-27) hearing. The RBA staff were still working through the impacts of the budget, they see investor demand being impacted more by tax changes, so far federal and state budgets are more or less in line with their forecasts, noting that some state budgets still need to be released.
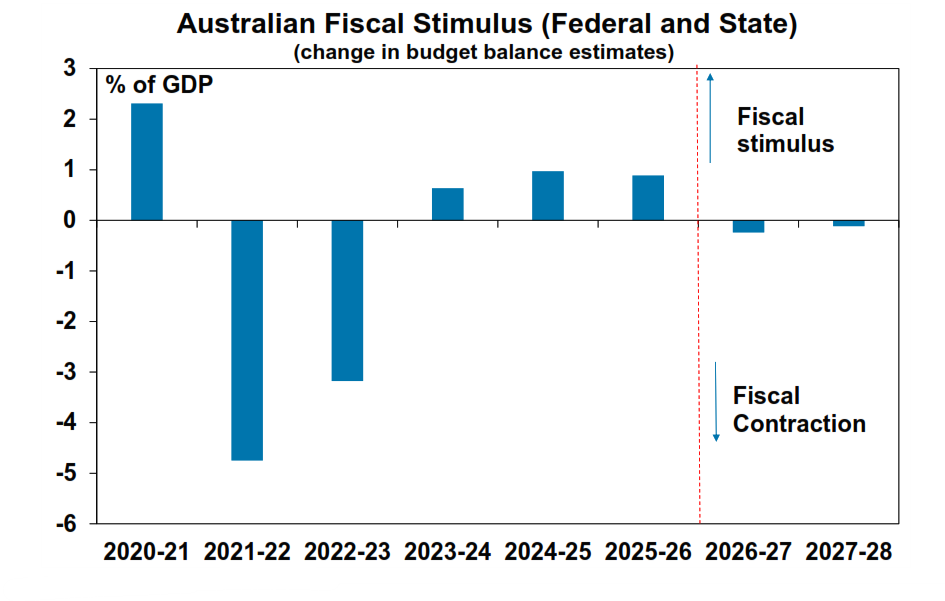
South Australia released its budget this week which is expected to be a surplus of $223mn in 2026-27 with surpluses over the next four years. But there steep increases to net debt into 2029-30 from investment, including on a new Women’s and Children’s Hospital that has had large cost blow-outs. This doesn’t change our estimate that total government spending (both federal and state) has peaked as a share of GDP and this means that total government spending will move into “contraction” after years of stimulus.
What to watch over the next week?
Australian confidence readings for business (NAB) and consumer (Westpac/Melbourne Institute) will show any additional post-Budget impact but its hard to see the readings being positive! RBA Deputy Governor Hauser speaks later this afternoon.
US May consumer price reading ahead of the Fed’s June meeting is expected to show a rise of 0.5% in the month or 4.2% over the year with core at 2.9%. This should argue for the Fed to be on hold at Warsh’s first meeting as Chair later in June. Other data includes producer prices, initial jobless claims, small business optimism, University of Michigan consumer sentiment. Tonight there is non-farm payrolls which is expected to rise by 89K and the unemployment rate to remain flat at 4.3%. And of course we keep waiting to see what news Trump has for us on the Middle East.
On the central bank front, The Bank of Canada meet and a hold is expected at 2.25% with the latest GDP data showing Canada in a mild recession. In contrast, the European Central Bank is likely to hike by 25 basis points from 2% to 2.25%.
In China, May consumer and producer prices show should modest growth, although not in deflation anymore.
Outlook for investment markets
Global and Australian share markets have likely seen the worst from the War and oil shock if the flow of oil quickly resumes but the risk of further falls taking us to a 15% top to bottom correction remains high given uncertainty around the flow of ships through the Strait along with still stretched valuations, political uncertainty associated with Trump & the midterm elections and worries about private credit and the impact of AI. However, returns should still be positive for the year as a whole thanks to Trump still likely to pivot to consumer-friendly policies and solid profit growth.
Bonds are likely to provide returns below running yield this year.
Unlisted commercial property returns are likely to be solid helped by strong demand for industrial property associated with data centres.
Australian home price growth this year is likely to slow to around flat with prices likely to fall over the year ahead due to poor affordability, RBA rate hikes, reduced investor demand flowing from the winding back of negative gearing and the capital gains tax discount and the hit to confidence from the War.
Cash and bank deposits are expected to provide returns around 4.25%.
The $A is likely to rise as the interest rate differential in favour of Australia widens. Fair value for the $A is around $US0.72.
Diana Mousina
Deputy Chief Economist, AMP
You may also like
-

Olivers Insights - House prices Home price cycle turning down - Cotality data shows national average home prices were flat in May, with capital city prices down 0.1%, their second monthly fall in a row. -

Weekly Market Update - 29-05-2026 - AMP The week started on an optimistic note with Trump saying last weekend that “final aspects and details of the Deal are currently being discussed and will be announced shortly”. But this was followed by more military strikes on Iran and Trump saying he is “not satisfied” – so oil prices rebounded. But the indications are now that a tentative deal has been reached, pending Trump’s sign-off. -

Olivers Insights - Three reasons why it pays to be an optimist as an investor I have observed that not the man who hopes when others despair, but the man who despairs when others hope, is admired by a large class of persons as a sage.
Important information
Any advice and information is provided by AWM Services Pty Ltd ABN 15 139 353 496, AFSL No. 366121 (AWM Services) and is general in nature. It hasn’t taken your financial or personal circumstances into account. Taxation issues are complex. You should seek professional advice before deciding to act on any information in this article.
It’s important to consider your particular circumstances and read the relevant Product Disclosure Statement, Target Market Determination or Terms and Conditions, available from AMP at amp.com.au, or by calling 131 267, before deciding what’s right for you. The super coaching session is a super health check and is provided by AWM Services and is general advice only. It does not consider your personal circumstances.
You can read our Financial Services Guide online for information about our services, including the fees and other benefits that AMP companies and their representatives may receive in relation to products and services provided to you. You can also ask us for a hardcopy. All information on this website is subject to change without notice. AWM Services is part of the AMP group.