





Weekly market update
Investment markets and key developments
The Australian share market also fell 1% with the hit from rising oil prices and bond yields compounded by falling home prices adding to concerns about the economic outlook at the same time that GDP growth was still strong enough to reinforce expectations that the RBA is on track to raise rates again with some now forecasting two more rate hikes (versus none two weeks ago!).
10 min read

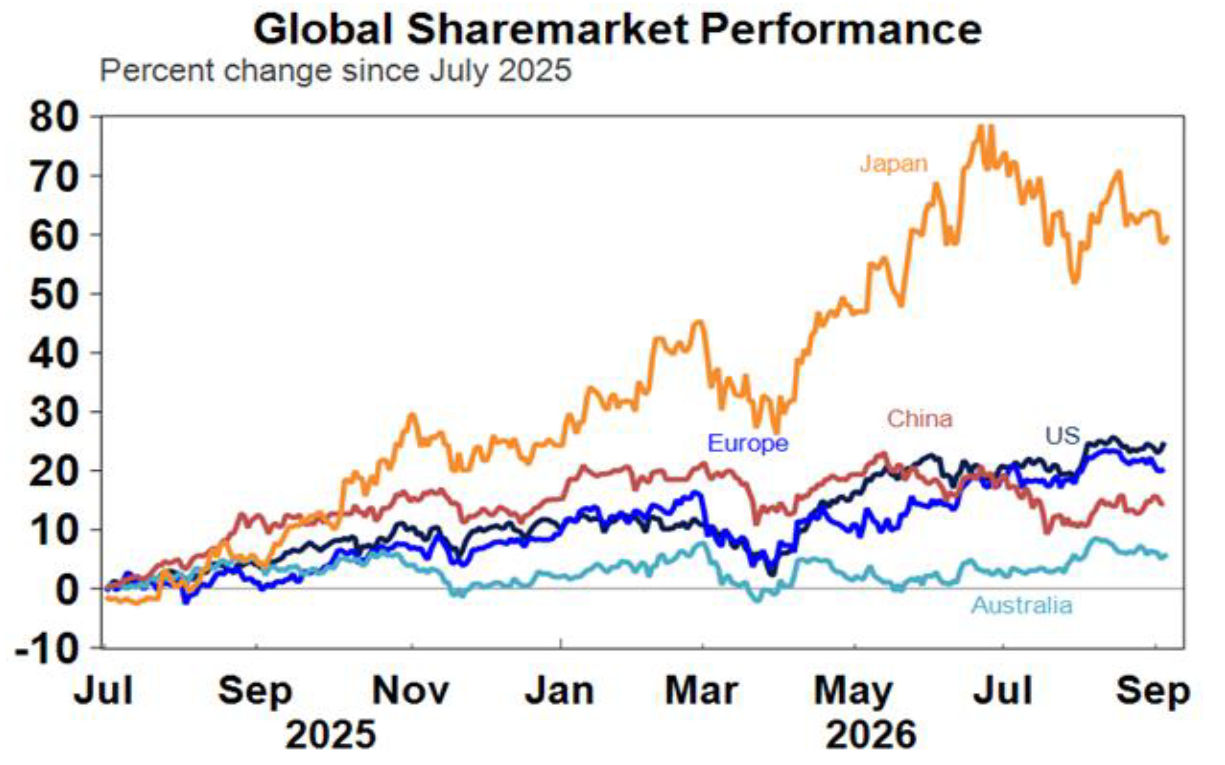
Global share markets were mixed over the last week not helped by worries about rising oil prices and rising bond yields. US shares managed a small rise though as relatively dovish comments by Fed officials Williams and Waller implied that a September rate hike is not a dead cert, although this was offset by strong jobs data on Friday leaving US shares up just 0.1% for the week. August inflation data in the week ahead will be key for the Fed. Meanwhile, Eurozone shares fell 1.4%, Japanese shares fell 2.1% and Chinese shares fell 1.3%. The Australian share market also fell 1% with the hit from rising oil prices and bond yields compounded by falling home prices adding to concerns about the economic outlook at the same time that GDP growth was still strong enough to reinforce expectations that the RBA is on track to raise rates again with some now forecasting two more rate hikes (versus none two weeks ago!). Banks and financials rose on the ASX but were offset by falls in IT, mining and retail shares.
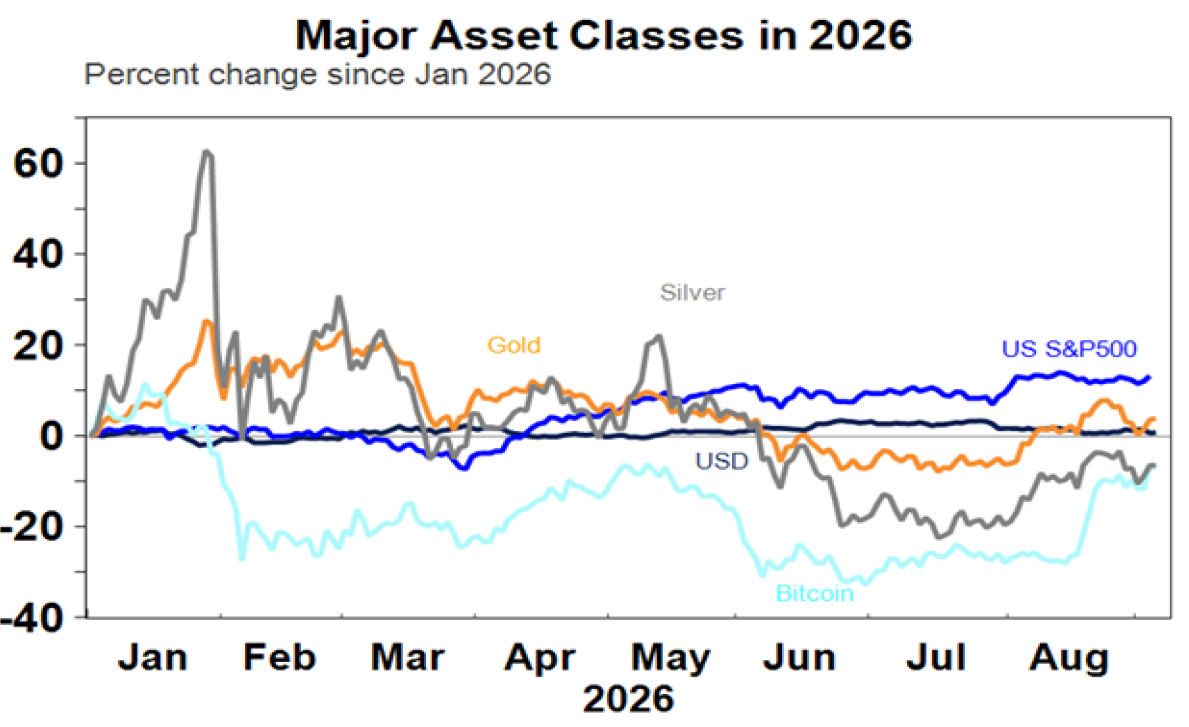
Bitcoin and gold both got a boost from the more dovish Fed comments which saw the $US fall, but their bounce was reduced on Friday after US jobs data with Bitcoin up for the week but gold ending down. Metal and iron ore prices also rose and the $A rose above $US0.72 for the first time since May.
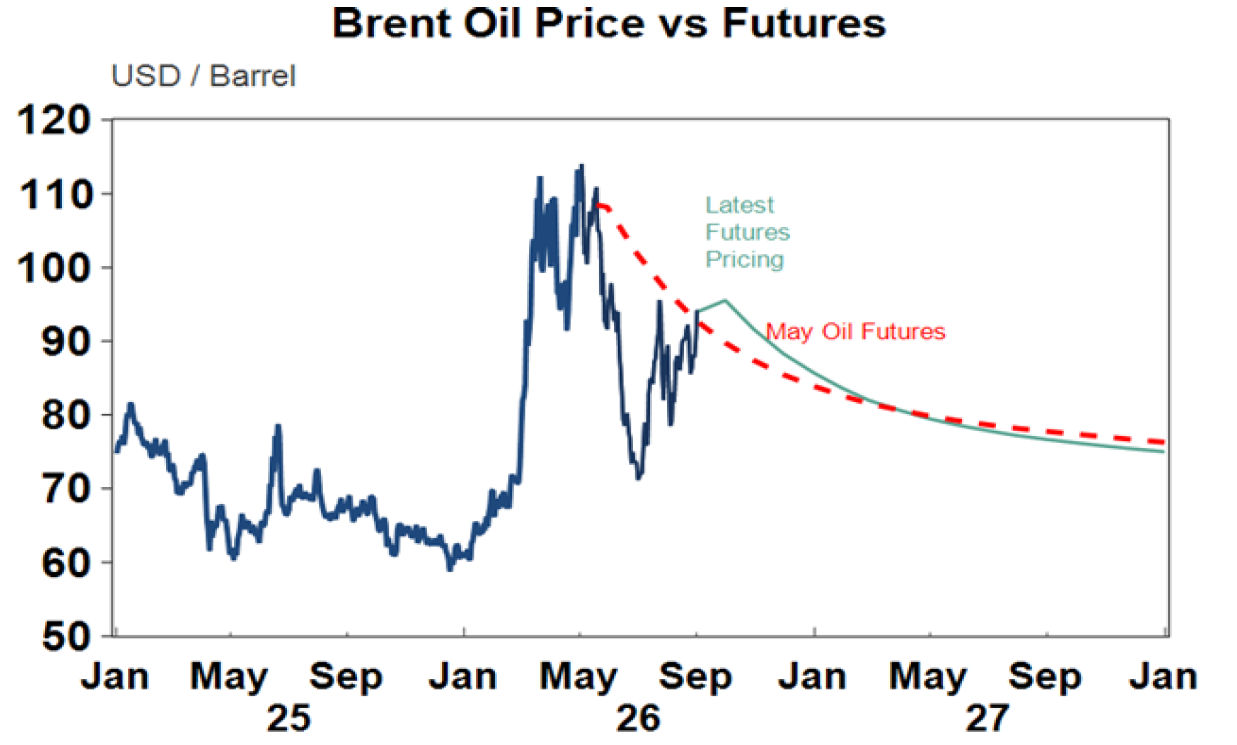
Oil prices rose again with renewed military activity between the US and Iran. The renewed focus on sanctions by the US to pressure Iran had seen oil prices dip but the past week saw a return to US strikes after Iranian attacks on ships with Iran retaliating. Naturally Trump said the strikes would be short lived and he will no doubt soon proclaim something like “Iran wants to talk” or that the “war is over”. But the conflict remains as messy as ever with only bad options – return to full on war (which will go down very badly in the US and in any case its running low on key munitions) or agree a bad deal/just walk away (giving Iran what it wants). The bottom line is that nothing has been achieved by the War except the Iranian government is now more hardline and the Strait of Hormuz remains effectively closed with ships only getting through if they pay Iran or get military support from the US. Our base case remains that oil prices will stay in a $US70-100/barrel range with Iran preventing it going lower and the US moving to try and calm things down whenever it gets above $US100….but the risk is high that with no resolution the world will face much higher oil prices as reserves run down.
The past week saw the back up in bond yields continue taking the Australian 10-year bond yield to levels last seen in 2011. The rise reflects a combination of concerns about huge ongoing budget deficits in the US and elsewhere, increased corporate borrowing to fund data centre investment, worries about higher for longer inflation partly flowing from higher oil prices, a related need for central banks to run higher interest rates for longer and a rising trend in Japanese bond yields leading to a reversal of the so-called carry trade. US Treasury Secretary Bessent’s silly intervention was a sign of desperation and taken that way by bond investors as it had no fundamental backing – like concrete moves to cut the massive US budget deficit which is running around 6-7% of US GDP versus 1% of GDP in Australia. And President Trump’s latest illogical call for the Fed to cut rates adds to the pressure for the Fed to hike to prove its independence or risk a further rise in the risk premium in US bond yields. Were it not for his tariffs and War the Fed may have cut long ago and stopping trade with countries that the US has a trade deficit with as Trump is threatening will just add more to US inflation. It seems like the “bond vigilantes” are back after years of hiding in their caves and so political leaders need to be careful. Higher bond yields are the sort of thing you would expect to see in a world of higher inflation and higher public debt. Since US bond yields are the base for global yields their rise has flown through to Australian bond yields with the add on of increased expectations for the RBA’s cash rate on the back of high inflation data. The risk is high that yields will rise further as it’s hard to see the key drivers of higher yields going away any time soon. It wouldn’t be surprising to see the Australian 10-year bond yield push up to around 5.5%.
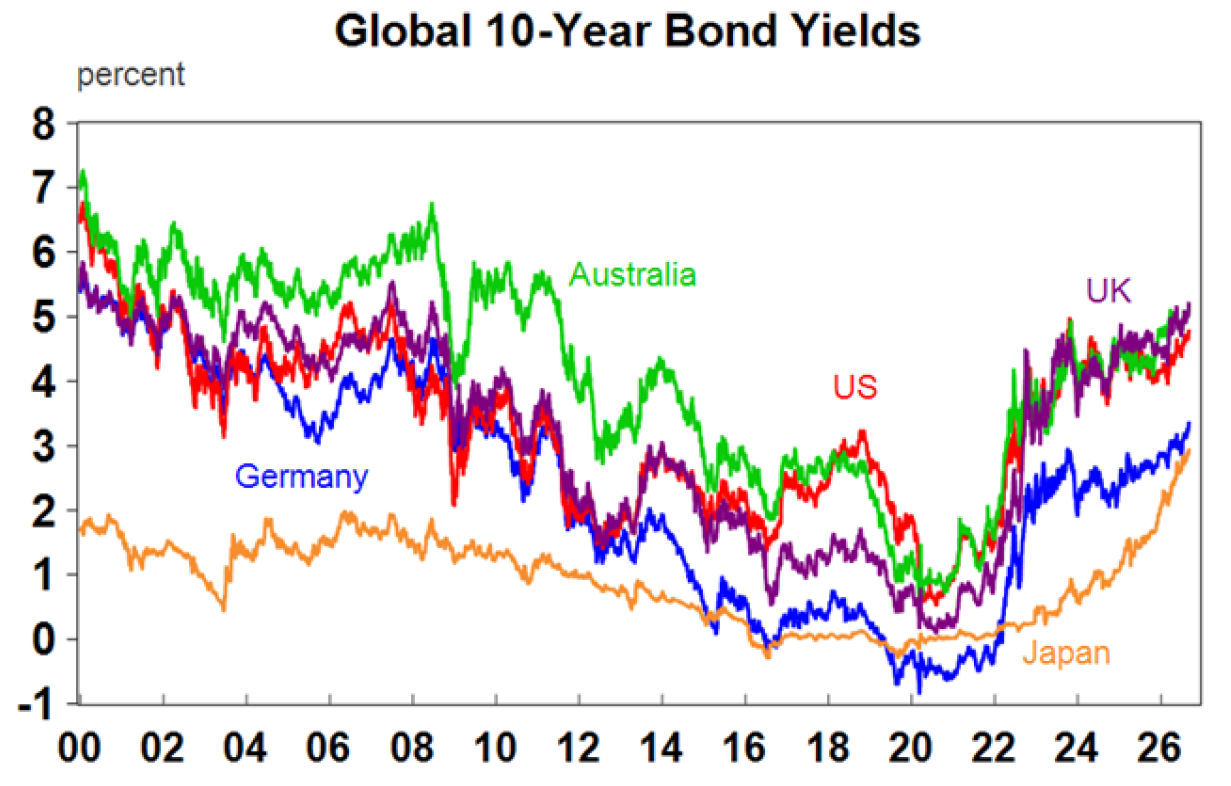
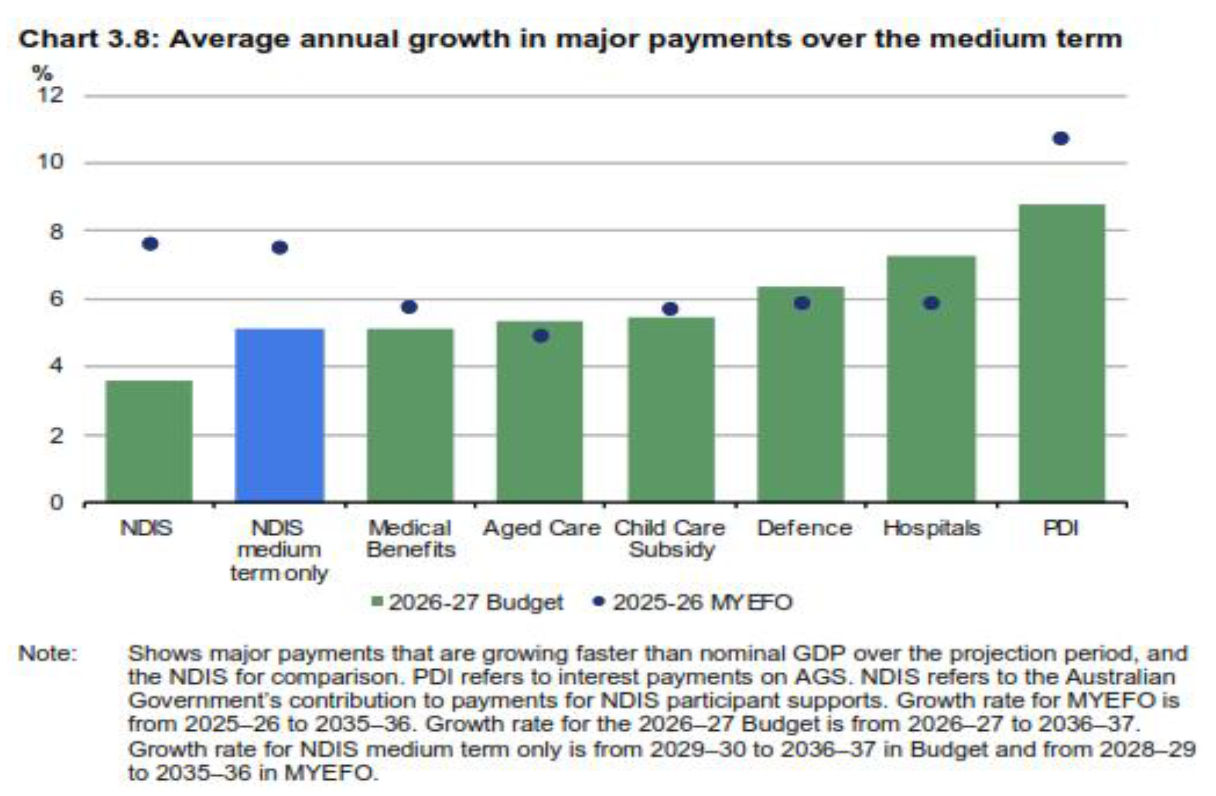
The rise in bond yields has a number of implications for Australia. First its bad news for the Federal and state governments as it means public debt interest costs will rise even faster at a time for the states when their stamp duty revenue is going the other way. Public debt interest is the fastest growing major spending item in the Federal Budget currently accounting for around 5% of tax revenue but set to rise further. The more bond yields rise the faster the public debt interest bill will rise and the more tax revenue it will take up leaving less left over for welfare payments and other government spending. Second it means higher corporate borrowing costs which can act as a dampener on company profit growth. Thirdly, it means that banks are likely to raise their fixed mortgage rates which will reduce the attractiveness of fixed rate mortgages as an alternative to variable rate mortgages at a time when the latter are likely to rise further with RBA rate hikes. Finally, it could pressure the share market as the risk premium offered by shares over bonds was already very low.
In Australia falling home prices and cooling growth, but materialising upside inflation risks are providing a difficult choice for the RBA - but we expect it will prioritise dealing with inflation and hike rates again. Data over the last week showed a slowing in economic growth and an accelerating slump in property prices which - via wealth effects, a flow on to home building and housing related retail sales - will further weaken economic growth. Against this though growth is still running a little bit stronger than the RBA was expecting and wants to see to reduce excess demand and so far, property prices have just had a flick of the top with a fall of 3.6% nationally after a 50% rise since the pandemic. And in the meantime, July inflation data suggests that upside risks to the RBA’s inflation forecasts are materialising. This presents a real dilemma for the RBA but given that inflation is the more pressing problem and if left unchecked risks a bout of stagflation, which will come with more costs to the economy and all Australians than a recession, the RBA is likely to focus on inflation and hike rates again. This is also necessary to reinforce the credibility of its inflation target which at present is weakening. We have been of the view that the RBA will wait till the November meeting just to make sure that the high July inflation data is not an aberration, but a further delay risks damaging their credibility so there is a strong argument to move in September. At this stage we think its 50/50 as to whether its September or November, but either way we expect another hike. This is likely to be the top as two hikes risk tipping many households with a mortgage over the edge risking in turn a crash in property prices, much higher unemployment and a deep recession. That said, the money market sees a 63% chance of a hike this month, has fully priced a hike by November and puts about a 50% probability on a second hike.
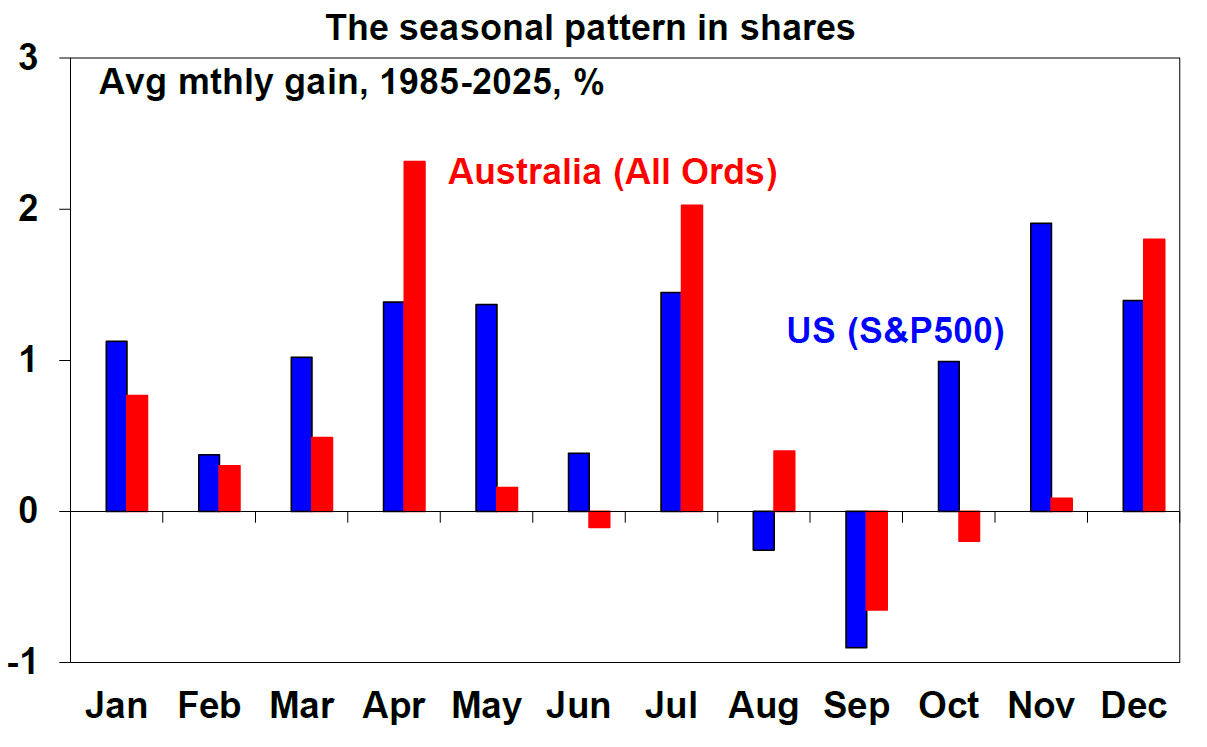
The risk of a correction in shares remains high. Strong gains year to date have left US and global shares vulnerable as we enter September which has on average been the weakest month of the year for US and Australian shares over the last 40 years. A correction in the US would likely drag Australian shares down. There are plenty of triggers for a correction including rising bond yields at a time when equity risk premiums over bonds are low, potential Fed and RBA rate hikes this month, rising oil prices, worries about an AI bubble and political uncertainty ahead of the US midterms. But with strong earnings growth we would see any pullback as a correction rather than the start of a new bear market.
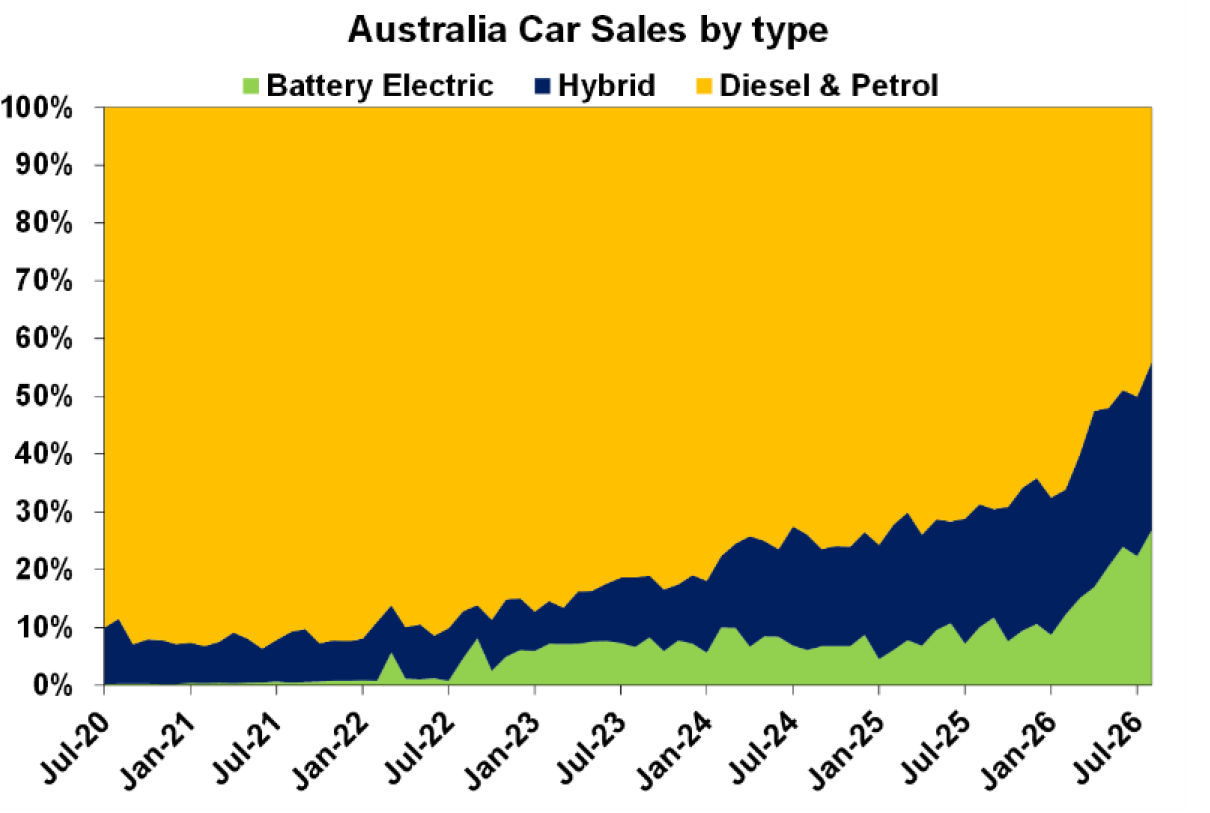
Meanwhile, the boom in sales of electric vehicles continues in Australia. In August EVs were 25% of new car sales from close to nothing six years ago. With hybrids they now make up 54% of new car sales. Its likely they have now reached a tipping point with prices collapsing, ranges getting longer, charge times heading to 10 minutes and fast chargers becoming increasingly ubiquitous. A bit like when cars replaced the horse and buggy – first a trickle then a flood and they are everywhere. And unlike in past oil price shocks this time drivers have an alternative! As with Dylan in 1965 once you go electric you probably won’t go back.
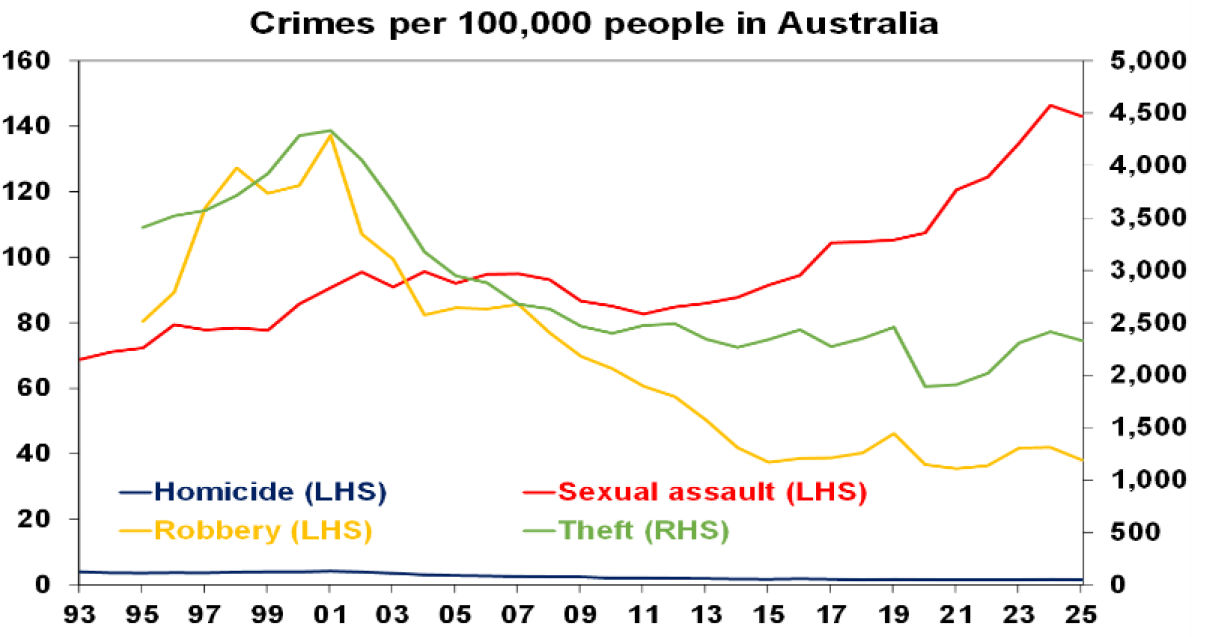
The latest ABS data on crime shows nice long-term falling trends in crime rates for homicide, robbery, theft and abduction. But that for sexual assault is in a depressing rising trend. Clearly there is more work to do on this front.
Like only a few other musicians Taylor Swift has an ability to churn out great song after great song! I Knew It, I Knew You is up there with her best. Here it is with August and All Too Well.
Major global economic events and implications
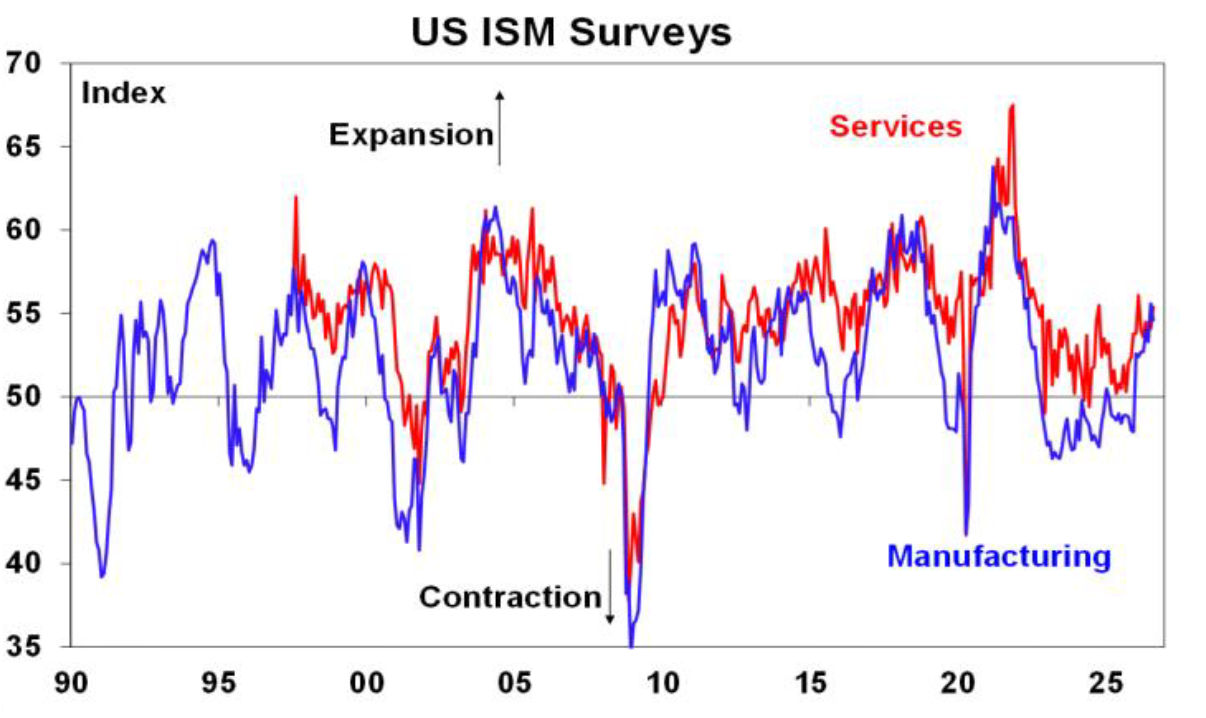
The US manufacturing and services conditions indexes remained solid in August, but with prices paid remaining relatively elevated, highlighting the ongoing risk of persistent above target inflation in the US. At least productivity growth was confirmed at a solid 2.2%yoy for the June quarter, leaving unit labour cost growth at just 1.4%yoy which is no problem for inflation. The trouble of course is that inflation is coming from other sources like tariffs and the flow on from higher energy prices.
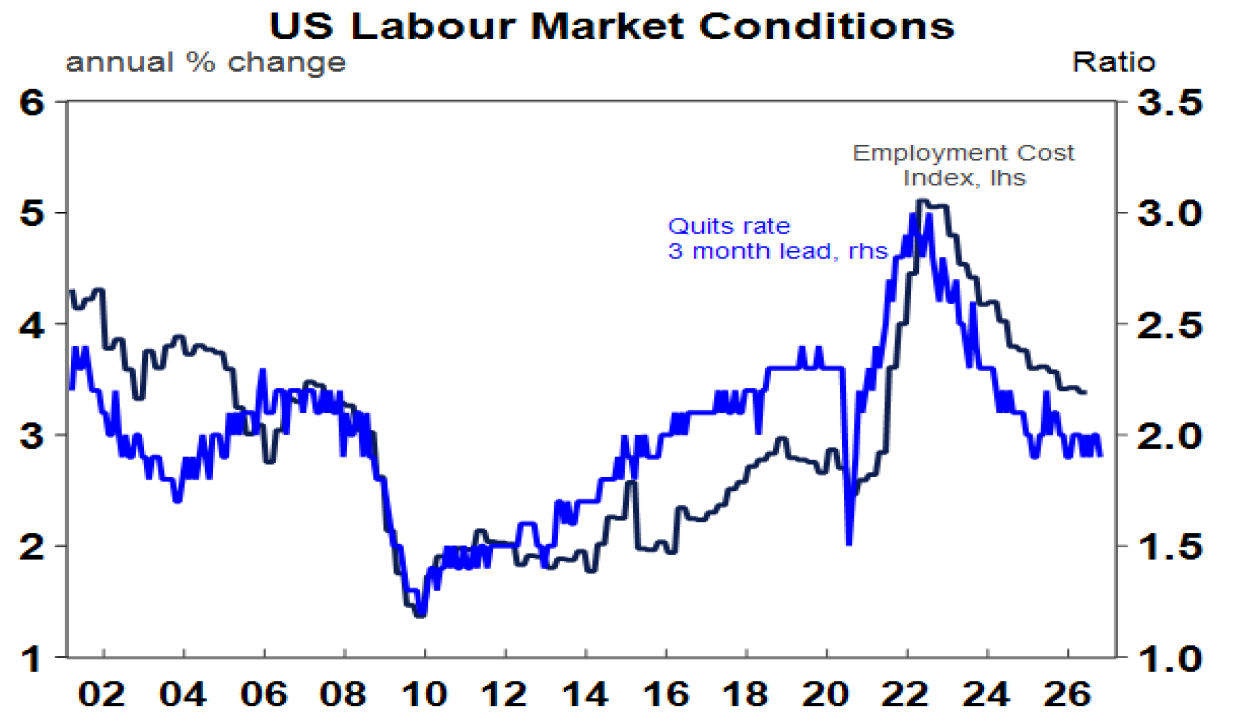
US payrolls data for August and Trump’s call for a rate cut marginally add to the case for a Fed rate hike. Payrolls rose by a much stronger than expected 162,000, prior months were revised up and while unemployment rose marginally this was due to higher participation and the unemployment rate remains low at 4.1%. With the labour market remaining strong it frees up the Fed to focus on getting inflation down. President Trump’s renewed illogical call for the Fed to cut likely also adds to case for a hike in order for the Fed to prove its independence or risk a further rise in bond yields. However, wages growth fell slightly and remains benign and the August CPI data due in the week ahead will be key as to whether the Fed hikes this month. The money market puts the probability of a September hike at 62%. Meanwhile, other labour market data remains consistent with a solid but stable jobs market with job openings and quits rates trending sideways and jobless claims remaining low.
The Bank of Canada left rates on hold at 2.25% but leaned more hawkish noting upsides risks to inflation from higher energy prices. The money market still sees a rate hike coming by year end.
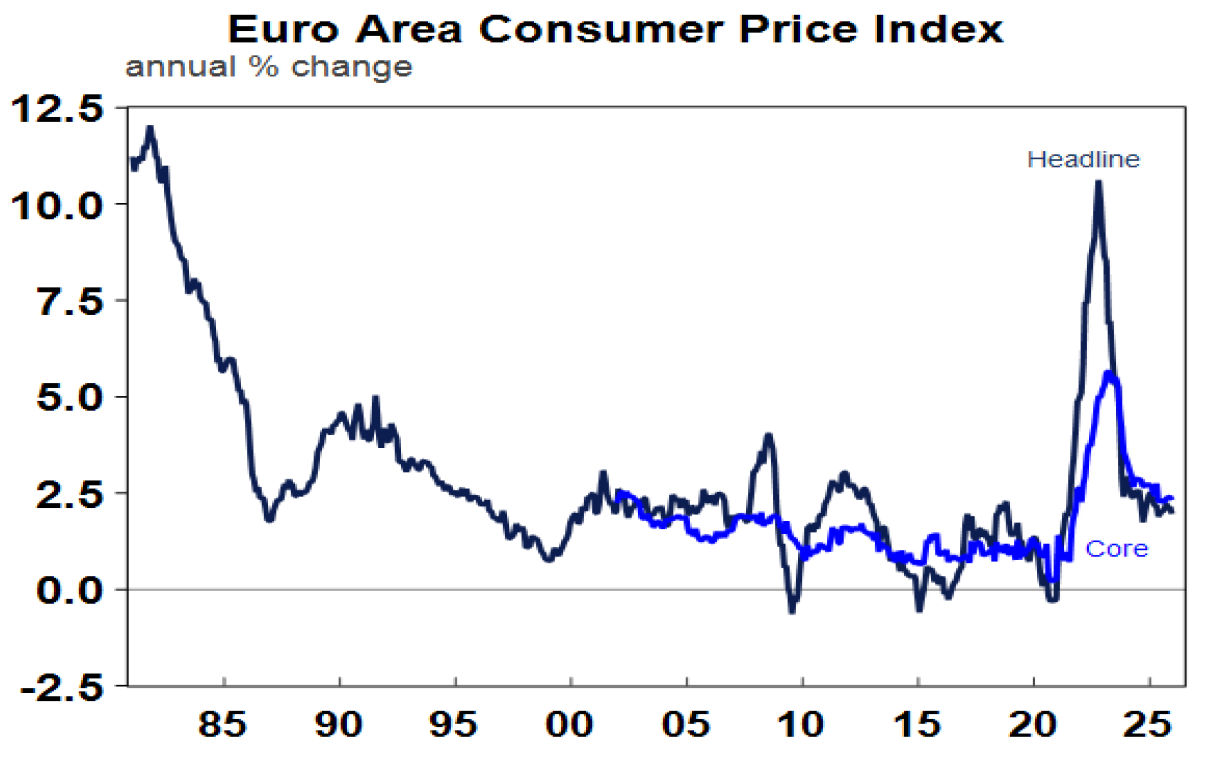
Eurozone CPI inflation rose to 3.3% in August due to higher energy prices, but core inflation fell slightly to 2.4%yoy. This is likely to not enough to head of an ECB rate hike in the week ahead, but it may limit future hikes. Meanwhile unemployment was flat in July at 6.4%.
Japanese industrial production, retail sales, housing starts and consumer confidence all rose more than expected. This along with higher inflation is adding to expectations for more BoJ rate hikes with the money market fully pricing in another hike this month and another one by year end.
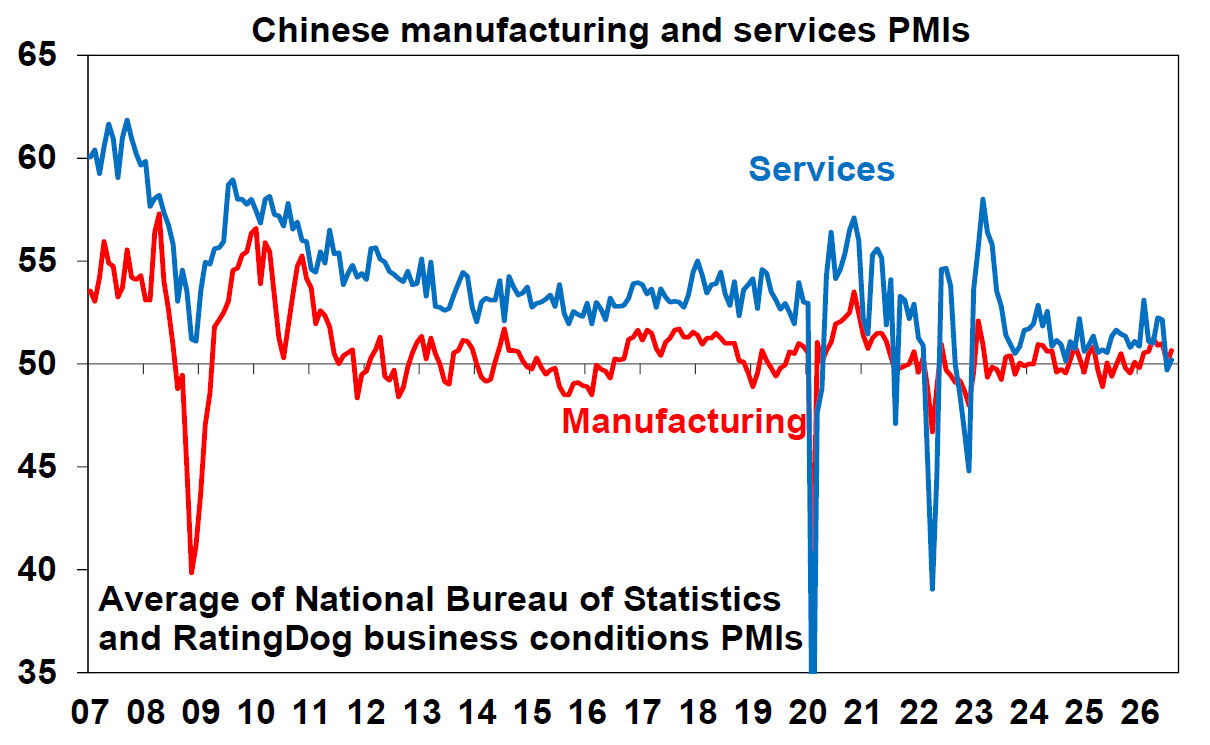
Chinese business conditions PMIs improved slightly in August. They remain in the same range they have been in for the last three years though and are consistent with GDP growth around 4.5-5%yoy.
The Reserve Bank of New Zealand hiked by another 0.25% taking its cash rate to 2.75%. It continues to see monetary policy as easy, inflation too high and growth resilient and so further rate hikes are likely.
Australian economic events and implications
The pace of Australian GDP growth slowed over the last six months compared to the second half of last year.
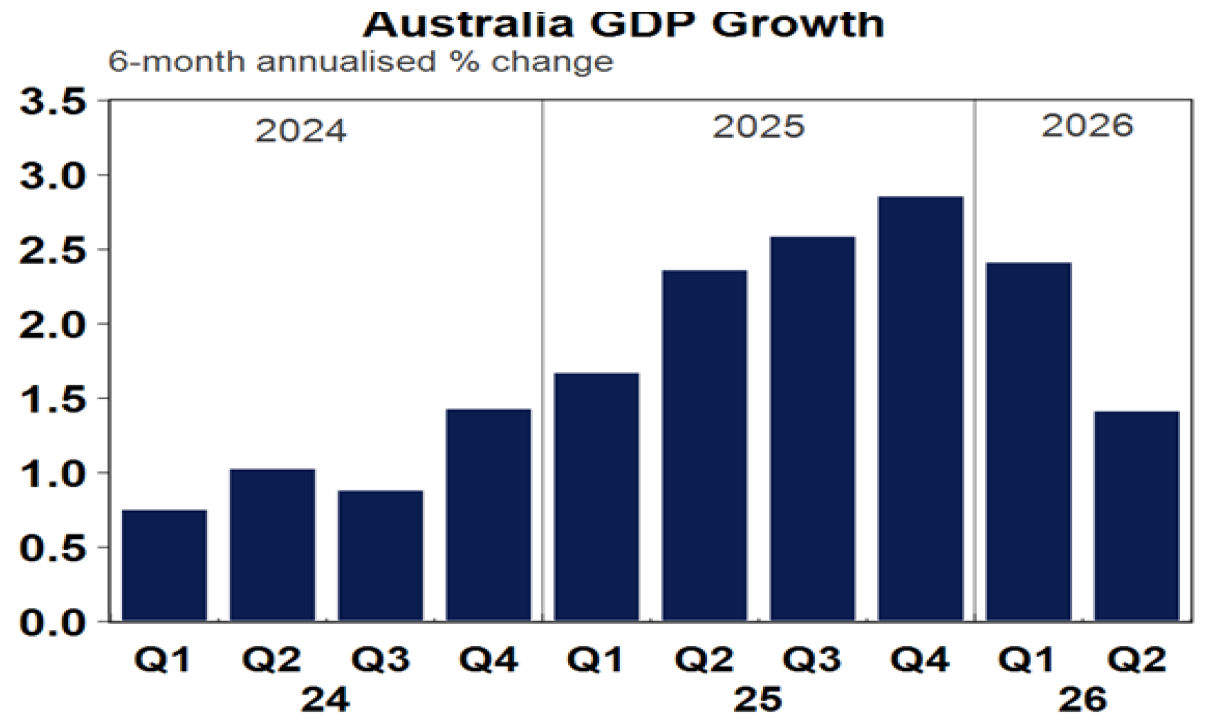
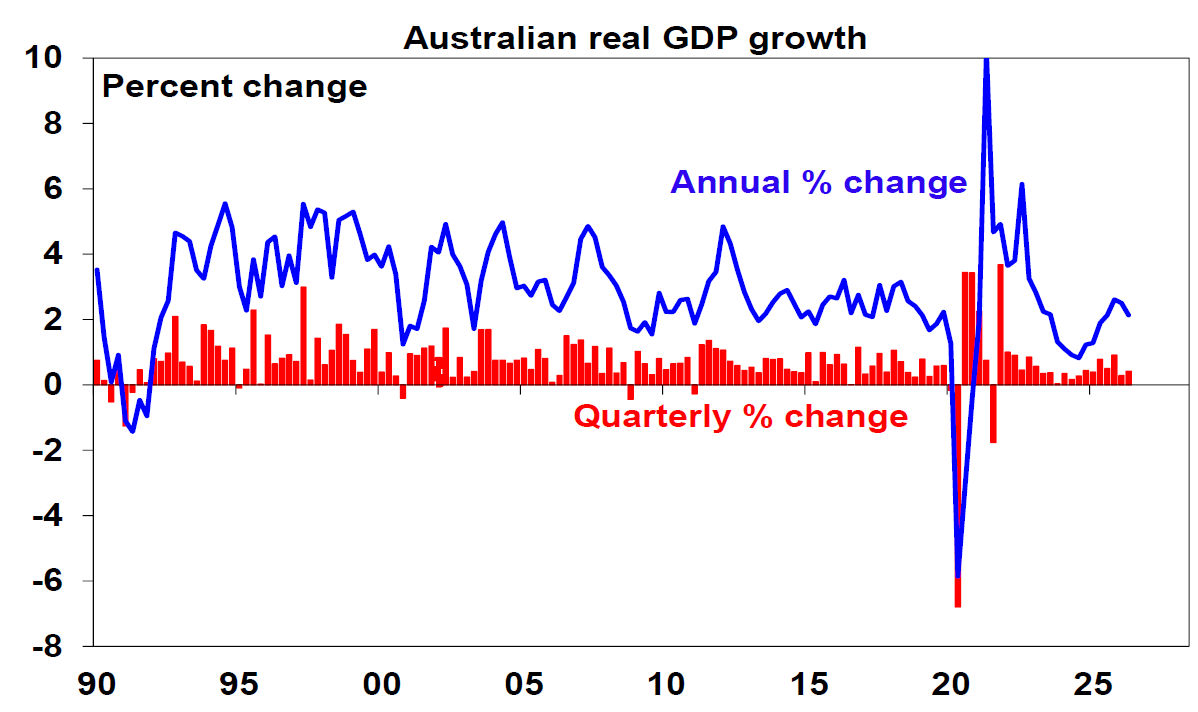
But at 2.1%yoy in the June quarter, its running slightly above the RBA’s implied forecast of 1.9%yoy and a bit above its estimate of potential growth at 2%yoy. June quarter GDP growth was 0.4%qoq which was slightly stronger than the market expected. Smoothing out data centre investment related volatility, overall private demand growth remains strong averaging 0.9%qoq over the last six months which was the same as in the last six months of last year and its up 3.5%yoy.
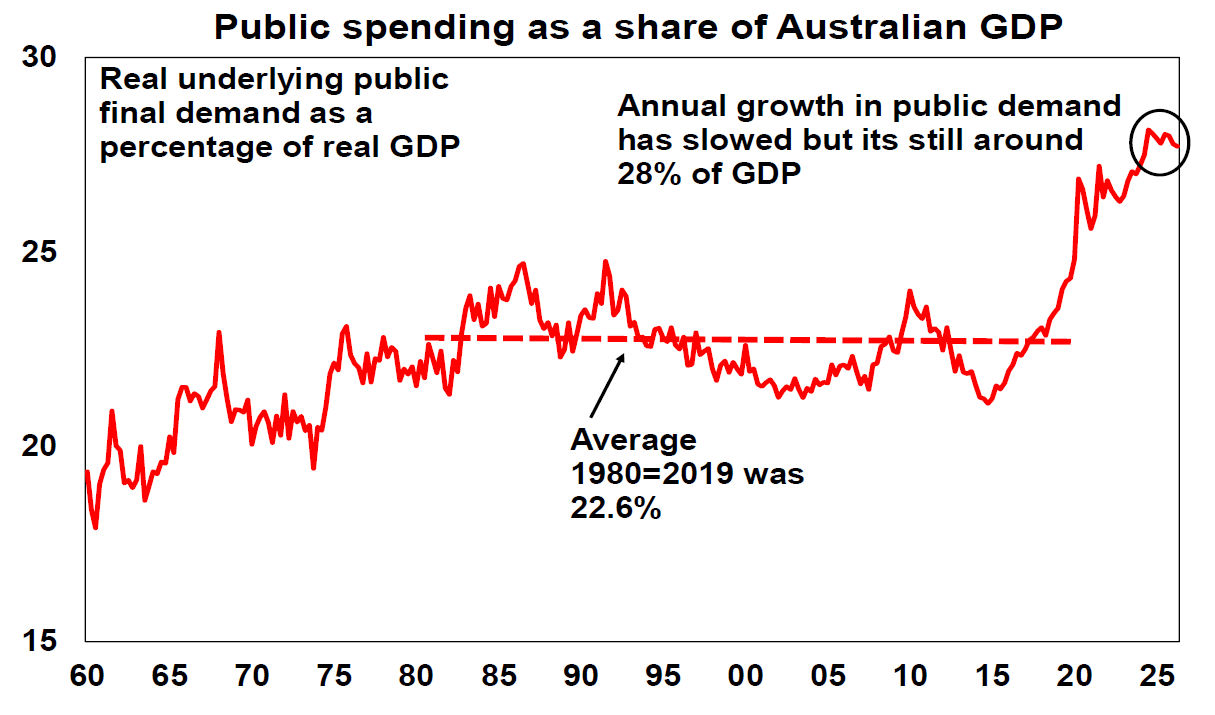
Public spending remains too high. Sure, its slowed to 0.2%qoq or 2.1%yoy but it remains around 28% of GDP compared to a pre covid norm of 22-23%. This high level of public spending is using up spare capacity in the economy, depressing productivity and contributing to the inflation problem! Note that the May Federal Budget still had real Federal spending running at 4.3% through the last financial year – so not much slowdown there!
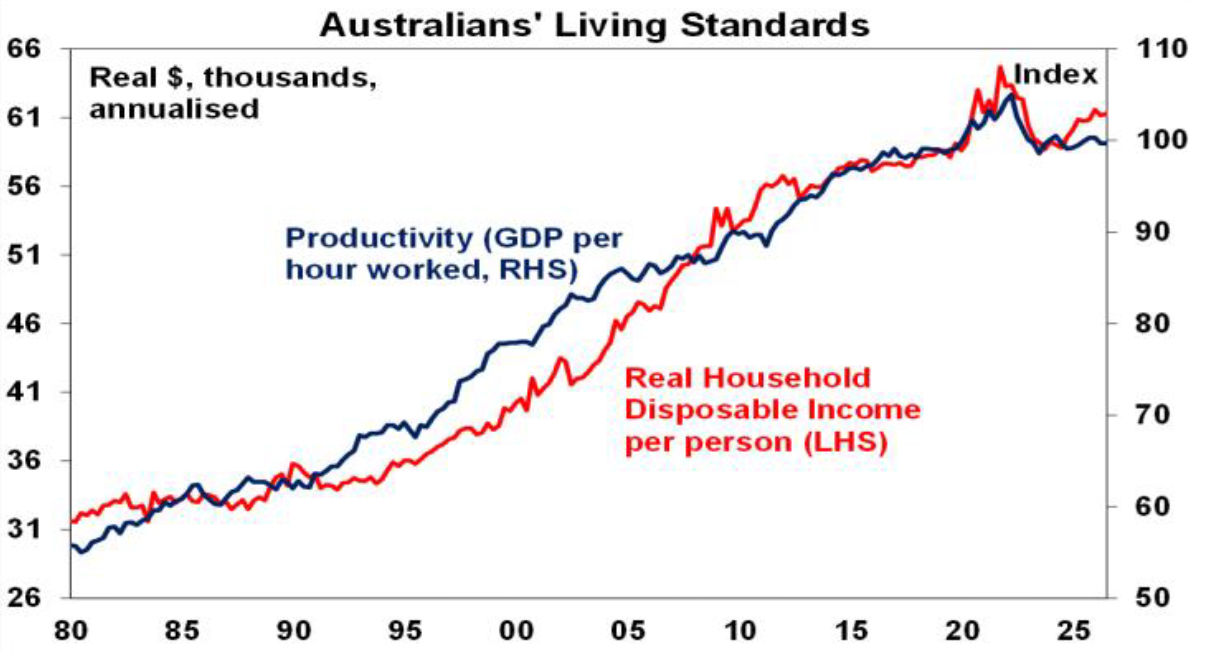
Unfortunately, productivity growth remains abysmal – flat in the June quarter, down 0.2%yoy and near stagnant over the last decade. This in turn is depressing growth in living standards and keeping inflation too high with unit labour costs up 3.6%yoy, well above the 2-3% inflation target.
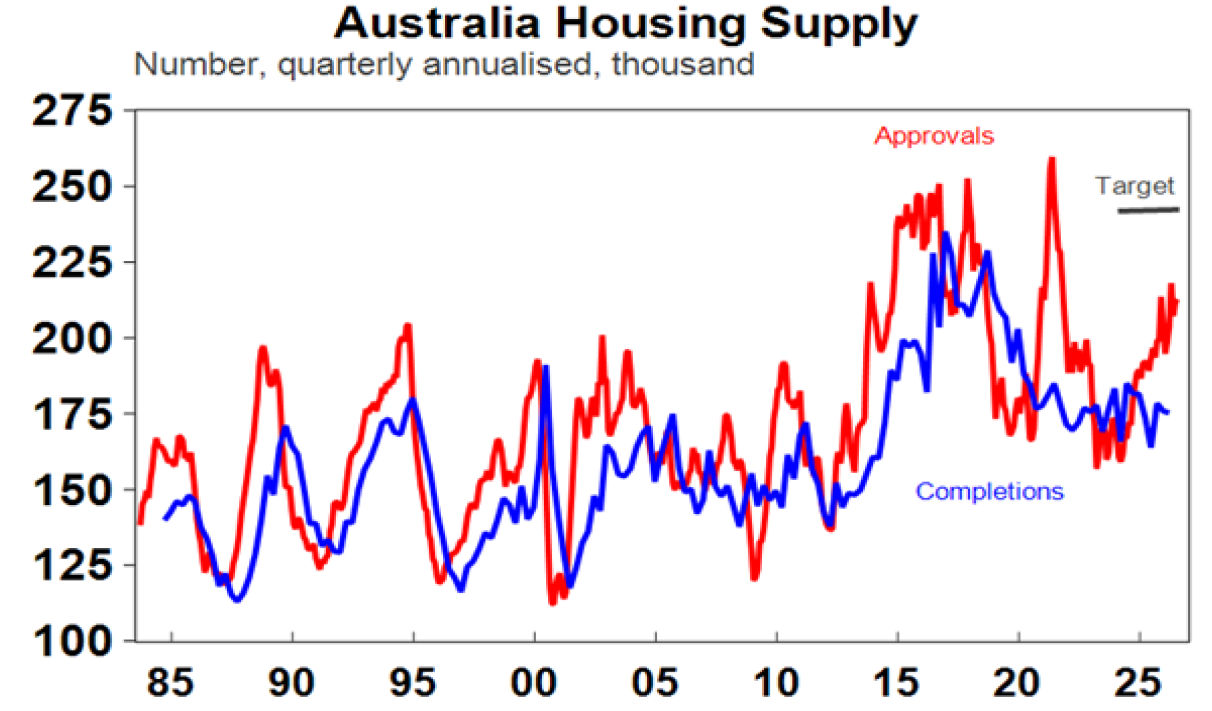
Home building approvals fell 3.6% in July – this was after a 7.4% rise in June but that may be in the process of peaking. The good news is that approvals are trending around 210,000 at an annual rate which is well up from their lows a few years ago. The bad news though is that this is still well below the Housing Accord target for 240,000 new homes a year and the combination of rate hikes, falling existing home prices versus rising building costs for new homes, uncertainty around the tax changes for investors, falling new home sales and problems with developers point down for home building going forward. So, the housing supply shortfall is not likely to be removed anytime soon.
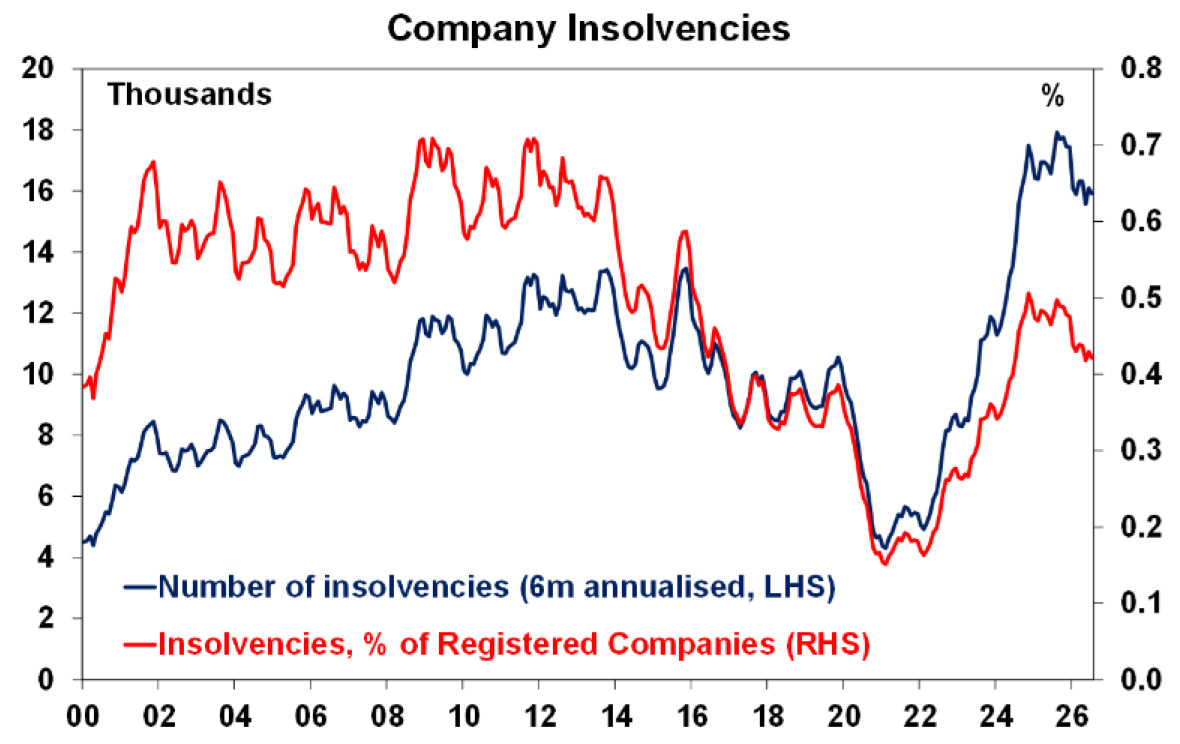
The collapse of Sydney property developer Bathla will compound the problems regarding housing supply. Interestingly though after a surge through 2022-2024 corporate insolvencies had been starting to fall. This fall may prove temporary. With inflation up and rates now rising again and growth slowing insolvencies may be on the way back up again, of which Bathla may be a forerunner!
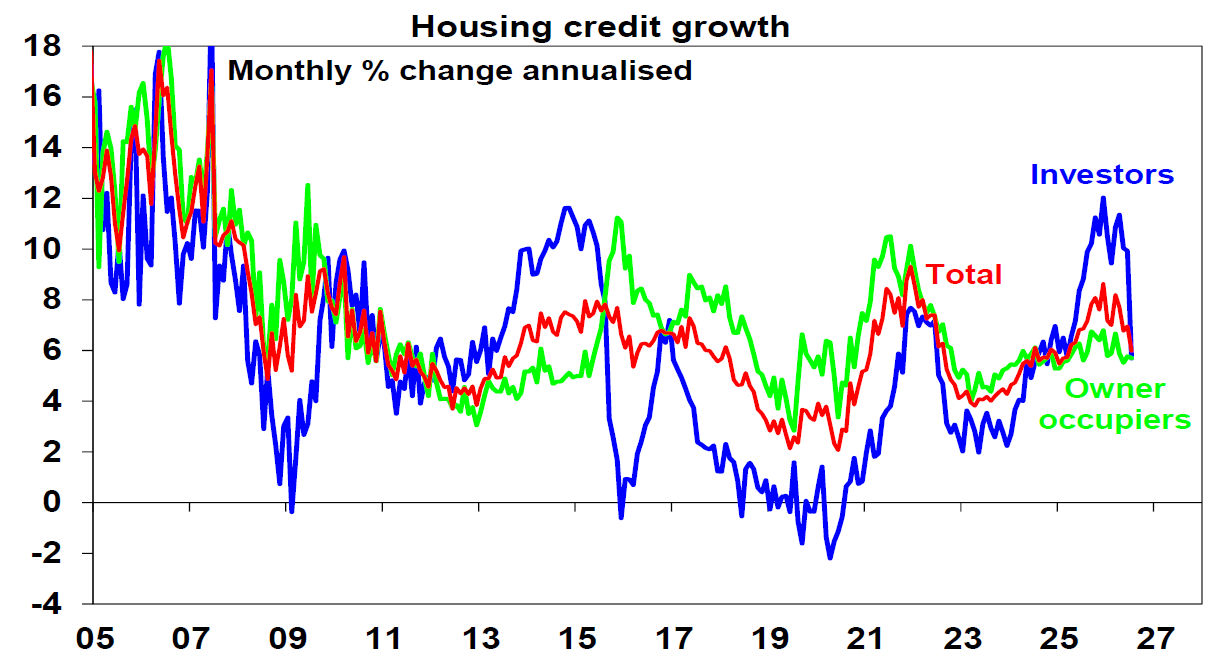
Credit growth cooled in August, with continued solid growth in business credit but a sharp slowing in housing credit to investors reflecting the tax changes and rate hikes.
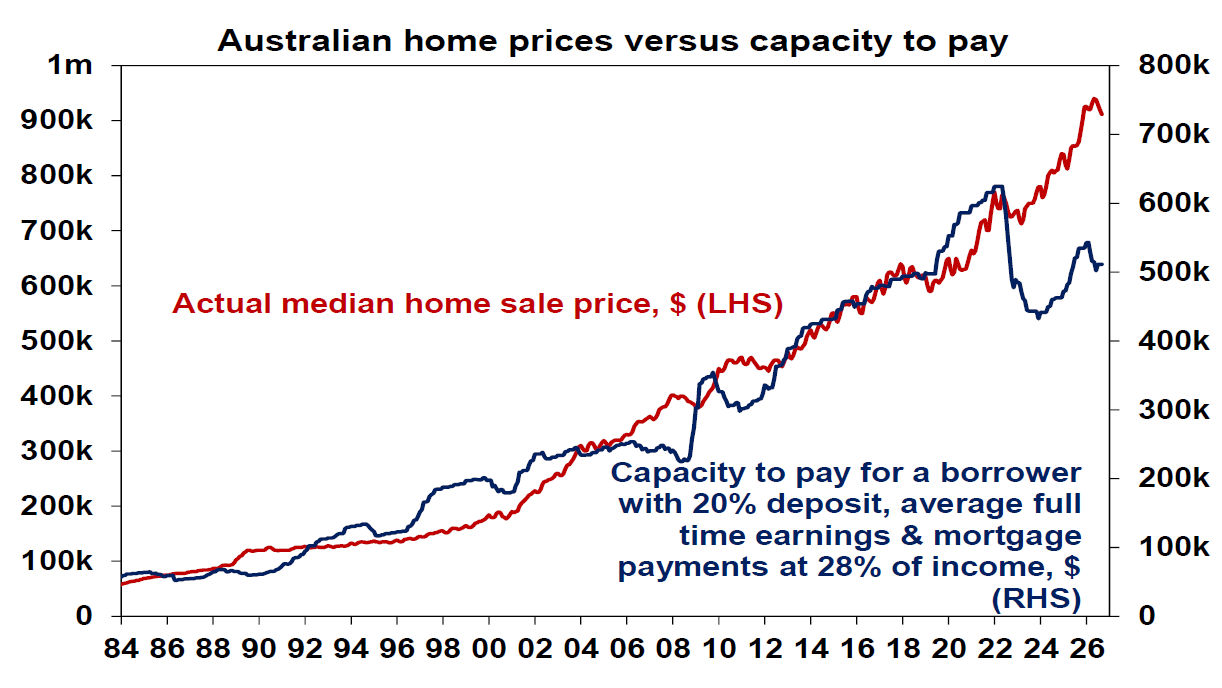
The slump in home prices deepened in August and likely has a lot further to go. We expect a 10% top to bottom fall in home prices, of which they have so far down 3.6%, as more RBA rate hikes, tax hikes on investors and poor sentiment continue to impact. The housing shortage, the 5% low deposit scheme for first home buyers and a lack of distressed selling are providing support. But the risks are for an even deeper fall – say 15-20% - given the structural changes from a long-term downtrend in interest rates to a rising trend and the tax changes for investors which could mean they require a 20-25% fall in property prices or rise in rents or some combination of the two to enter the property market. This could be compounded if the RBA ends up over tightening and tipping the economy into recession resulting in much higher unemployment which in turn could drive a sharp rise in distressed selling. Note that in a falling market Cotality tends to revise down the prior month’s price fall and so July was revised from a 0.7% fall to a 1.2% fall. So, the 0.9% fall reported for August is likely to be revised more negative too.
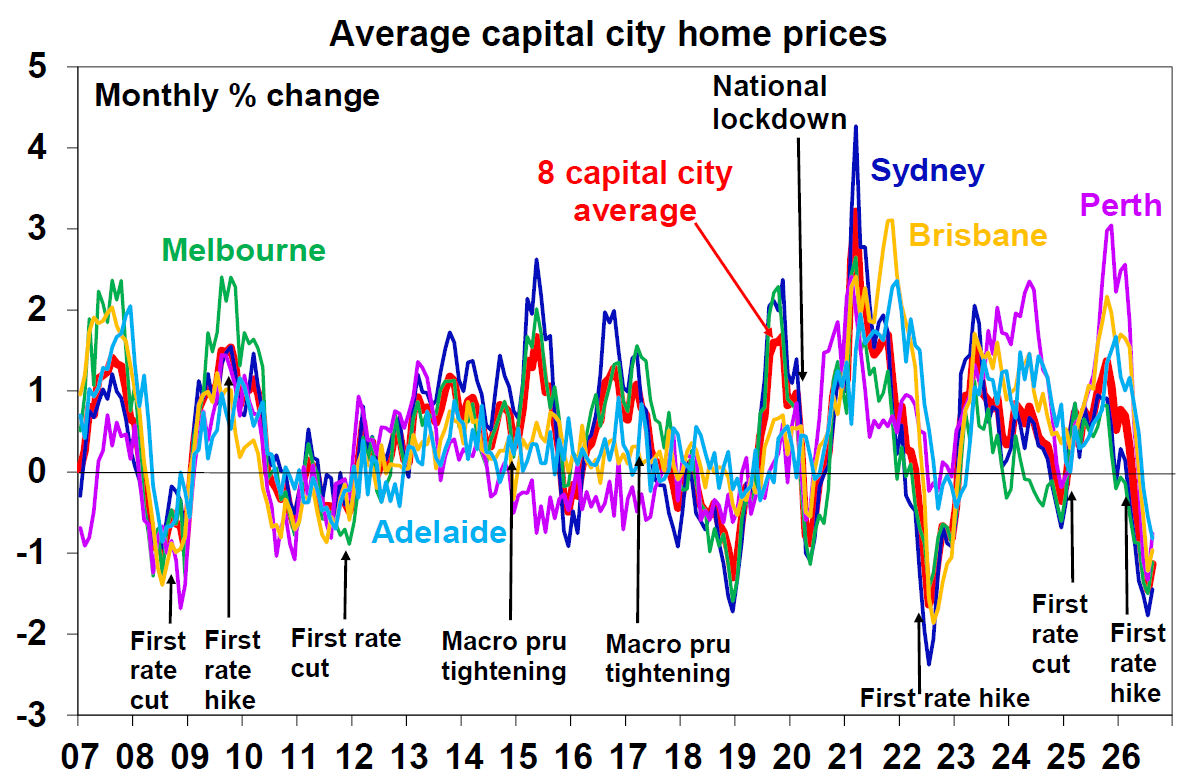
From an affordability perspective the fall in home prices is so far just a flick off the top after a 20% or so rise since the pandemic – so the negative wealth effect so far (which is about a 1% hit to consumer spending for every 10% fall in home prices) is likely to be small so far. And the gap between capacity to pay and home prices remain huge – which highlights the downside risk for home prices.
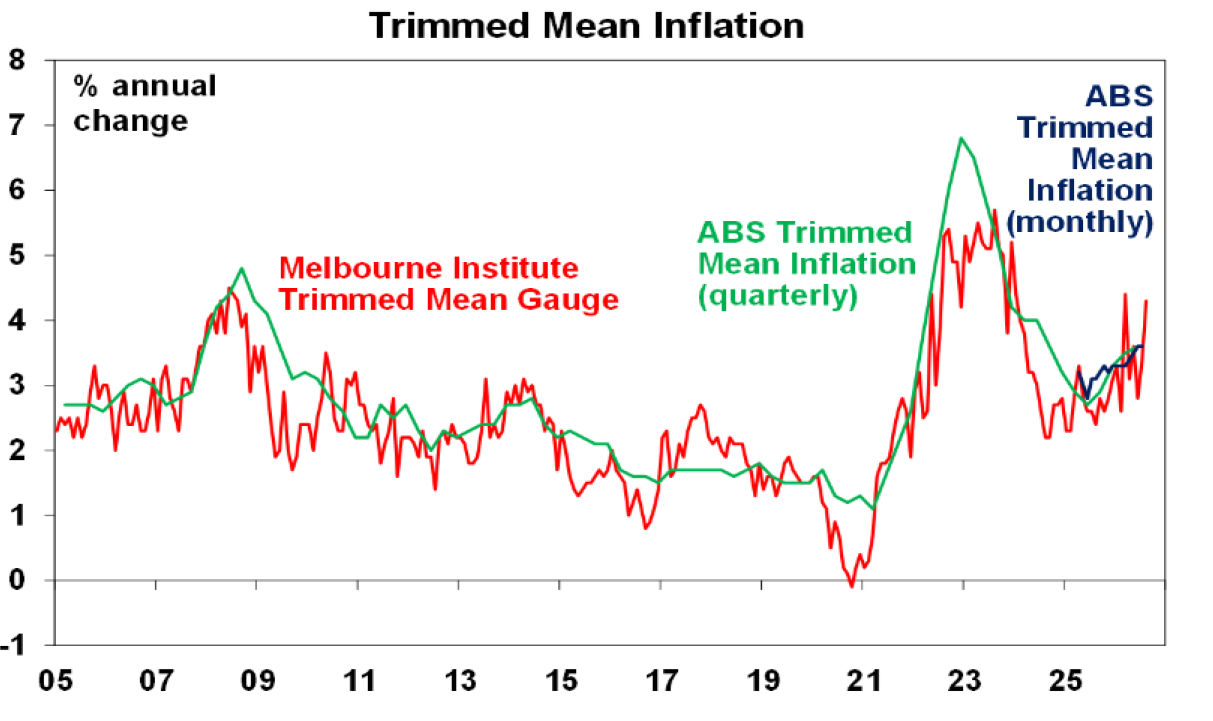
The Melbourne Institute’s Inflation Gauge for August showed a further worsening with both the headline gauge rising to 4.8%yoy and the trimmed mean gauge rising to 4.3%yoy. This adds to the risk that the high inflation seen in the official inflation data for July was not an aberration.
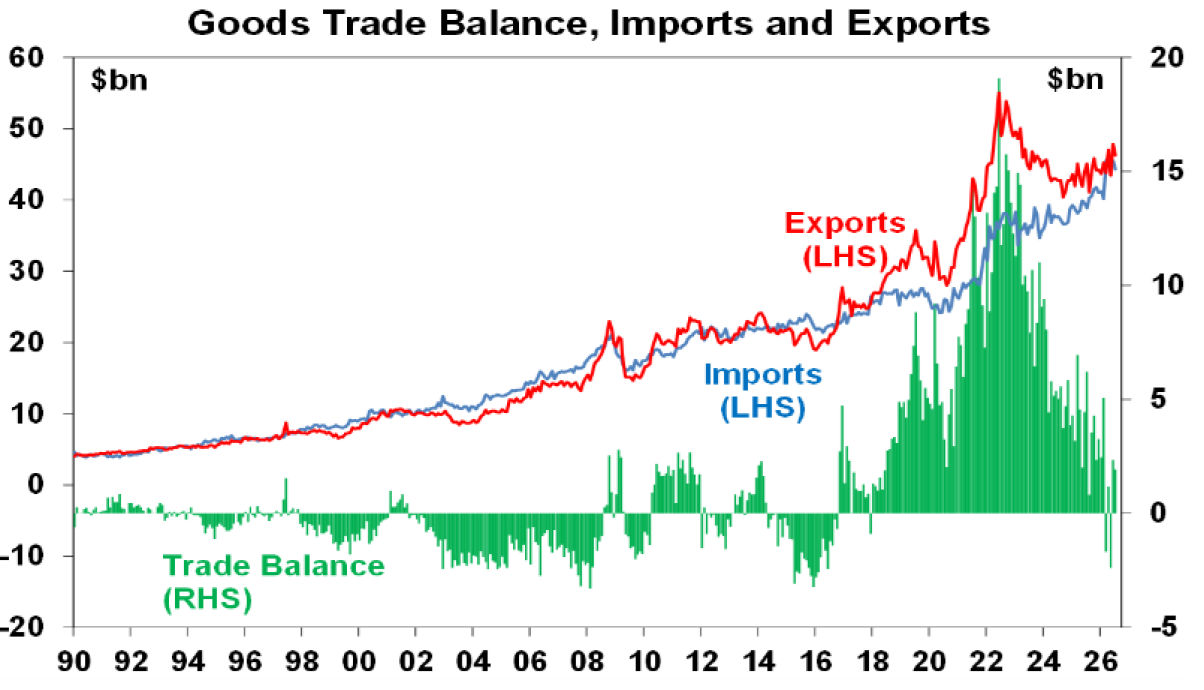
Australia’s goods trade surplus fell in July but remains around $2bn. Both exports and imports fell but capital goods imports rose consistent with a continuation of the data centre boom.
What to watch over the next week?
In the US, the focus will be on CPI inflation data for August (Friday) which is likely to show a 0.4%mom rise due to higher energy prices leaving annual inflation at 3.4%yoy and a 0.2%mom rise in core inflation resulting in a slight drop to 2.4%yoy. Following dovish comments by Fed officials Williams and Waller in the last week a 0.2%mom rise in core inflation may be enough to leave the Fed in a holding pattern at its September meeting but it’s a 50/50 call. If the CPI data implies a 0.25% or greater rise in the core PCE deflator for August, it will likely tip the Fed over into a hike. Existing home sales (Thursday) likely fell again.
The ECB (Thursday) is likely to hike by 0.25% again in line with recent guidance taking its deposit rate to 2.5%.
Chinese trade data for August (Tuesday) is likely to show continuing strong growth in exports and imports. CPI inflation data for August (Wednesday) is likely to have risen to 0.9%yoy with core inflation staying at 0.9%yoy.
In Australia, the NAB business survey for August is likely to show business confidence remaining weak but with price pressures remaining elevated and the Westpac/MI consumer sentiment index is likely to weaken in response to increasing talk of another rise in interest rates with both due Tuesday. Comments on Tuesday by RBA Chief Economist Sarah Hunter in a panel and in an ABC 7.30 Report interview will be watched for any clues on the interest rate outlook.
Outlook for investment markets
Global and Australian share markets are likely to remain volatile with the lack of any long-term resolution to the Iran War and hit to global oil supplies, stretched valuations, sticky inflation, political uncertainty associated with Trump & the midterm elections and worries about the impact of AI and whether there is an AI bubble. However, returns should still be okay for the next 12 months as a whole thanks to continuing economic growth with recession avoided and strong global profit growth and likely rate cuts next year.
Bonds are likely to see returns around running yield or a bit less.
Unlisted commercial property returns are likely to be solid helped by strong demand for industrial property associated with data centres.
Australian home prices are expected to fall around 10% top to bottom, of which they have already done 3.6%, out to the June quarter next year as a result of poor affordability, RBA rate hikes, reduced investor demand flowing from the winding back of negative gearing and the capital gains tax discount and poor confidence.
Cash and bank deposits are expected to provide returns around 4-5%.
The $A is likely to rise reflecting the wider interest rate differential to the US, although a move to Fed hikes may limit this. Fair value for the $A is around $US0.72.
Dr. Shane Oliver
Head of Investment strategy and Chief Economist, AMP


You may also like
-

6 New Year resolutions that could improve your finances Six simple financial tips that could help you save more, spend smarter and feel more in control of your finances in the new year. -

Weekly Market Update - 09-10-2026 - AMP Weekly Market Update: US shares near record highs but risks are bubbling, tech rally remains narrow, credit markets turn wary on AI & Firmus IPO shelved, French bond yields surge, and another immigration debate. -

Five things that could stop the data centre boom Discover five major challenges that could slow the data centre boom, from power constraints and regulation to costs, talent and infrastructure.
Important information
Any advice and information is provided by AWM Services Pty Ltd ABN 15 139 353 496, AFSL No. 366121 (AWM Services) and is general in nature. It hasn’t taken your financial or personal circumstances into account. Taxation issues are complex. You should seek professional advice before deciding to act on any information in this article.
It’s important to consider your particular circumstances and read the relevant Product Disclosure Statement, Target Market Determination or Terms and Conditions, available from AMP at amp.com.au, or by calling 131 267, before deciding what’s right for you. The super coaching session is a super health check and is provided by AWM Services and is general advice only. It does not consider your personal circumstances.
You can read our Financial Services Guide online for information about our services, including the fees and other benefits that AMP companies and their representatives may receive in relation to products and services provided to you. You can also ask us for a hardcopy. All information on this website is subject to change without notice. AWM Services is part of the AMP group.