


Weekly market update
Investment markets and key developments
Financial markets were taken on a roller coaster ride this week as we started and ended the week with promises of TACOs (Trump Always Chickens Out), though it turned out that we were fed NACHOs instead (Not Actually Changing Hormuz Opening)!
9 min read

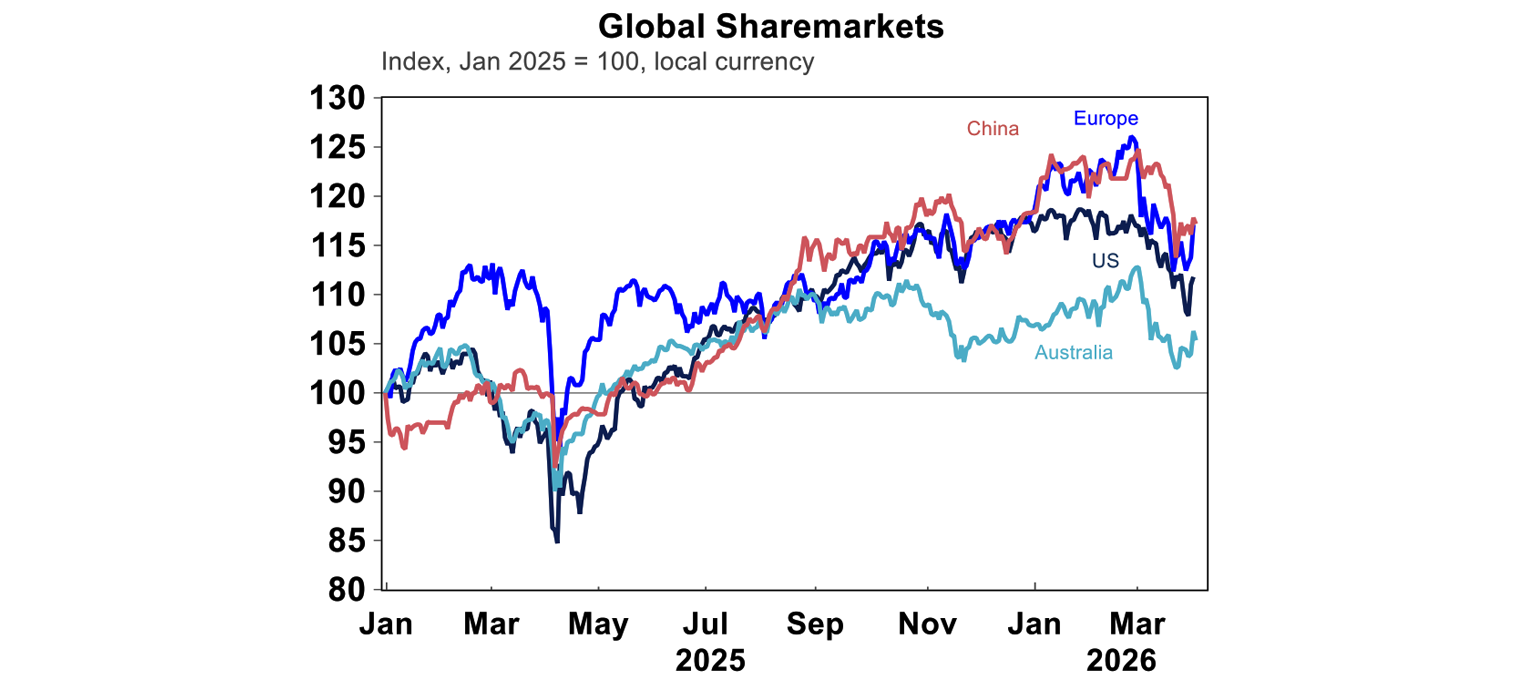
Financial markets were taken on a roller coaster ride this week as we started and ended the week with promises of TACOs (Trump Always Chickens Out), though it turned out that we were fed NACHOs instead (Not Actually Changing Hormuz Opening)! The previous extension of the deadline to attack Iranian energy assets to April 6th did little to calm markets heading into Monday, as the Houthis became involved in the conflict and Hormuz remained effectively shut. However, optimism has since grown as President Trump indicated he might withdraw even if the Strait stayed closed, while Iran's President also showed willingness for a ceasefire. Hopes for an end to the war reached a fever pitch by Thursday with the S&P 500 recovering all of its losses since March 26th. Trump’s much-anticipated national primetime address disappointed as it contained nothing new: Core US goals are “nearing completion”, the US will hit Iran’s electric plans if there is no deal, and in fact the speech skewed to higher escalation risks as Trump threatened to hit Iran “extremely hard” over the next 23 weeks. Share gains moderated into the end of the week and the US is up 1.6% since last week, EuroStoxx 50 up 2.3%. Aussie shares rose 0.7% this week and are down by 6.7% from before the war and Japanese shares still down more than 10% from February.
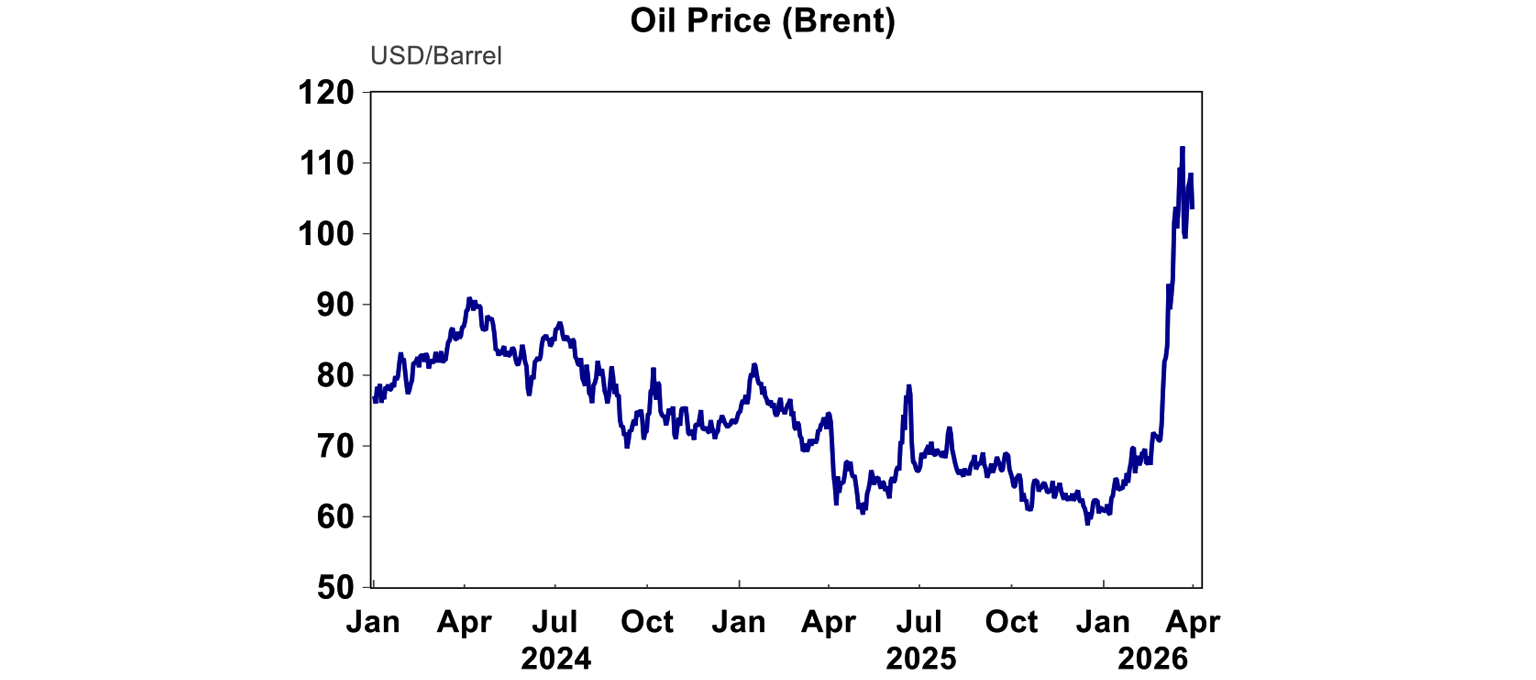
Unsurprisingly, Brent oil prices have also been on the same rollercoaster, coming down from a peak of $118/bbl last week to below $100 intraday mid-week, before spiking again after Trump’s disappointing speech to around $107 at the moment.
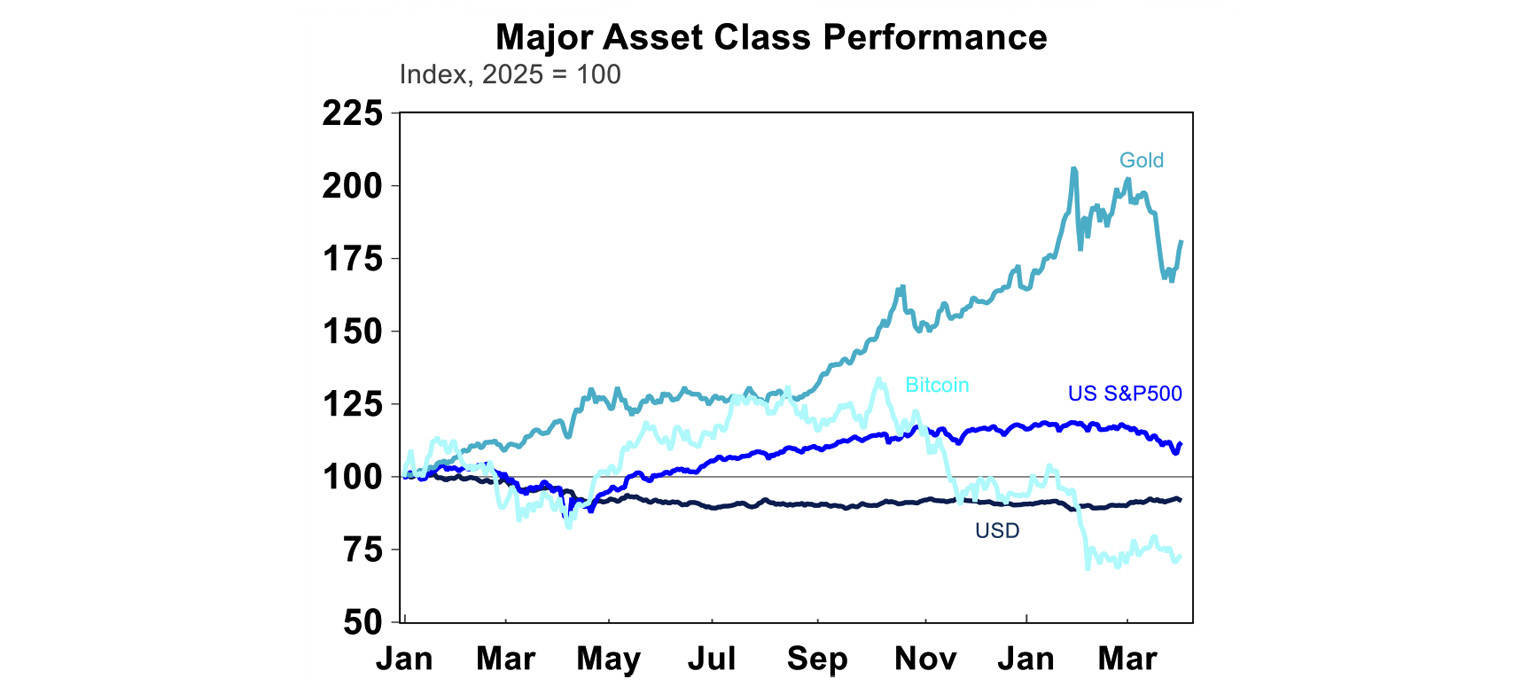
Similar trajectories were seen across different asset classes, with Aussie 10 years yields back above 5% again, while gold has behaved much like a risk asset rather than a safe haven lately, ending the week just below US$4,700/oz.
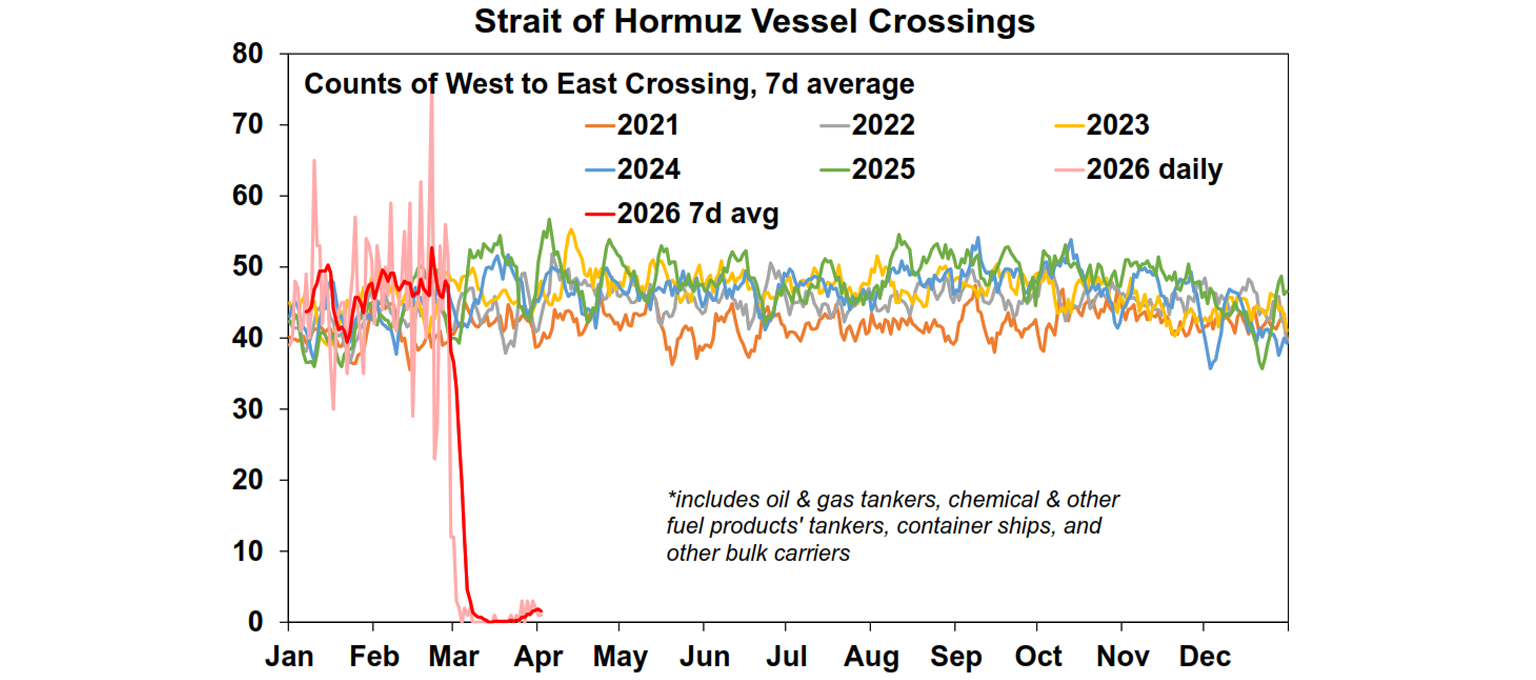
Economic game theory suggests that war is very difficult to end, because while the rational choice is peace, both sides prefer to stay in the game as they fear that the other won’t stop. So, we will see a lot more noise and rhetoric around the war coming up, and it is well conceivable that we can see a 15% peak to trough fall in shares this year (which likely will force Trump to back down more meaningfully). In the meantime, the only number that matters is the count of vessels passing through the Strait of Hormuz. Over the last week, 11 ships have gone through which is a big improvement from zero back in mid-March, but most of them are not oil tankers and it is estimated that oil supply remains around 5-10% below the pre-war levels.
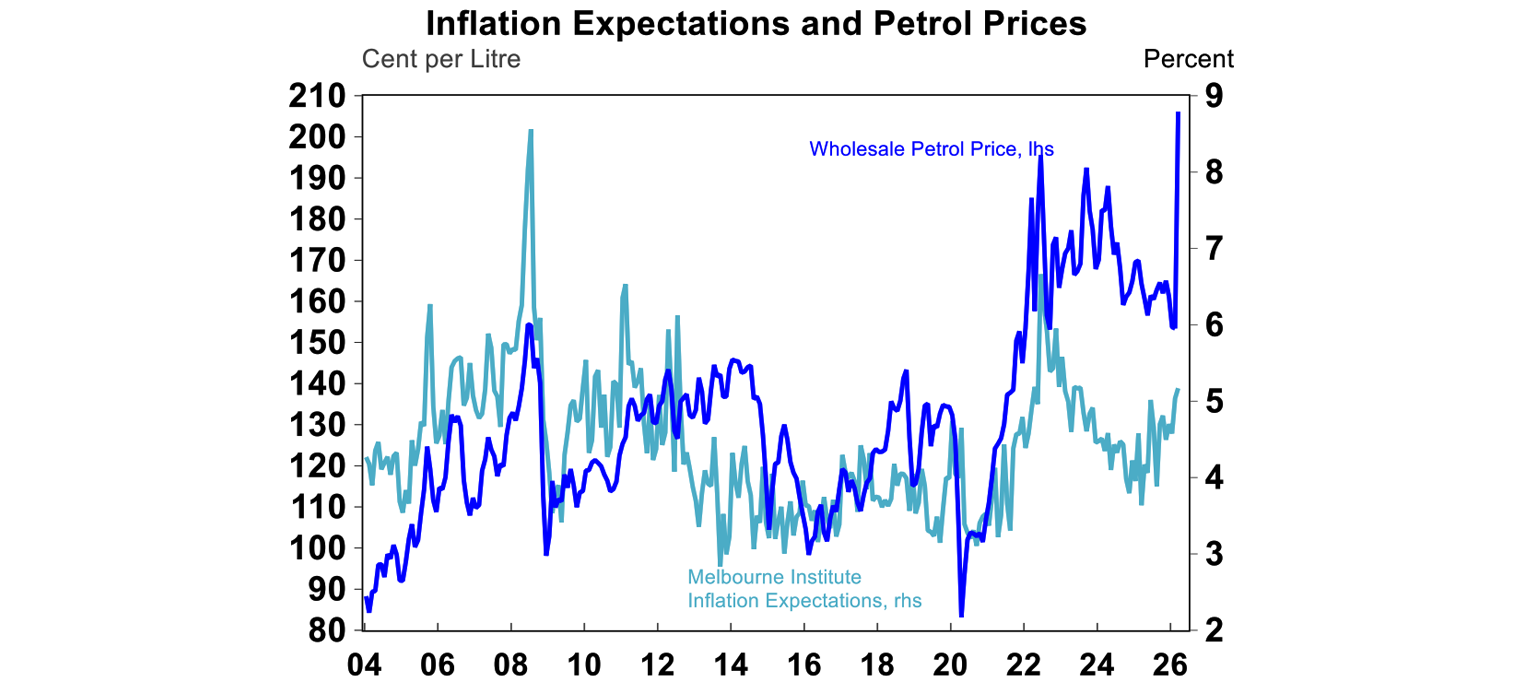
Now that Hormuz Strait has been closed for more than a month, even an end to the war today will see supply disruption in many sectors over the coming months. The International Energy Agency has estimated that even after the waterway fully opens, shuts in upstream production could take weeks to months to return to precrisis levels. And while the first-round impact from fuel supply is already well known at the bowser, we are yet to see higher food prices (from a shortage of fertilisers) as well as inflation in other manufactured goods (with supply issues in plastics, aluminium, or helium). In addition, similar to most cycles in history, services inflation will follow goods, especially at a time when businesses are already starting to pass all the costs to consumers through “fuel surcharges”. Furthermore, the longer the conflict goes on, the higher inflation expectations become unanchored, which forces central banks to turn more hawkish than otherwise. Reflecting these trends, we have now revised up our headline inflation forecasts for Australia to 5%yoy for the June quarter, while trimmed mean inflation is expected to peak to 4%yoy before returning to the RBA’s 2.5% target at the end of 2027.
As a result, most global central banks are now expected to hike rates with the exception of the US Federal Reserve. Earlier this week, Fed Chair Powell tempered some market expectations, indicating that the Fed would look through supply-driven oil price spikes “for now” as inflation expectations remained anchored in the US and labour market indicators continued to soften slightly. In Australia however, we now expect two more hikes in May and August. The recently released RBA minutes showed that while there was a split between board members for the hike in March, all voters agreed that the cash rate would “probably need to be increased further at some point”. Despite the repeated references to uncertainty in the minutes, we think that the risks to Australia’s inflation now tilt to the upside. External supply disruptions are pushing up headline inflation as mentioned above, but structural issues around housing inflation will persist as rents growth are now accelerating and vacancies remain around record lows. In addition, domestic services inflation (especially in essential services), largely driven by wages growth, is potentially gaining some momentum in the upcoming quarters.
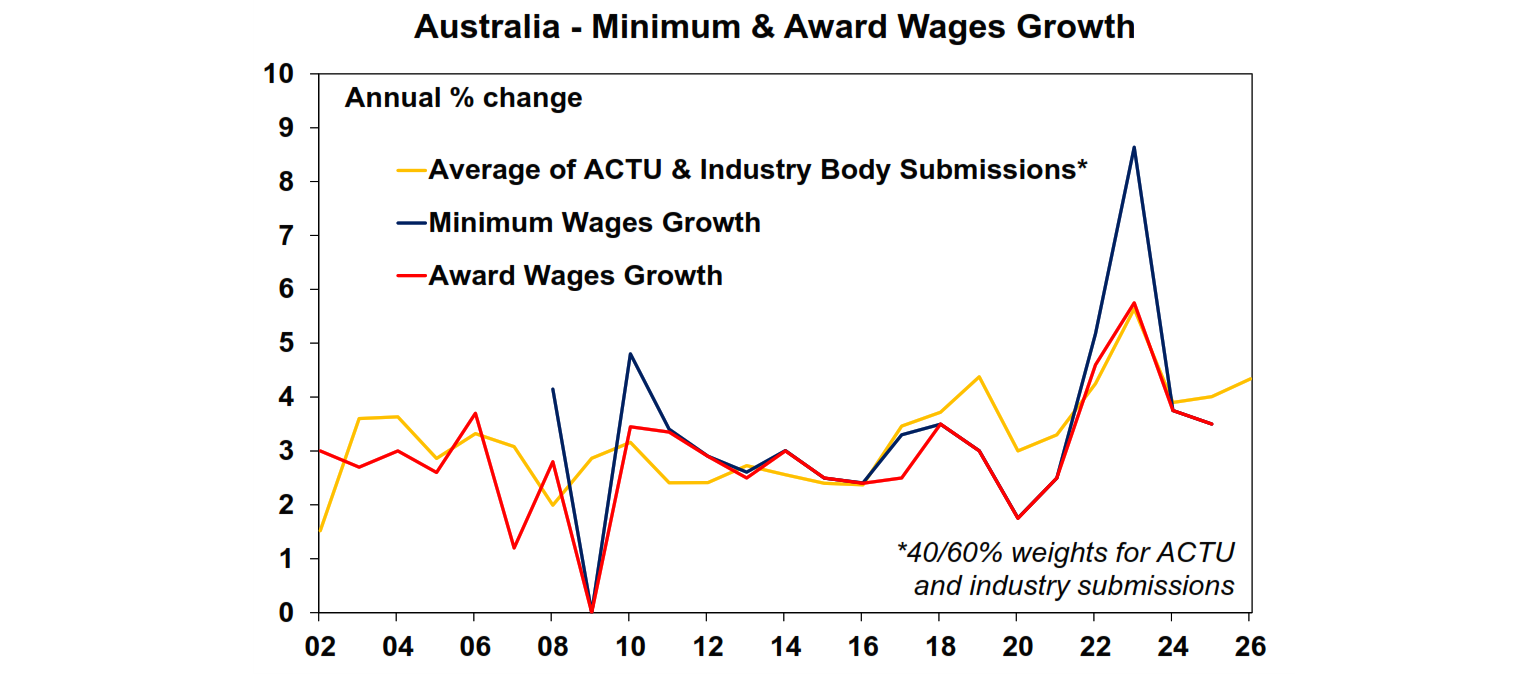
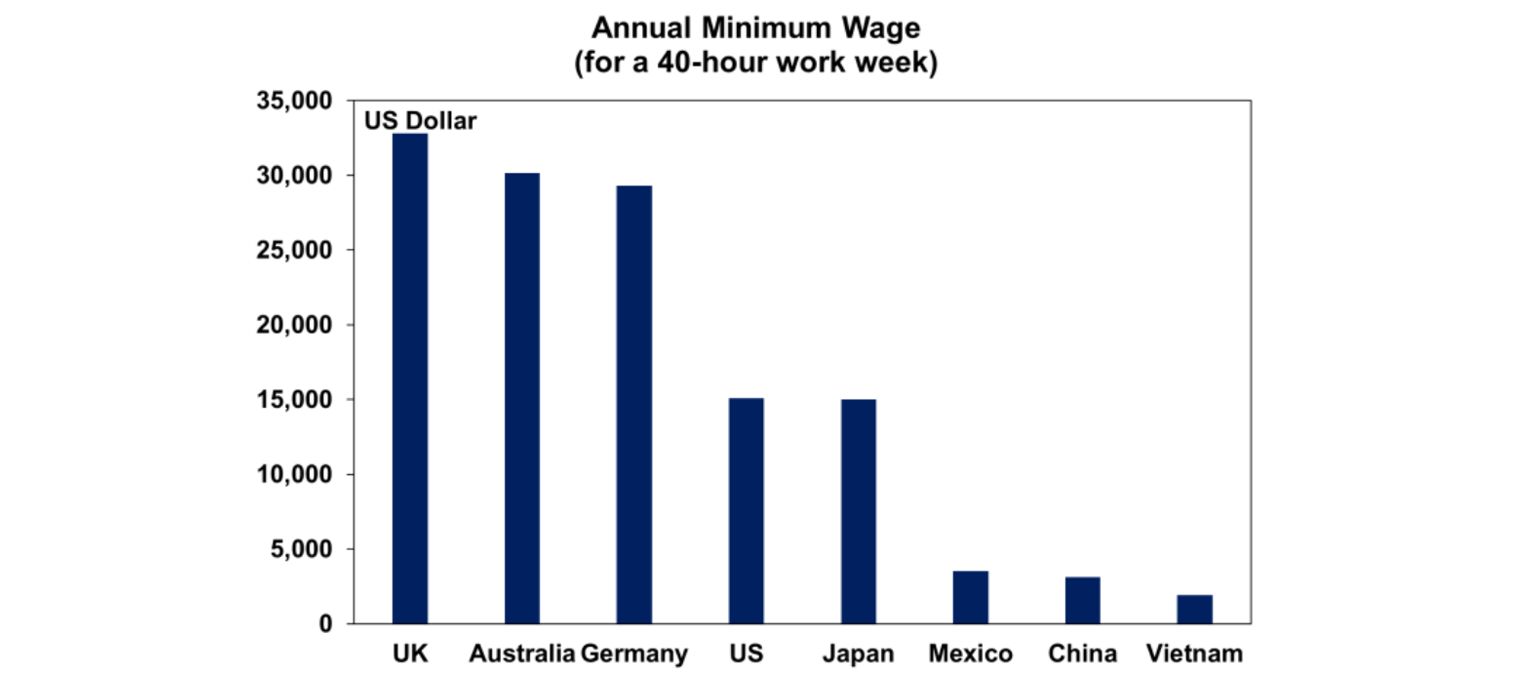
After the government and the ACTU suggested a 5% rise for minimum and award wage workers (aka an above inflation rise), the Fair Work Commission is now also increasing junior wage rates for those between 18 and 20 years old from the current level of 70-90% full award wages. In particular, wages will be increased to the full adult levels over four years from this December. It could potentially be good news for young people trying to get into the workforce (if there is no decline in hiring) but will also add to wages pressures across the economy at a time when inflation is already too high above target. It is also notable that Australia has one of the highest minimum wages among peers.
With global growth looking weaker and inflation looking to turn higher from the Middle East conflict, pressure is mounting on the government to intervene and save us from all of this mess! The Victorian and Tasmanian government has made public transport free for 3 months and 1 month, respectively, which will shave off a very minimal 0.1 percentage point from national monthly inflation. The Australian Federal Government is also under pressure to provide some sort of cost-of-living relief to households, leading to the Prime Minister also delivering a speech to the nation that did not contain any new information as well as a halving of fuel excise from 53cents to 26.5 cents per litre. With average national prices around $2.58/l before the cut, this represents a 10% discount to the fuel bill and could cut up to 0.4 percentage points from quarterly headline inflation – which sounds like a great deal! But the fuel excise was originally meant to fund transport infrastructure, specifically targeting those who drive longer distances or use big and less efficient cars, since they contribute more to road wear & tear, congestion, and pollution. Cutting fuel excise tax, while only delivering a temporary relief, only encourages more driving than otherwise and delays the shift to EVs or more fuel-efficient cars. And in case of a fuel shortage, we’d better not encourage more fuel hoarding by cutting prices! A better solution would be using that money to improve public transportation access and frequencies, expand EV facilities, or more targeted assistance to essential workers who must drive (the temporary cut to the heavy vehicle road user charge is a good example as it benefits trucks, which will lower goods’ transportation costs).
The only potentially good news for Aussie consumers this week is that the RBA has banned card surcharges on debit and credit card transactions, following the lead of most other OECD countries. However, economically, this means that the surcharges would be baked into advertised prices, instead of being added on at the point of payment, so there is essentially no difference if we were all rational! In the long term, we expect that businesses will increase prices to pass on the card processing costs to consumers, similar to any other costs of businesses. However, the other parts of the card surcharge review are more meaningful and ultimately will deliver better outcome for everyone: First, the RBA is lowering the interchange fee cap from 0.8% to 0.3% on domestic consumer cards. Secondly, the RBA is requiring card networks and banks to publicise their fees so that businesses can compare across bank. Lower fee caps, more competition and more transparency will all lower the cost of transactions!
Major global economic events and implications
US economic data was still resilient heading into the energy shock. February retail sales rose 0.6%mom, beating expectations, while the Conference Board confidence reading rose slightly over the month. Meanwhile, the March manufacturing ISM survey, taken after the start of the war, rose by 0.3 points to 52.7, firmly in the expansionary territory.
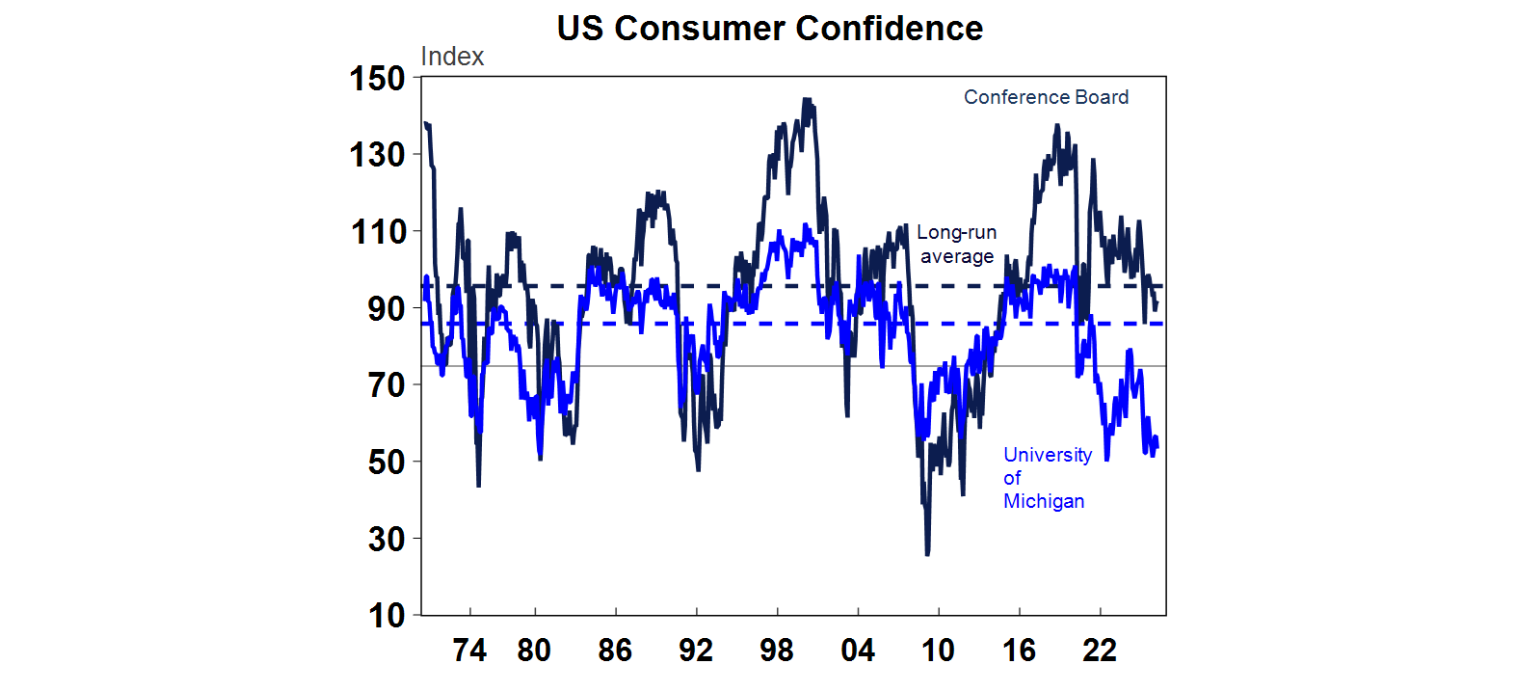
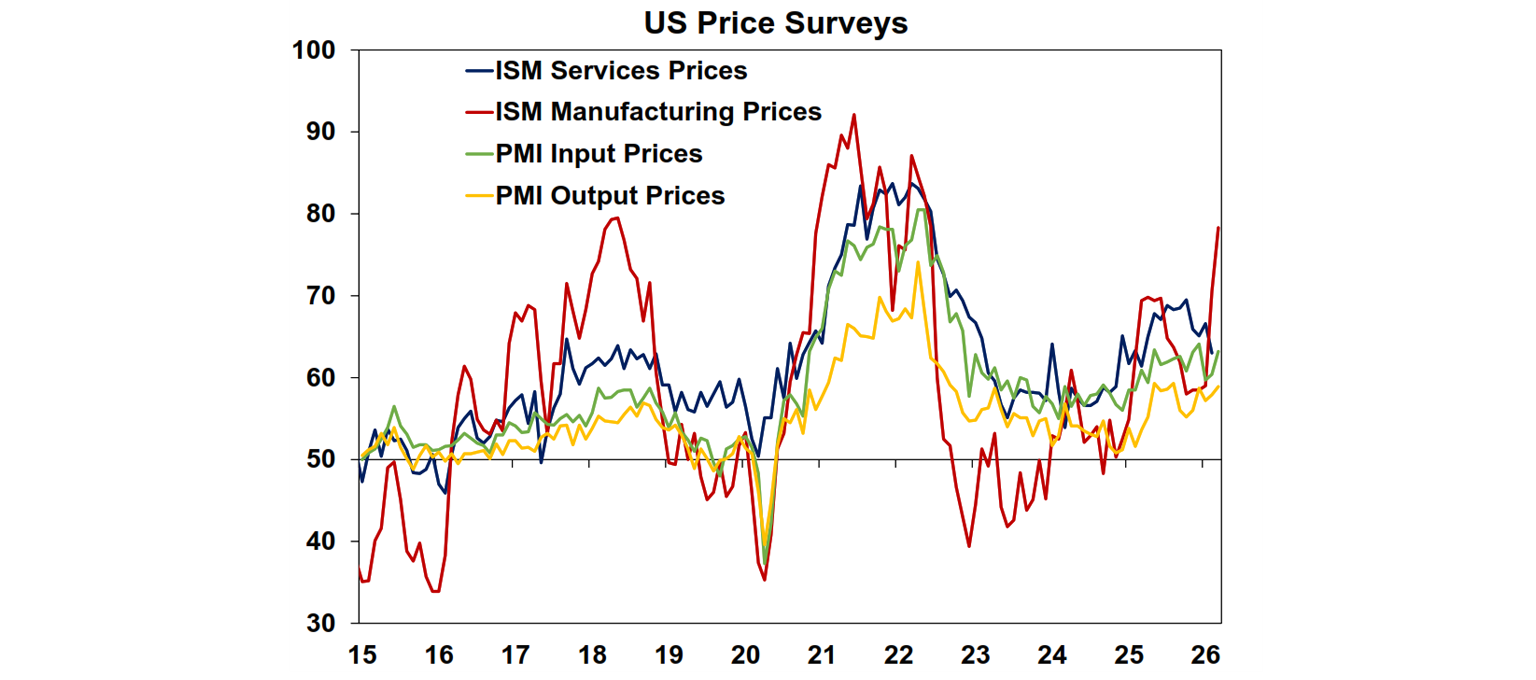
However, these headline figures mask some softening details. Consumers are also showing deteriorating outlooks and short-term inflation expectations have risen again; while the ISM survey has been pushed up by much longer delivery times. In good times longer delivery tends to mean that firms have strong orders, but the new orders survey fell this month, which potentially indicates some supply backlogs. The ISM Manufacturing input price survey has now surged to the highest level since 2022, way above the spike seen in 2025 from tariffs.
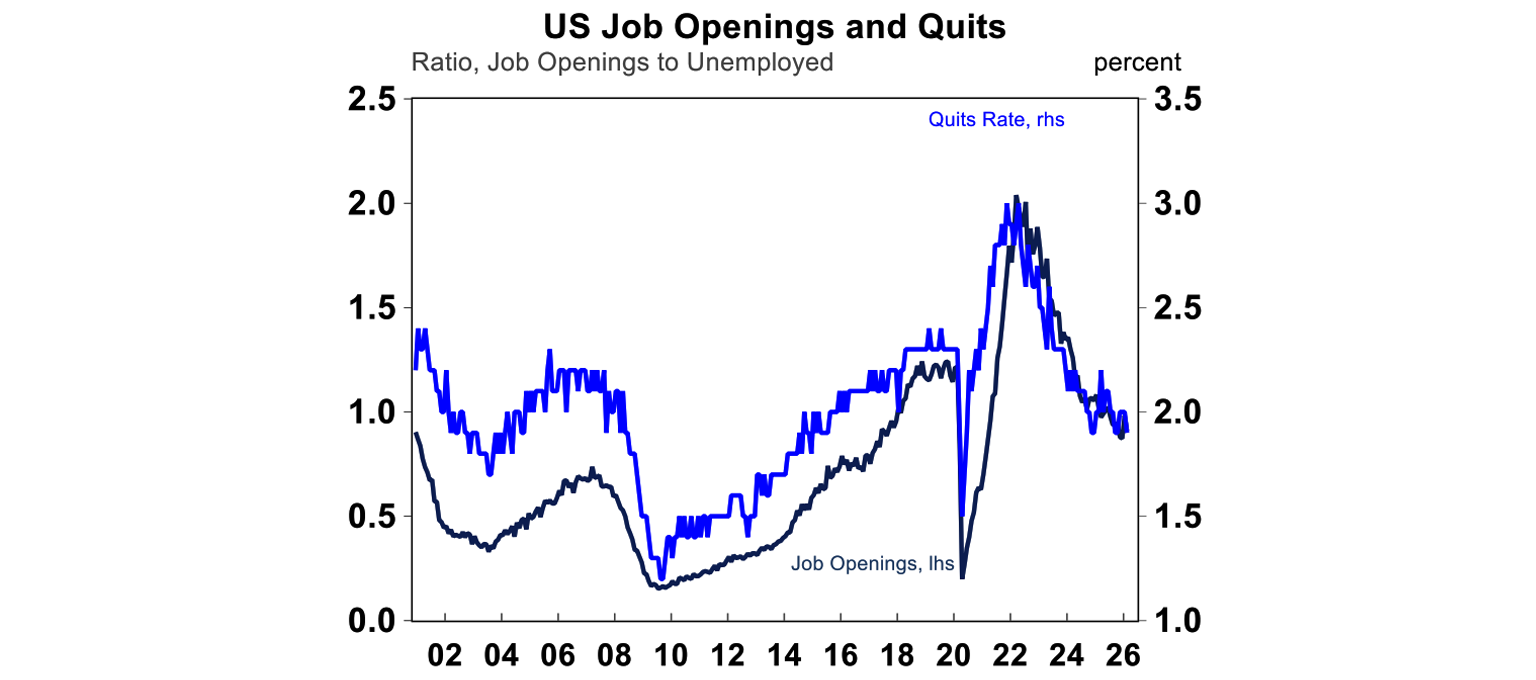
It is still unclear how much US companies can pass through the costs to consumers this year, as labour market indicators are softening (albeit slowly). Job openings for February fell to 6.9m from 7.2m prior while both hiring and quits edged lower (aka a low hiring, low firing environment). Consumers are also uneasy about their job prospects, with the Conference Board’s labour market indicator of jobs plentiful minus jobs hard to get at its weakest level since 2021.
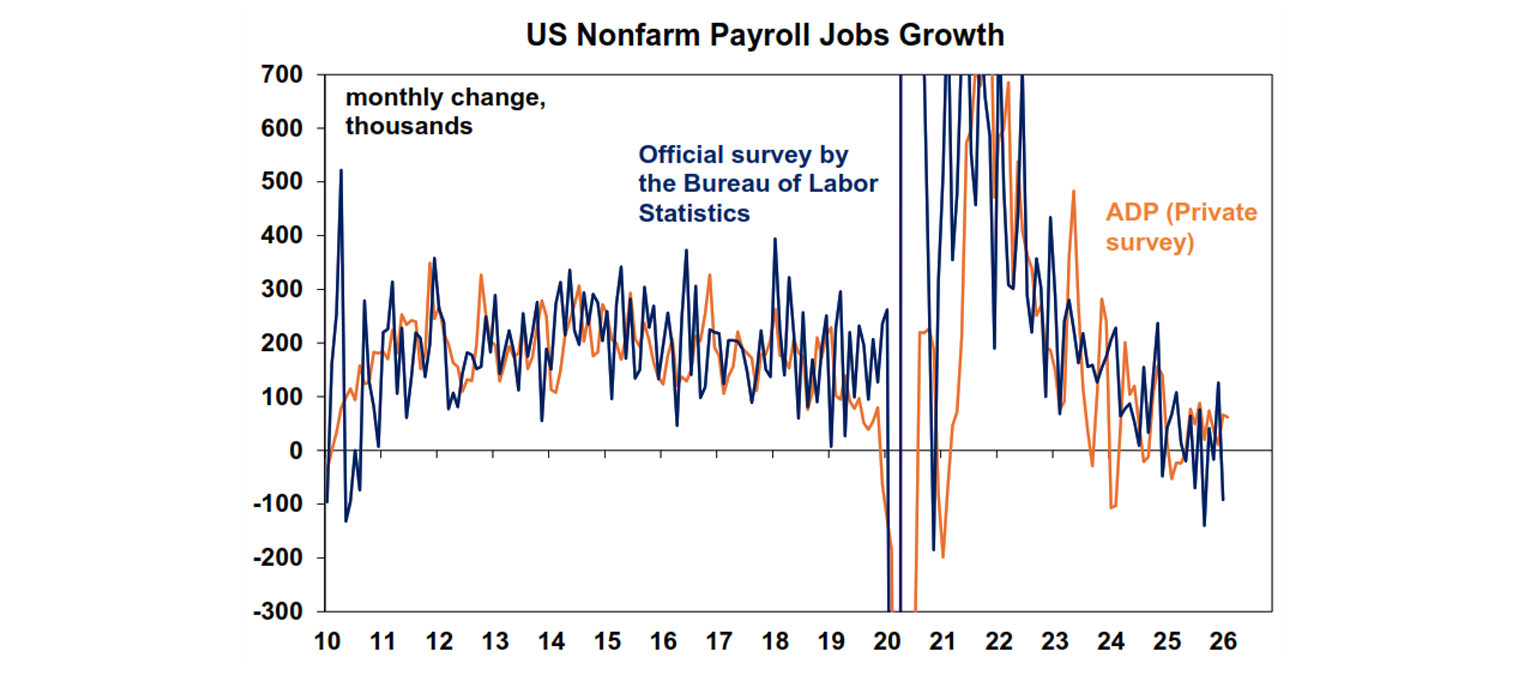
Overall, the labour market is keeping hopes of US Fed rate cuts alive! Both ADP and official nonfarm payrolls are now clearly trending down, with revisions consistently on the downside. The March non-farm payrolls data was mixed. March jobs rose by 178K, but February was revised down from an initially reported fall of 92K to a decline of 133K. The unemployment rate was slightly lower in March, to 4.3% (from 4.4% last month).
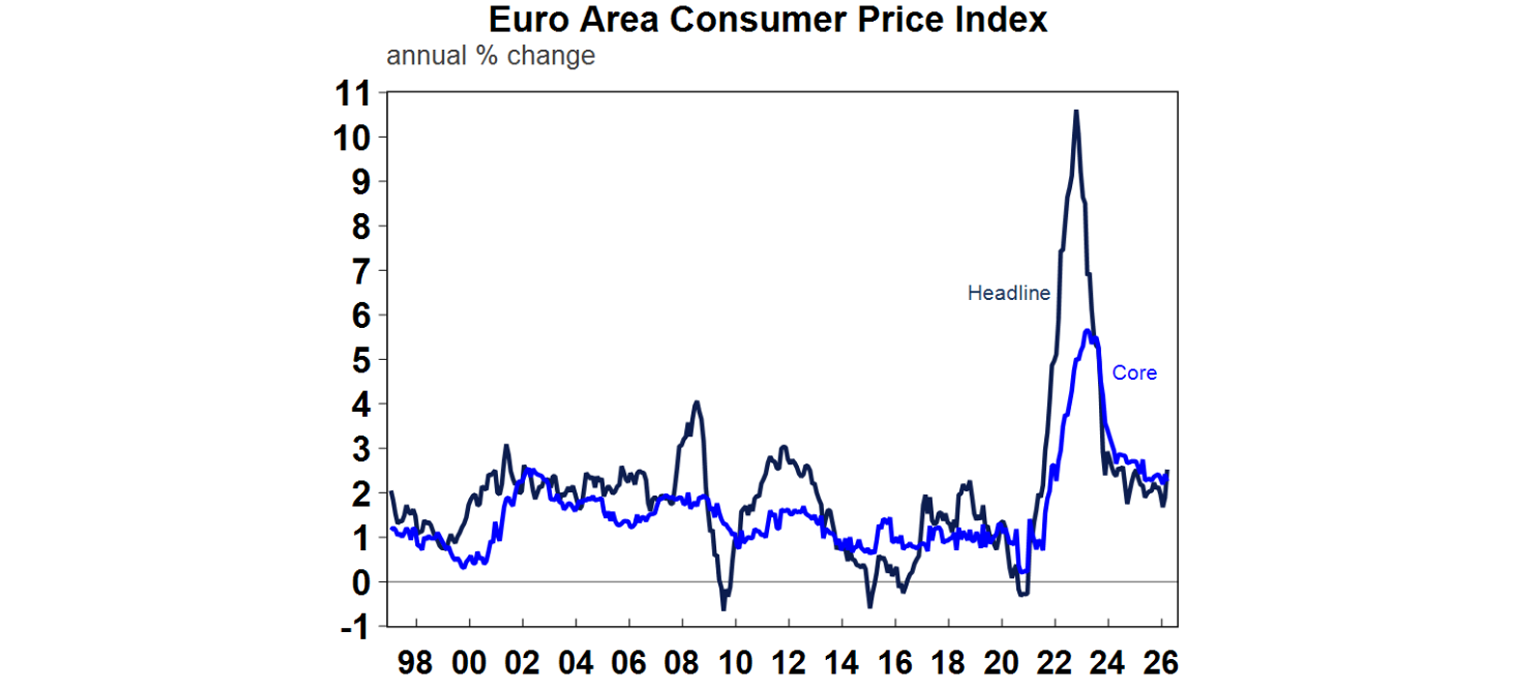
Across the Atlantic, higher energy prices are now feeding into Eurozone inflation, which rose to 2.5%yoy in March from 1.9% in February. Positively though core CPI hasn’t (yet) seen the passthrough from energy and remained reasonable from 2.3%yoy (down from 2.4% prior). With higher fuel and gas prices expected to have secondary round impacts on other categories, markets are now pricing in up to 3 rate hikes from the ECB, but we think that Europe is very vulnerable to a downturn scenario from weaker global demand and the ECB will keep rates steady at least in the Northern Hemisphere summer.
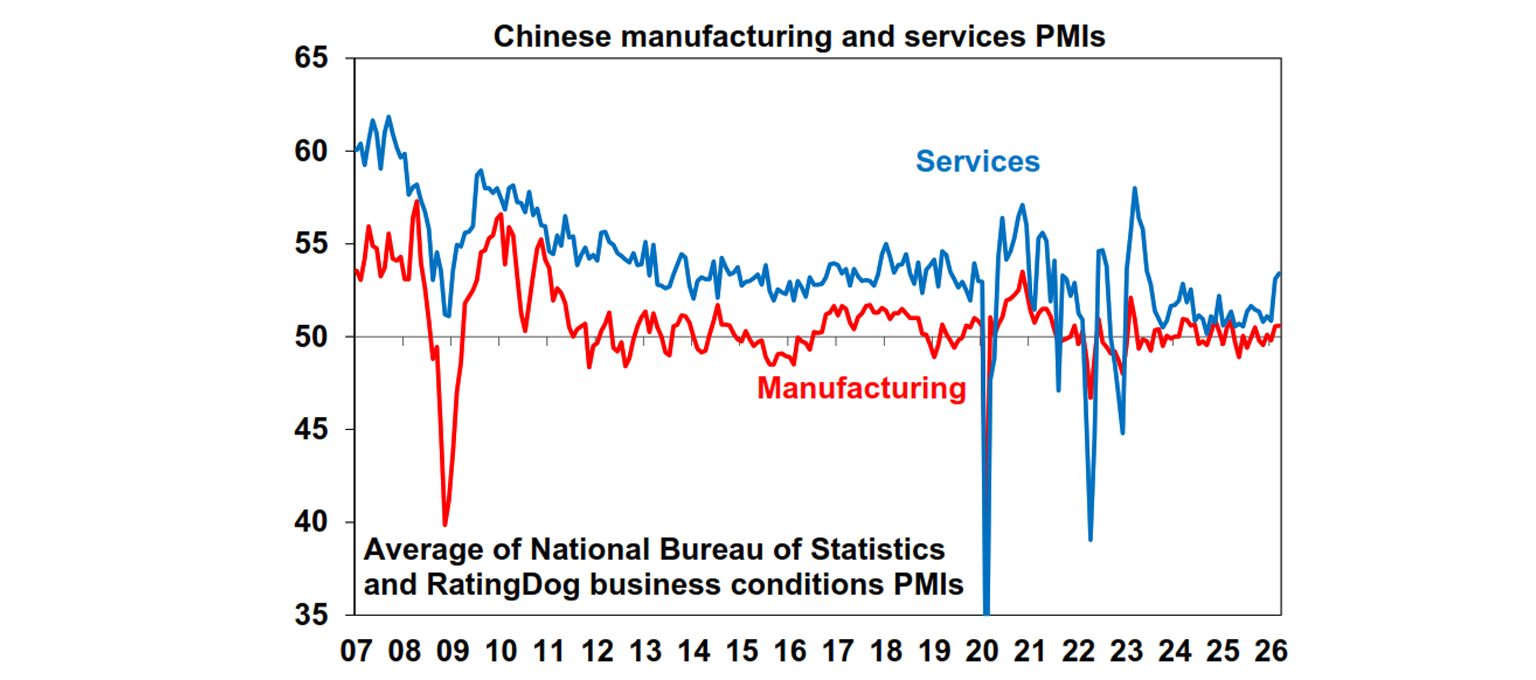
China’s suite of official and private PMI surveys showed conflicting signals about the outlook of Chinese companies, as the National Bureau of Statistic’ manufacturing PMI, which focuses on larger or state-owned firms, recorded a big rebound to 50.4 (from 49); meanwhile, the RatingDog survey that put a heavy emphasis on export-driven and small to medium manufacturers fell to 50.8 from 52.1, below the consensus forecast of 51.5. In other words, domestic activities are expected to pick up, but external headwinds from the Iran war will slow down the pace of expansion somewhat. However, both surveys are still in the expansionary territory so we continue to see Chinese growth around 4.7-4.8%yoy this year.
Australian economic events and implications
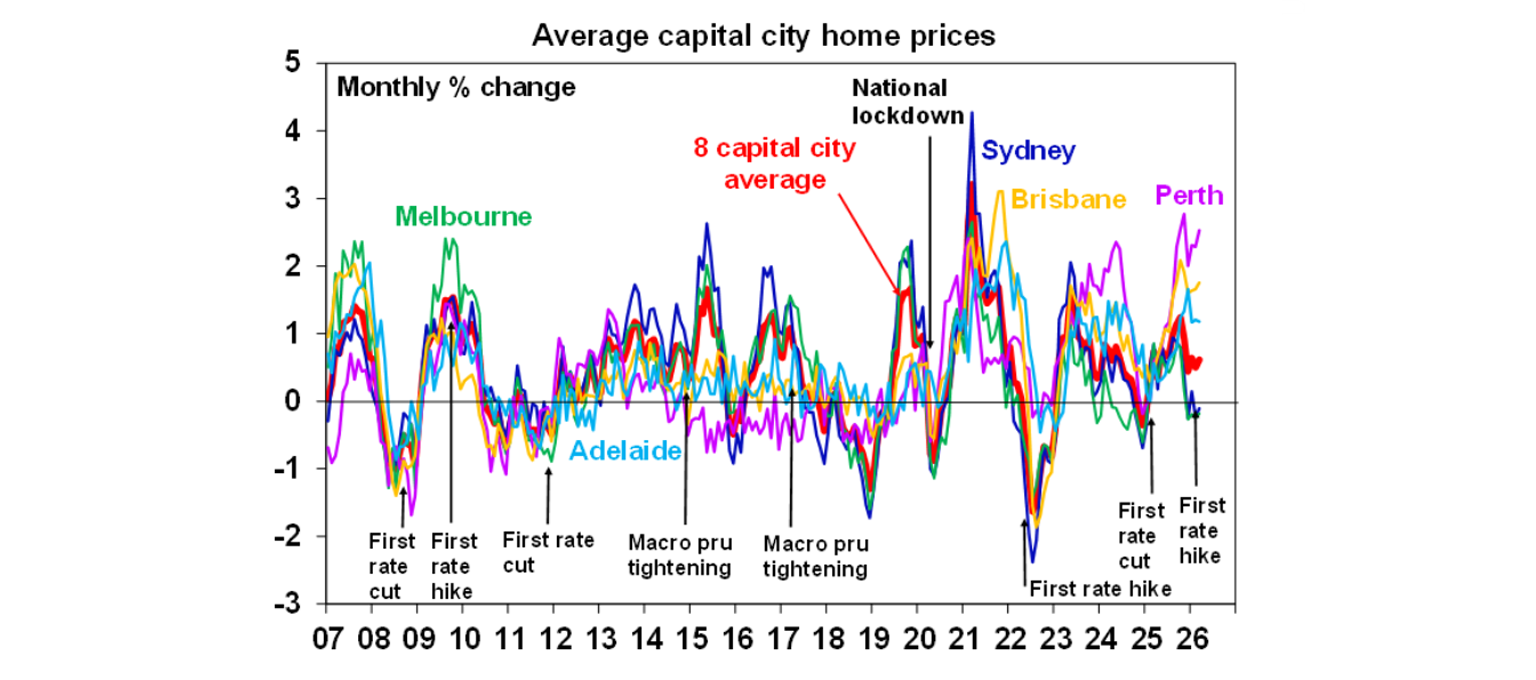
Housing market data in Australia is certainly softening, as the Cotality national home prices posted a 0.7%mom rise in March wide a wide divergence between cities. While Sydney and Melbourne prices fell slightly, the booming cities of Brisbane, Adelaide, and Perth rose to new record highs, but across the board the monthly pace of growth has eased from the November peak. More affordable homes (aka units) also showed stronger gains than detached houses, especially those with price tags eligible for the 5% Deposit Scheme for first home buyers. Annual growth is strong at nearly 10%yoy but is topping out and we expect growth to slow further this year as rate hikes lowers the capacity to service a mortgage for most buyers.
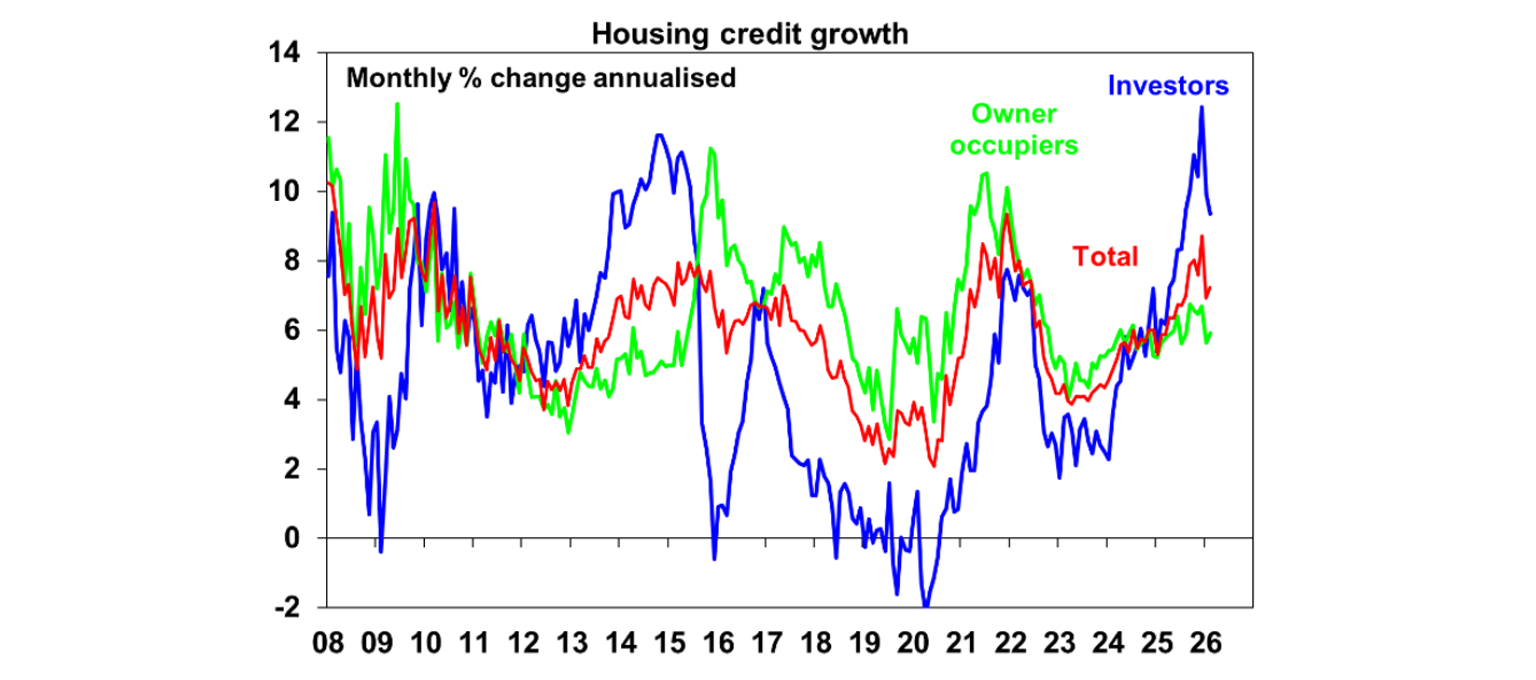
The softer picture in home sale volumes is also showing up in credit growth. Total housing credit growth remained stable at 0.6%mom, but the rise in investor loans is moderating from the record levels of last year, while owner-occupier housing remained depressed versus the highs in 2021-22 – see the chart below. Business loan growth was still strong at 0.8%mom or 9.5% over the year – which corroborates the RBA assessment that financial conditions in Australia have not been particularly restrictive.
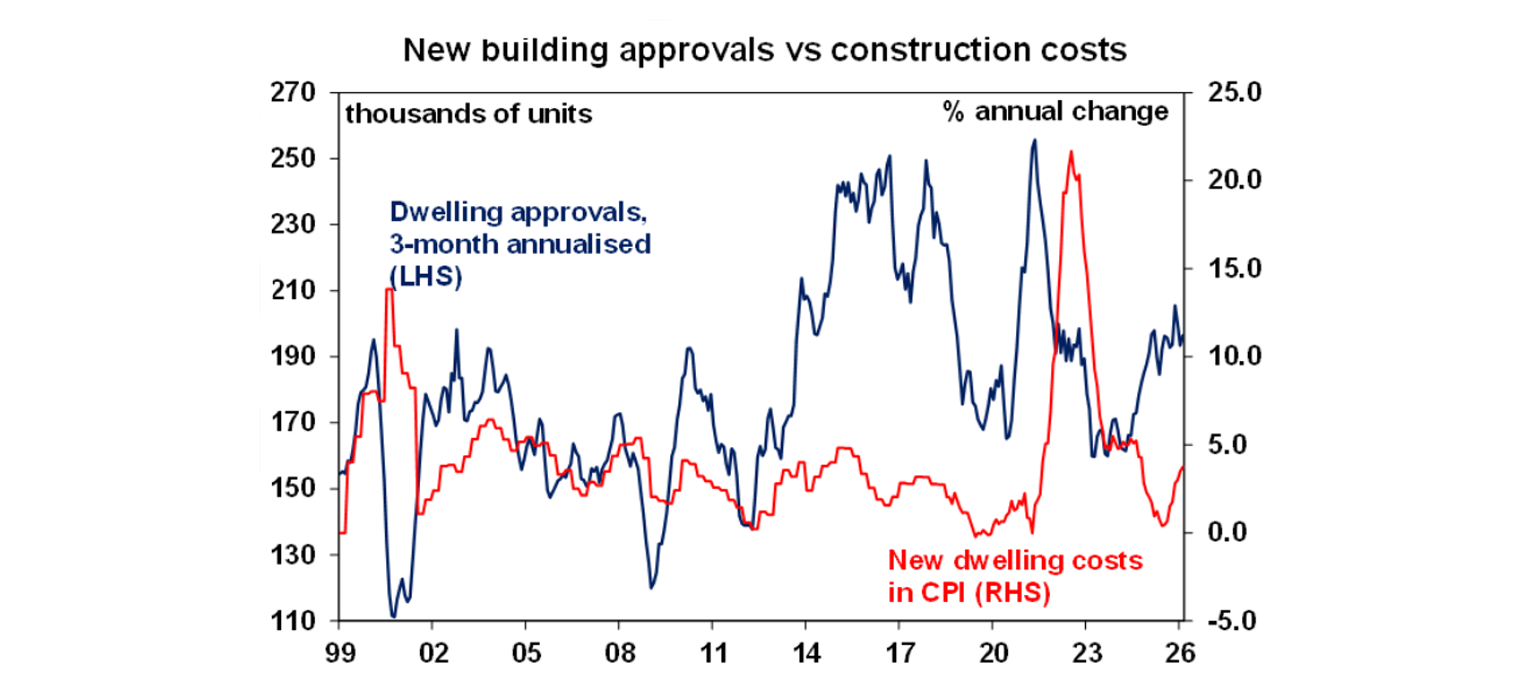
Despite multiple headwinds to the housing market, including rate hikes, depressed consumer sentiment, and low affordability, we continue to see positive growth for property prices this year around 3-5%yoy. This is because in the near term, the labour market is expected to hold up which means that existing homeowners can still service their mortgages, keeping listing supply low. And in the medium-term, new housing supply is still not expected to alleviate in the shortage of the past few years. While February building approvals rose a very large 30% versus January, this was solely driven by a doubling of apartment approvals following previous declines. New dwelling approvals are now running around 195k pa which is roughly balanced versus the current pace of population growth, but we expect them to decline from here as construction costs are on the rise.
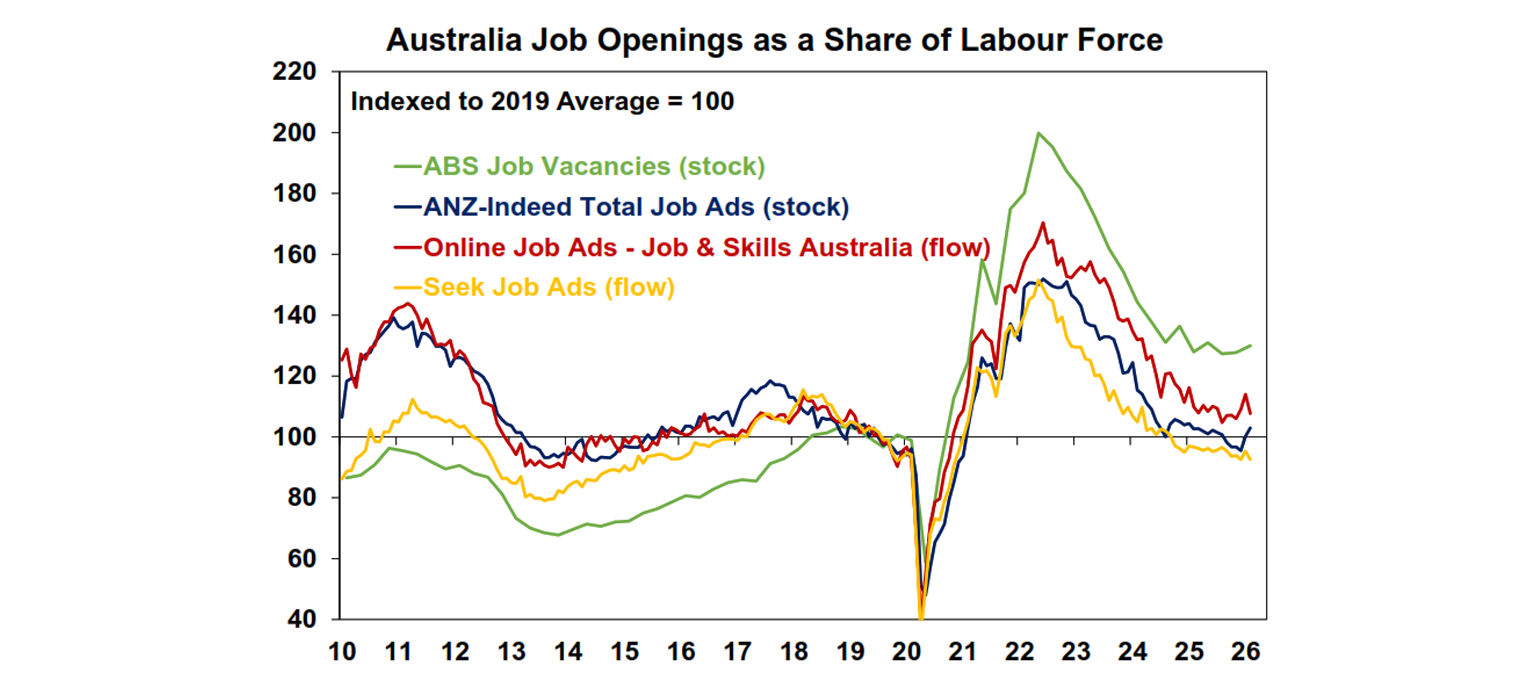
Job openings increased by 2.7% over the three months to February in Australia, driven by construction industry, retail trade, as well as accommodation and food services. As a share of the growing labour force, vacancies also rose by 1.8%qoq and confirmed that the labour market has been tightening since late 2025, in line with other measures of job advertisements.
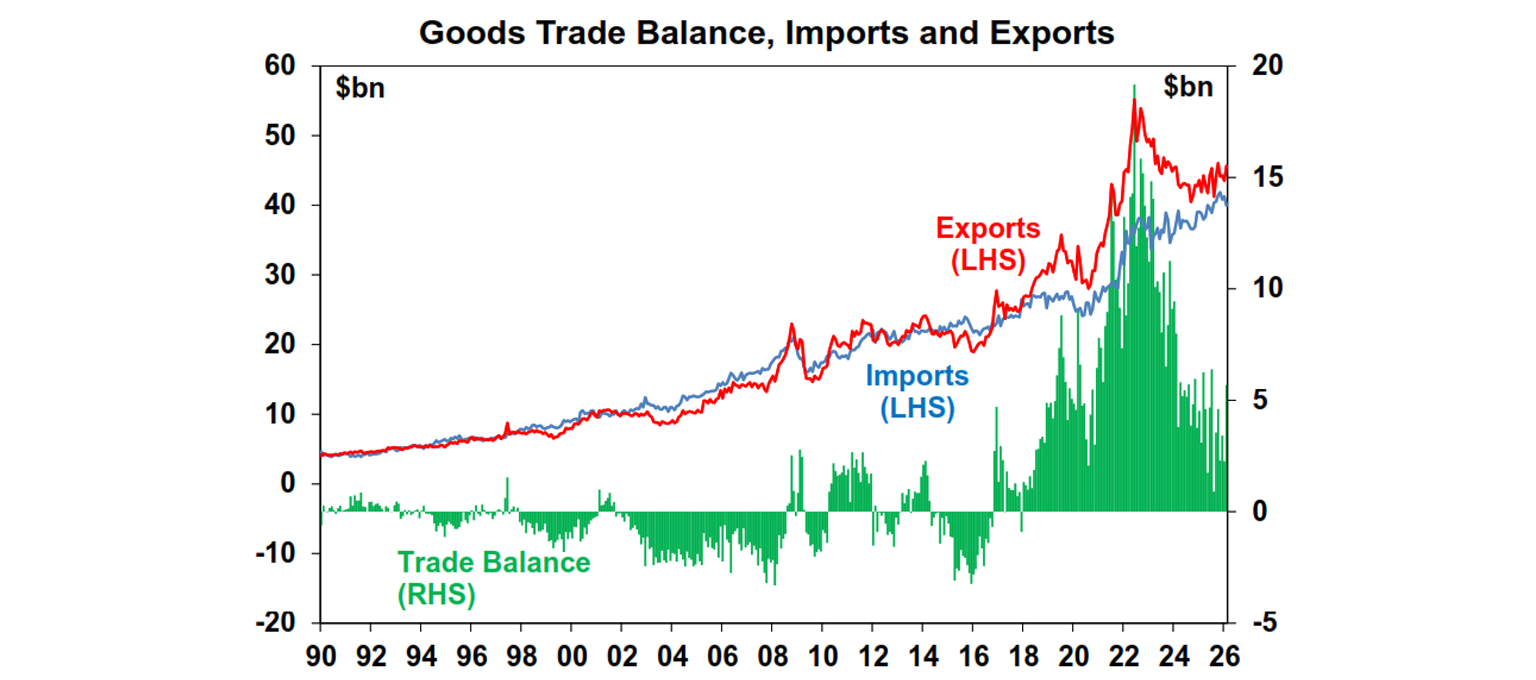
Australian goods trade balance increased to $5.7bn in February from $2.3bn prior, as exports rose 4.9% over the month (thanks to rises in gold exports, offsetting falls in most mining products). Meanwhile imports fell by 3.2%mom, driven by volatile equipment imports. This is old news though as both coal and iron ore prices have gone up materially in March, which will likely deliver a further boost in exports revenues.
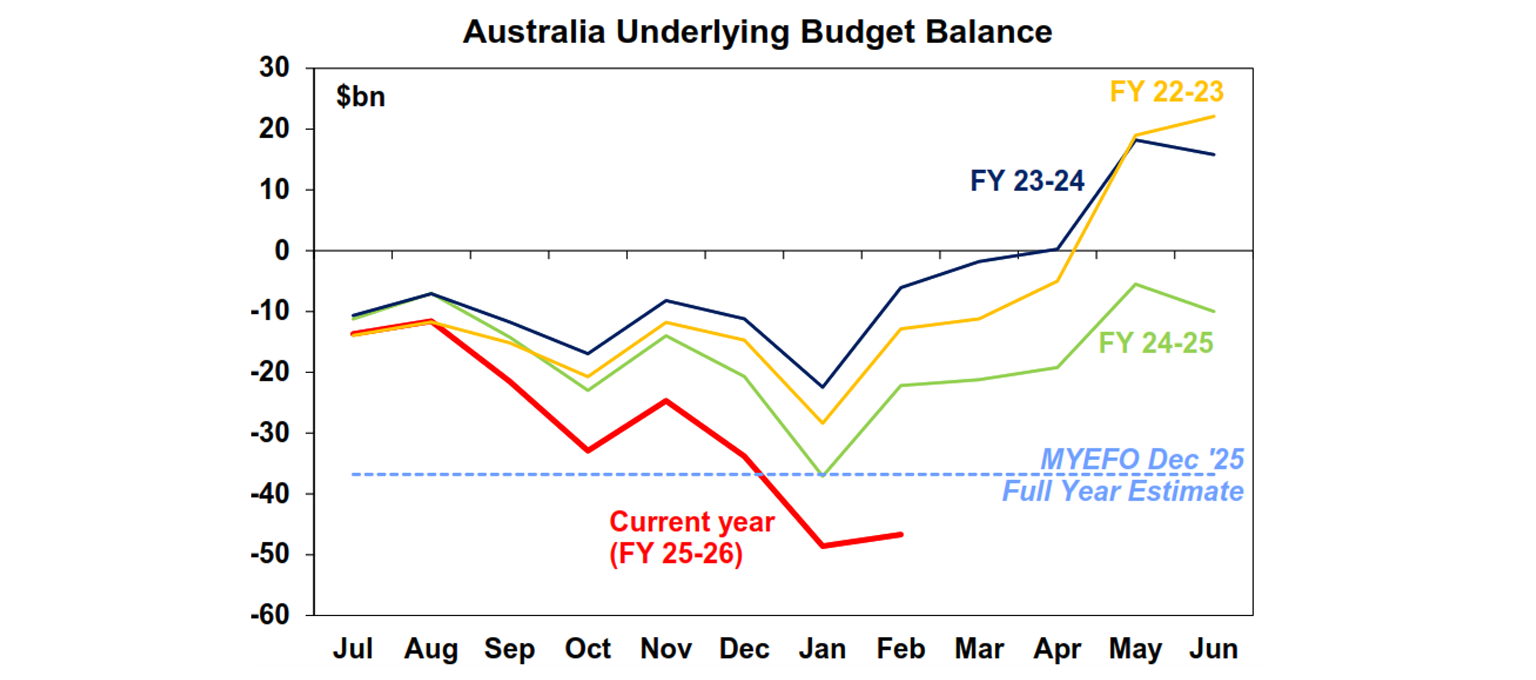
Finally, Federal budget data up to February shows the 2025-26 budget deficit running about $7bn better than expected which is good news. But it’s still showing a clear deterioration and the seasonal pickup in February is much less than prior years. While higher commodity prices lately will still provide a boost to the year-end budget balance (eg. iron ore averaging US$98/ton so far this financial year versus Treasury assumption of a decline to US$60/ton), there are clearly a lot of spending pressures from the government as we have covered above, so it is likely we’ll see a widening in deficit over the next two years.
What to watch over the week ahead?
In the US, markets continue to assess the impact of the war in Iran, and all eyes will be on the number of ships passing through the Strait of Hormuz. The FOMC minutes on Thursday will focus on the potential impact of higher energy prices on inflation and growth, while March inflation data (Friday) is likely to show a large 1% monthly rise which pushes up annual headline CPI to 3.4%, though core inflation will be milder.
In Australia, the Household Spending Indicator for February (Tuesday) will likely show a 0.2% monthly rise, translating into a 4.6% annual pace which is still very decent. This will be old news though as it predates the fuel shock in March.
The Reserve Bank of New Zealand is meeting on Wednesday and is expected to hold rates steady, but the focus will be on the Bank’s assessment of the energy price shock.
Outlook for investment markets
Global and Australian share markets are at high risk of further falls in the near term in response to the War with Iran against the backdrop of stretched valuations, political uncertainty associated with Trump & the midterm elections, increasing worries about private credit and AI & tech valuation worries. We continue to see a 15% or so top to bottom fall in share markets along the way this year, but the risk is that it could go deeper the longer the Strait of Hormuz remains effectively closed. However, returns should still be positive for the year as a whole thanks to Fed rate cuts likely later in the year, Trump still likely to pivot to consumer friendly policies ahead of the midterms and solid profit growth.
Bonds are likely to provide returns around running yield.
Unlisted commercial property returns are likely to be solid helped by strong demand for industrial property associated with data centres.
Australian home price growth is likely to slow to 5% or less due to poor affordability and the RBA raising rates with talk of more to come.
Cash and bank deposits are expected to provide returns around 4.3%.
The $A is likely to rise as the interest rate differential in favour of Australia widens as the Fed cuts and the RBA hikes. Fair value for the $A is around $US0.72.
You may also like
-

Oliver's insights Economics of happiness 28 July 2026 . The basic “economic problem” which economics is focussed on solving is: how to maximise utility or satisfaction when human wants are unlimited but resources available to satisfy those wants are limited. Of course, utility is basically happiness, so economics is all about happiness. -

Weekly market update - 24-07-2026 Renewed global worries weighed on the Australian share market which fell around 0.3%, but with its lower exposure to tech shares providing some protection. -

Oliver's insights Charts to watch 21 July 2026 Share markets had a strong first half despite the oil supply shock as expectations for de-escalation, okay economic data, strong profits and the AI boom provided an offset.
Important information
Any advice and information is provided by AWM Services Pty Ltd ABN 15 139 353 496, AFSL No. 366121 (AWM Services) and is general in nature. It hasn’t taken your financial or personal circumstances into account. Taxation issues are complex. You should seek professional advice before deciding to act on any information in this article.
It’s important to consider your particular circumstances and read the relevant Product Disclosure Statement, Target Market Determination or Terms and Conditions, available from AMP at amp.com.au, or by calling 131 267, before deciding what’s right for you. The super coaching session is a super health check and is provided by AWM Services and is general advice only. It does not consider your personal circumstances.
You can read our Financial Services Guide online for information about our services, including the fees and other benefits that AMP companies and their representatives may receive in relation to products and services provided to you. You can also ask us for a hardcopy. All information on this website is subject to change without notice. AWM Services is part of the AMP group.