





Oliver's insights
The Australian home price downturn deepened in August, with more to go
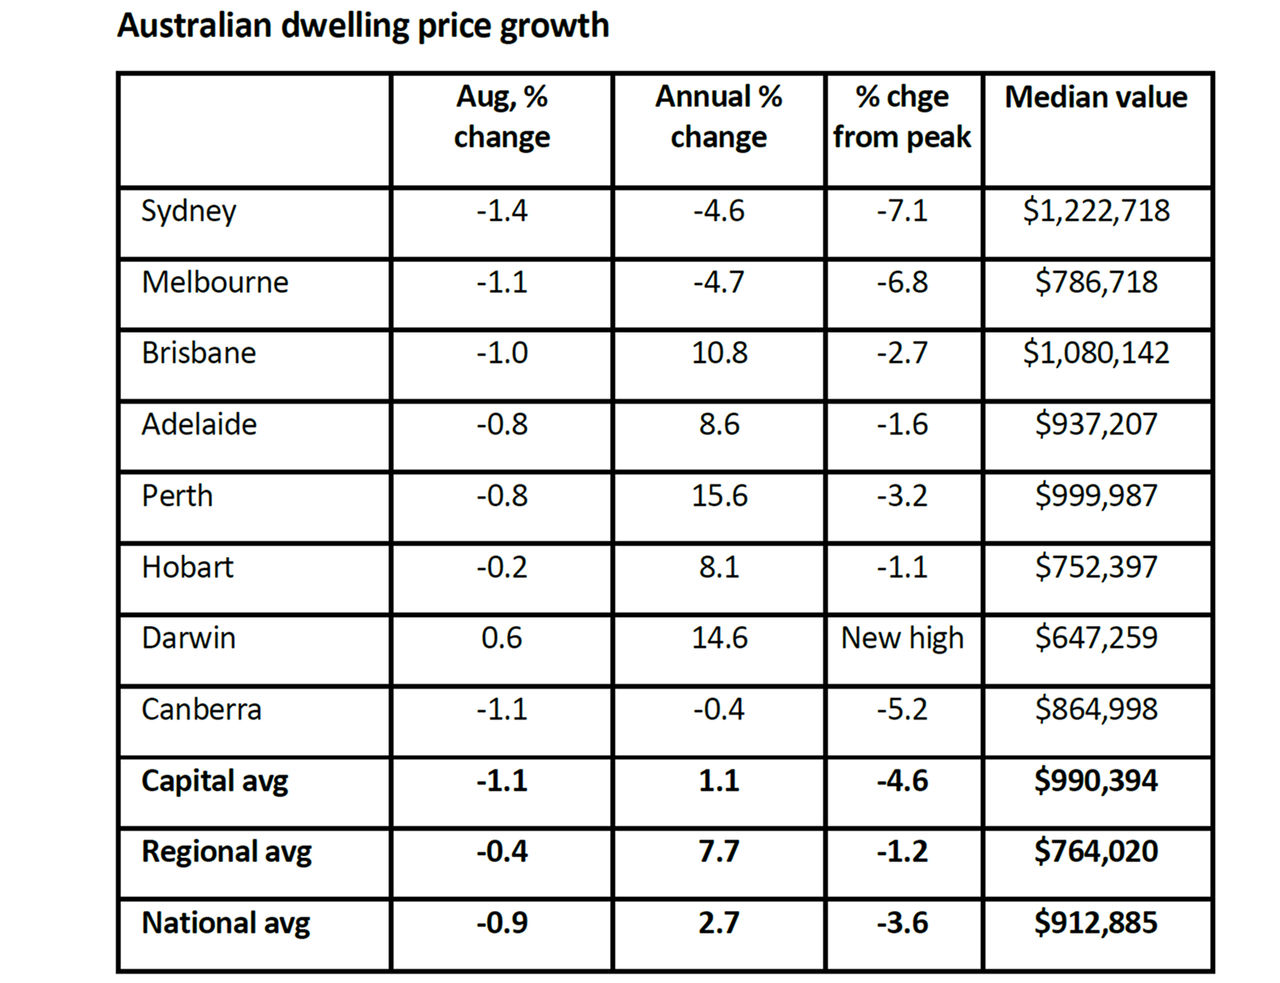
Cotality data shows national average home prices fell 0.9% in August, with capital city prices down 1.1%, their fifth monthly fall in a row. This followed a fall of 1.2% in July which had been revised from 0.7%. Prices nationally have now fallen 3.6% from their high.
6 min read
Key points
- The slump in national average home prices continued in August with prices down 0.9% according to Cotality, their fifth monthly fall. The fall in July was revised down to -1.2%.
- Further falls are likely as we continue to expect another RBA rate hike by November, possibly in September, the negative impact on investor demand from the tax changes will impact for a while and confidence is likely to remain weak.
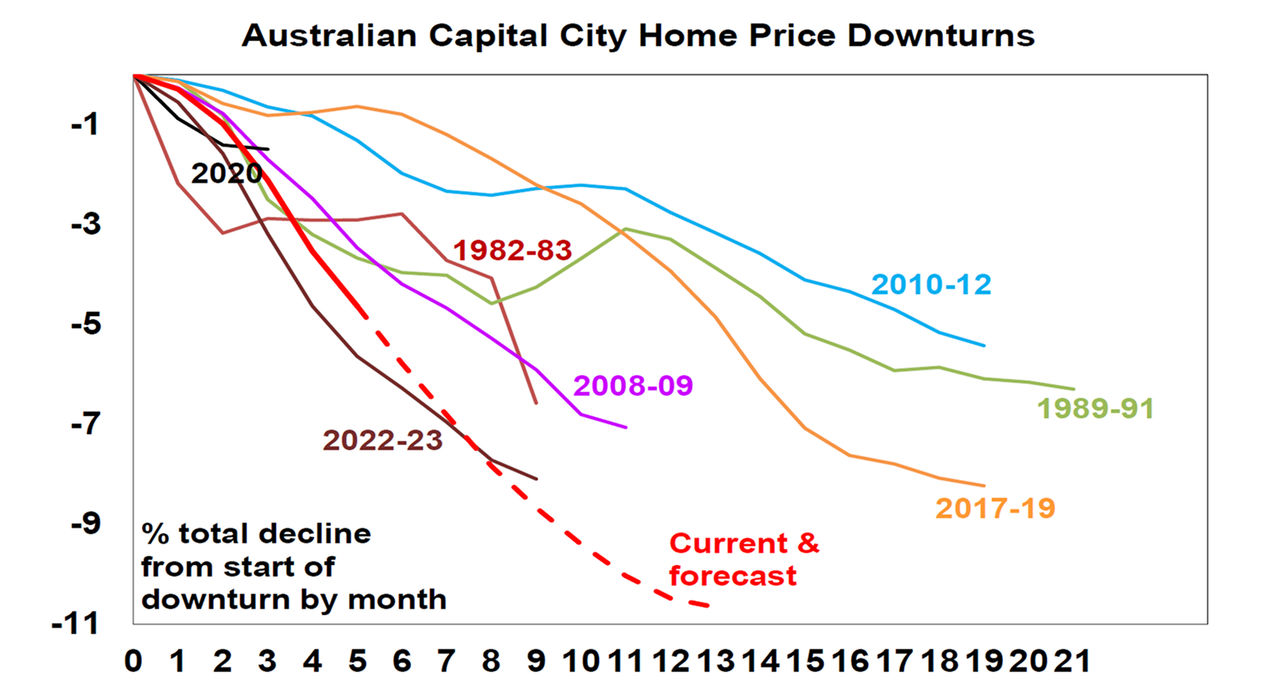
- We now expect national average property prices to have a top to bottom fall in prices of around 10%, of which they have done 3.6% so far. Capital city prices are likely to see a top to bottom fall of 11%, with Sydney around 13% of which its already done 7.1%.
- The home price slump will weigh on economic growth, but is not significant enough yet to change the direction of the RBA rate moves from up to down given high inflation.
Introduction
Cotality data shows national average home prices fell 0.9% in August, with capital city prices down 1.1%, their fifth monthly fall in a row. This followed a fall of 1.2% in July which had been revised from 0.7%. Prices nationally have now fallen 3.6% from their high.
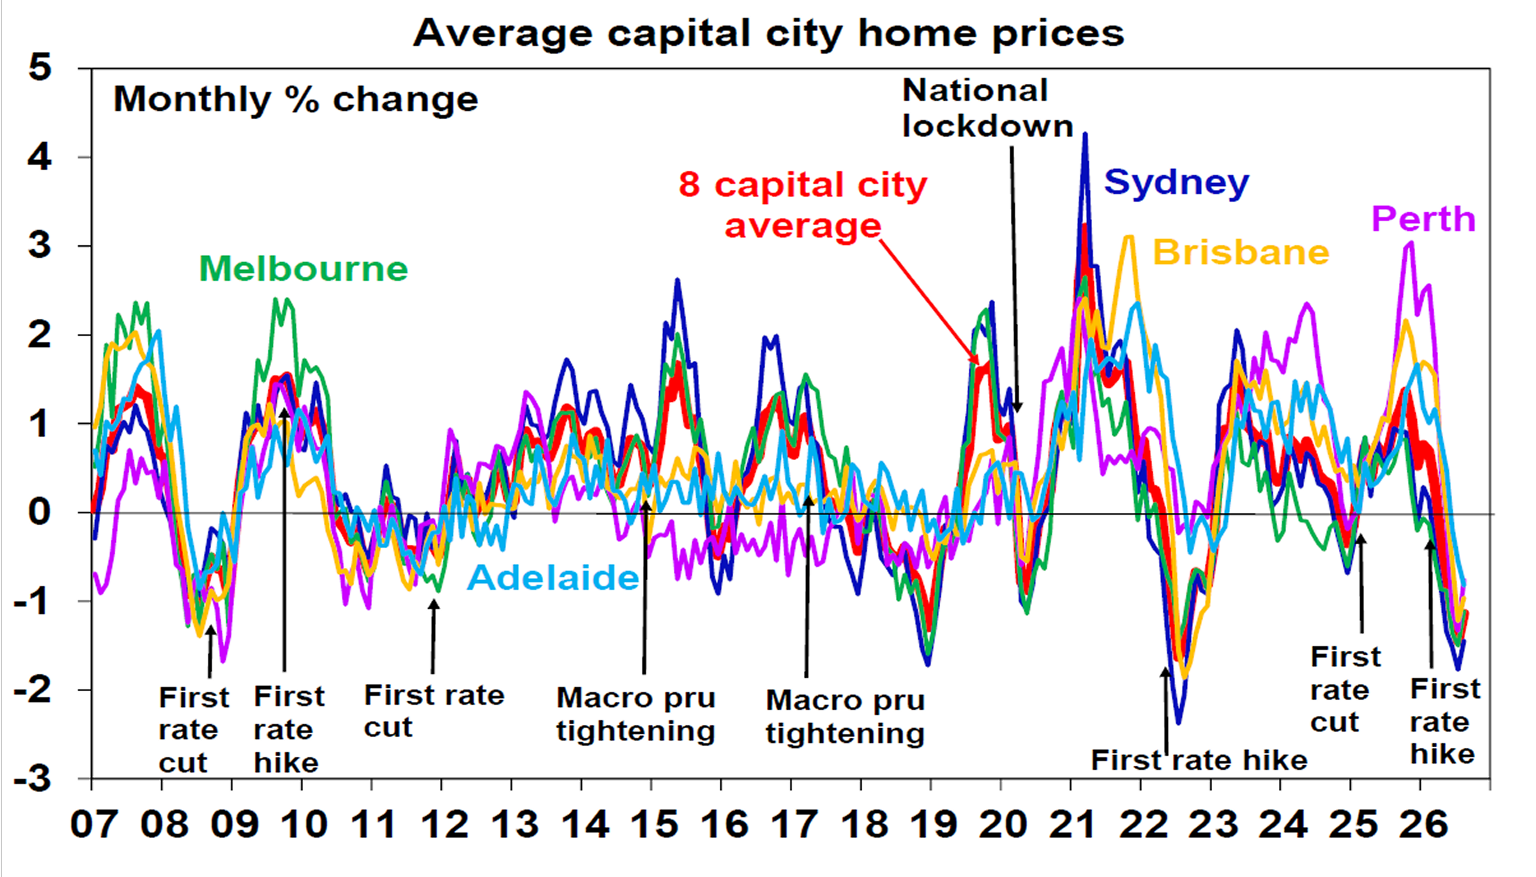
The downturn in the property market started to get underway late last year and reflects a combination of rate hikes, the Budget tax hikes on investors, poor affordability and depressed buyer confidence. The expansion of the 5% low deposit scheme for first home buyers combined with poor affordability pushing buyers into lower price points is showing
We expect a 10% top to bottom fall in home prices
While the housing shortage, weak new listings and the expanded 5% first home buyer deposit scheme should help head off a crash in property prices (say 20% plus), the Australian housing market is likely to weaken further as higher mortgage rates, the removal of most property tax concessions, record poor affordability and poor confidence impact.
- Rate hikes – we continue to expect one more rate hike by year end as inflation is still too high and likely to take too long to get back to target threatening higher inflation expectations. Rate hikes have usually been associated with some softening in property prices or slower growth. This is because they cut how much buyers can borrow, hit confidence and can boost distressed sales.
- The Budget tax hikes on investors - the move to curtail access to negative gearing and return to the taxation of real capital gains with a minimum tax rate of 30% is driving a big decline in investor demand for residential property in the near term because it means a significantly lower after-tax return for investors. It makes sense for investors to sit on the sidelines until they see lower prices or higher rents or some combination of the two resulting in a higher starting point rental yield before they invest to compensate for the higher tax rate they now face. Given that we have not seen such a structural change like this for decades it means significant uncertainty around the size of the impact with the risk likely on the downside for prices.
- Poor buyer confidence – while there has been some improvement from recent lows consumer confidence remains depressed as are perceptions of whether it’s a good time to buy a dwelling.
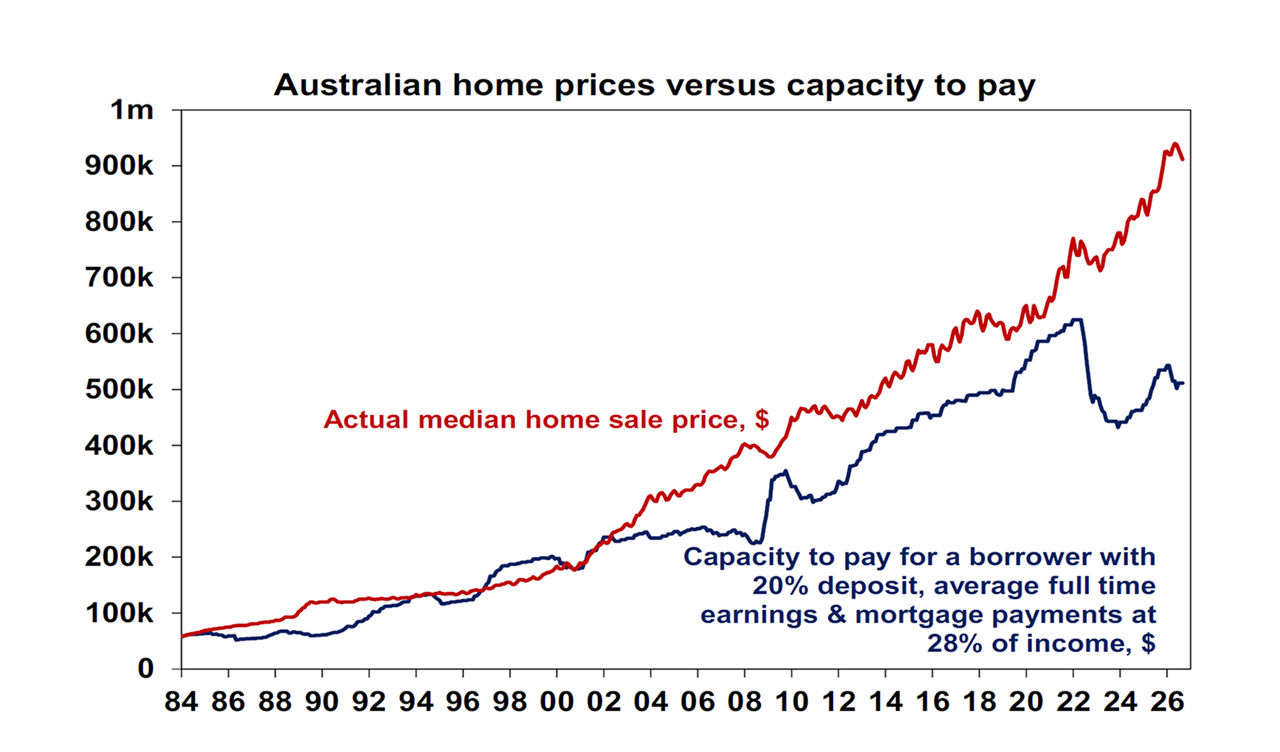
- Poor housing affordability - the ratio of home prices to wages and incomes is still around record levels. In combination with the rise in mortgage rates this has led to a widening gap between home prices and what an average buyer can afford to pay for a property. While home prices have fallen recently, as can be seen in the next chart it’s just a flick off the top after a 50% surge since the pandemic and some of the benefit has been offset by the impact of higher mortgage rates.
With a near perfect storm continuing to hit the property market, further price falls are likely and reflecting the recent acceleration in falls we now expect a top to bottom fall in national average property prices of around 10% (revised from 7% previously). This is deeper than the range of average capital city property price declines seen over the last 40 years or so but is consistent with the increase in taxation of investors which represents a significant structural change for the property market along with the RBA likely to take the cash rate above its last cyclical high. This involves a 6% fall this calendar year and an 8% fall in the current financial year. Given the uncertainty around the full impact of the property tax changes on demand and the upside risk to interest rates, the risk remains on the downside. For capital cities we expect an 11% top to bottom fall.
We continue to expect a wide divergence between cities and property types. In terms of price to rent ratios adjusted for inflation as a rough guide to whether a market is over or under valued, houses are 38% overvalued nationally compared to units at just 8%. So, houses overall are far more vulnerable to a fall in prices than units are. In terms of houses, Brisbane, Adelaide, Sydney and Hobart are the most overvalued and vulnerable and so are likely to see falls in excess of 11% top to bottom. And in terms of units, Brisbane, Adelaide and Canberra are the most vulnerable. Melbourne is the least vulnerable city.
The end of the 30-year super cycle property upswing?
The combination of a rising long-term trend in mortgage rates after the long term down trend that ran from 1989 (when they peaked at 17%) to 2021 (when they bottomed around 2%), the virtual removal of property tax concessions, record poor affordability and a political shift towards lower immigration may mean the 30-year super cycle upswing in home prices may be at or close to over. This saw average property prices rise dramatically faster than their long-term trend and incomes since the mid 1990s. In particular, the swing from a long term down trend in interest rates to what now looks to be a rising trend combined with a far less favourable tax treatment of property investors are major structural changes that both point to higher residential property rental yields, via some combination of higher rents and lower than otherwise prices. This could start to reverse some of the downswing in rental yields that was a key aspect of the super cycle upswing in property prices over the last three decades, particularly for houses. If the property super cycle upswing is over it could mean a decade or so of real house prices ranging sideways and a moderation in home price to income ratios. Of course, the ongoing housing shortage remains and is the key sticking point, so it’s hard to be definitive as to whether the property super cycle has ended or not!
The property price downturn and the economy
There are several implications from the slump in home prices for the economy. In particular:
- A drag on consumer spending – with the RBA estimating a few years ago that a 10% fall in home prices will reduce consumer spending by around 0.8% after two quarters and 1.6% over the long run;
- Less incentive to build new homes – as established dwellings fall in price relative to increasingly costly new dwellings. This could have a further adverse impact on the economy via less home building and less demand for goods and services that flow from that;
- Taken together less consumer spending and less home building will mean less demand in the economy so eventually it should start to contribute to a fall in inflationary pressures, but it’s still early days;
- Increased negative equity – where a homeowner’s mortgage debt is worth more than their home. This is estimated to be low at present and is really only an issue (beyond the wealth effect) if the homeowner has to sell. But it will impact those who bought say around the end of last year with small deposits and could become an issue if unemployment rises.
- Rising bad loans for the banks and less demand for credit – the former is not a major problem as they have significant capital reserves but the latter has started to weigh on their share prices through the recent reporting season.
At a high level this means that the home price downturn will mean less upwards pressure on interest rates. At present though the fall in prices is not enough to offset the problems the RBA faces around excessive inflation and so it’s unlikely to prevent a further interest rate hike (or two) by the RBA. However, if as we expect the property price downturn continues into next year it will likely eventually become a factor in seeing rates peak and the RBA pivot towards rate cuts later next year.
What to watch?
The key things to watch with respect to the next 12 months will be interest rates, consumer confidence, unemployment and investor demand. Several more rate hikes, a sharply rising trend in unemployment and a big drying up in investor demand could result in much bigger price falls than the top to bottom 9% fall that we are expecting. Overall, the risks for home prices over the next 6-12 months seem skewed to the downside but note that in the absence of much higher unemployment causing forced or distressed sales, a property price crash (say a 20% fall or more) is unlikely. A crash would require wide scale forced selling by homeowners – but without much higher unemployment forcing homeowners to sell this is unlikely. Note that both New Zealand and Canada which have seen 15-20% home price falls have much higher unemployment at around 5.6% and 6.4% respectively compared to 4.5% in Australia.
Dr Shane Oliver
Head of Investment Strategy and Chief Economist, AMP


Something went wrong. Please try again.
Thanks for subscribing.
We'll keep you up to date with the latest news, insights and information from AMP. Check your inbox for future updates.
You may also like
-

Weekly Market Update - 09-10-2026 - AMP Weekly Market Update: US shares near record highs but risks are bubbling, tech rally remains narrow, credit markets turn wary on AI & Firmus IPO shelved, French bond yields surge, and another immigration debate. -

Five things that could stop the data centre boom As agentic commerce agents become an increasingly common way to shop, learn the risks that may come with them, and some ways to use them more safely. -

What are AI shopping agents, and are they safe to use As agentic commerce agents become an increasingly common way to shop, learn the risks that may come with them, and some ways to use them more safely.
Important note
While every care has been taken in the preparation of this document, neither National Mutual Funds Management Ltd (ABN 32 006 787 720, AFSL 234652) (NMFM), AMP Limited ABN 49 079 354 519 nor any other member of the AMP Group (AMP) makes any representations or warranties as to the accuracy or completeness of any statement in it including, without limitation, any forecasts. Past performance is not a reliable indicator of future performance. This document has been prepared for the purpose of providing general information, without taking account of any particular investor’s objectives, financial situation or needs. An investor should, before making any investment decisions, consider the appropriateness of the information in this document, and seek professional advice, having regard to the investor’s objectives, financial situation and needs. This document is solely for the use of the party to whom it is provided. This document is not intended for distribution or use in any jurisdiction where it would be contrary to applicable laws, regulations or directives and does not constitute a recommendation, offer, solicitation or invitation to invest.