


Weekly market update
Investment markets and key developments
News surrounding the war between the US, Israel and Iran dominated global markets this week. Since the coordinated attacks from Israel and the United States on Iranian sites on 28 February, global shares have been largely down (unsurprisingly!), albeit with divergence across regions: the S&P 500 was down by 2.0% and Chinese shares are down 1.1%; while Australian shares were in the middle of the pack, down 3.8% so far
12 min read

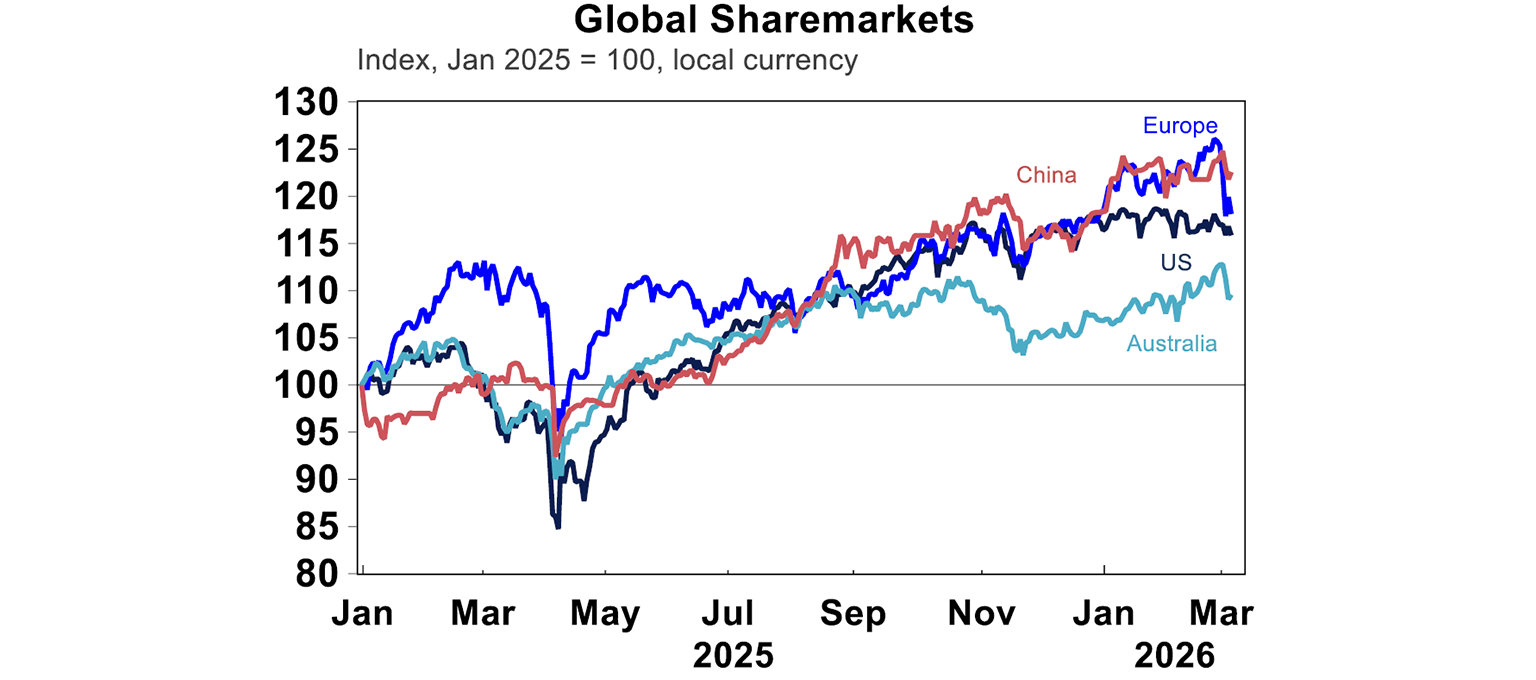
News surrounding the war between the US, Israel and Iran dominated global markets this week. Since the coordinated attacks from Israel and the United States on Iranian sites on 28 February, global shares have been largely down (unsurprisingly!), albeit with divergence across regions: the S&P 500 was down by 2.0% and Chinese shares are down 1.1%; while Australian shares were in the middle of the pack, down 3.8% so far. On the other end, European shares have fallen by 6.8%, Japanese shares fell 5.5% and the Korean KOSPI dropped by 10.6% over the five days – all are countries with relatively higher energy dependence on imports.
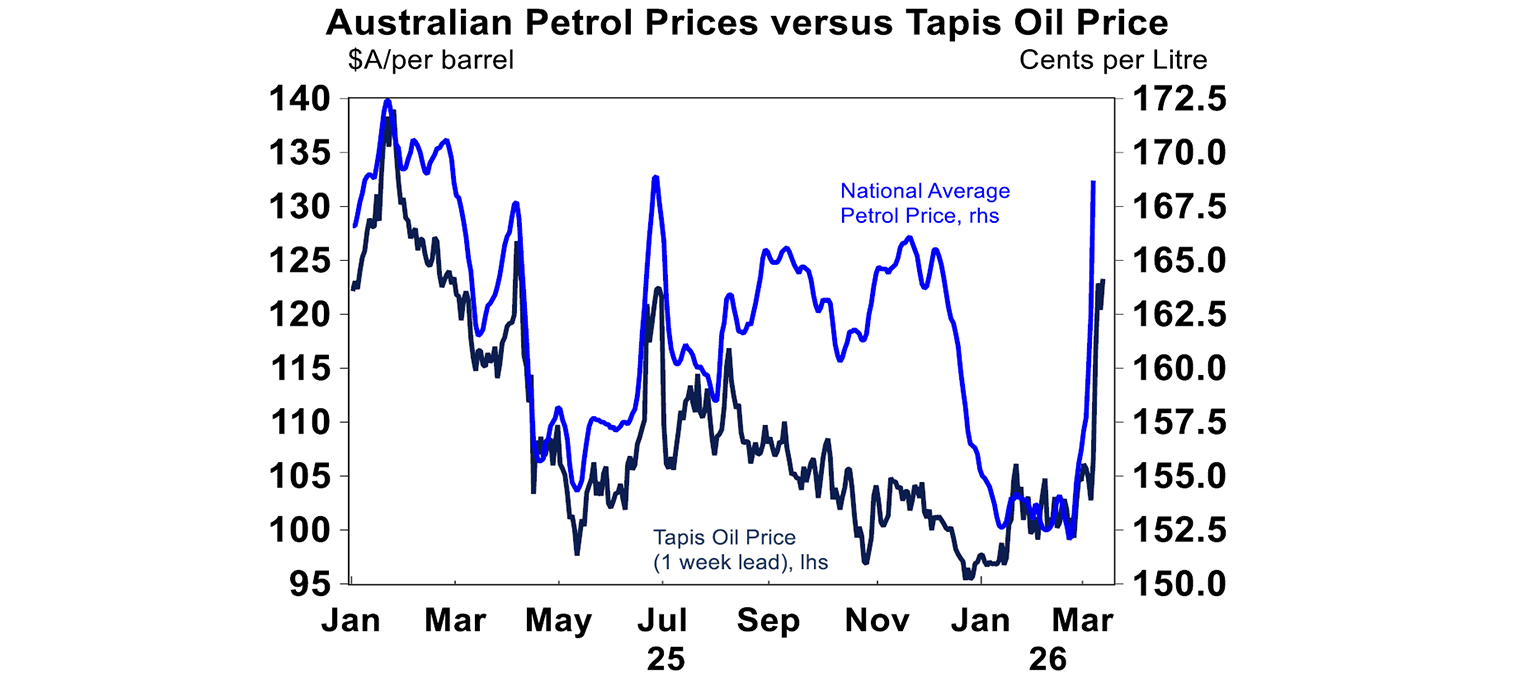
While tensions around Iran have already been built up in the past few months, this time feels different given the broad-based military strikes on Iranian targets with a goal of a regime change, including an assassination of the Iranian Supreme leader Khamenei and other officials. In retaliation, Iran has launched drones and ballistic missiles at US military bases in other neighbouring oil producers throughout the Persian Gulf, including in Kuwait, Qatar, Saudi Arabia and the UAE. While Iran only accounts for less than 5% of global oil production and other countries have spare capacity to offset this supply loss, alternative shipping routes are not yet equipped to quickly replace the volume of supply passing through the Strait of Hormuz, which is currently effectively shut, despite Donald Trump’s promise to provide insurance and escort oil tankers to cross “as soon as possible”. It is estimated that around a quarter of global oil supply pass through the strait, with the bulk going to China (33%), India (14%), Japan (12%), South Korea (10%) and Europe (7%). Meanwhile almost all of Qatar’s LNG (20% of global supply) also transit through the waterway to be delivered to Europe and other East Asian countries. As a result, oil prices have risen sharply to around $90/bbl from around $67/bbl last week while the average Australian petrol price at the pump has already spiked to $1.69/litre (from $1.56/litre prior).
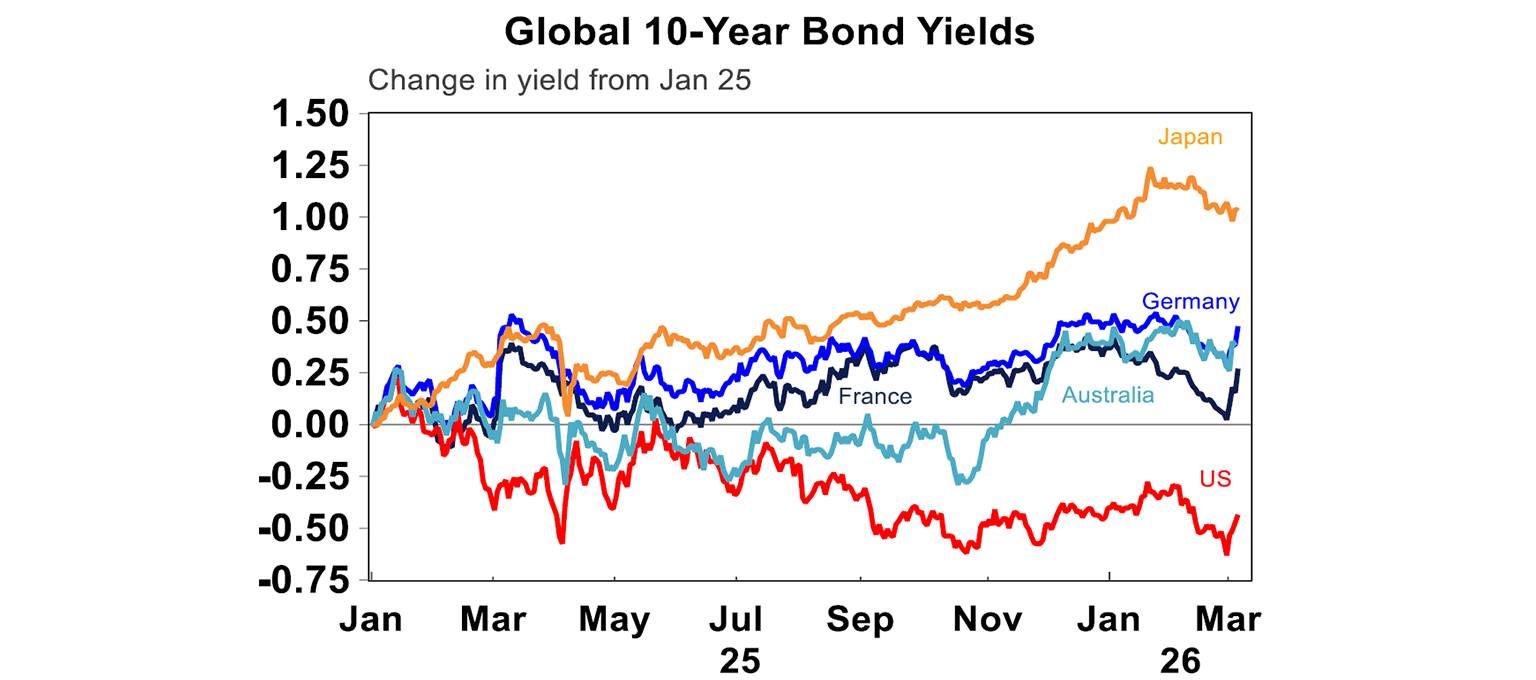
Rising oil prices, if persisted, have sparked fear of a global “stagflation” scenario through two channels. One, higher commodity prices (with oil up to $150/bbl in case of a prolonged war) and supply disruption could raise household energy costs and manufacturing input costs, while reducing households demand for discretionary consumption; and two, higher geopolitical risk and economic uncertainty will force households and businesses to delay big purchases, holding back investment plans while adopt higher borrowing costs. Australian exports revenues could also be impacted given lower global trade. In fact, markets have pushed back expectations for the timing of a Fed rate cut, with a full 25bps cut priced in by September at the moment, rather than by July a week ago, while futures’ bets have switched to a hike from a cut in the ECB rate in the next twelve months. Longer-term bond yields have also risen, with the US 10year increasing to 4.1% from 3.9% last Friday.
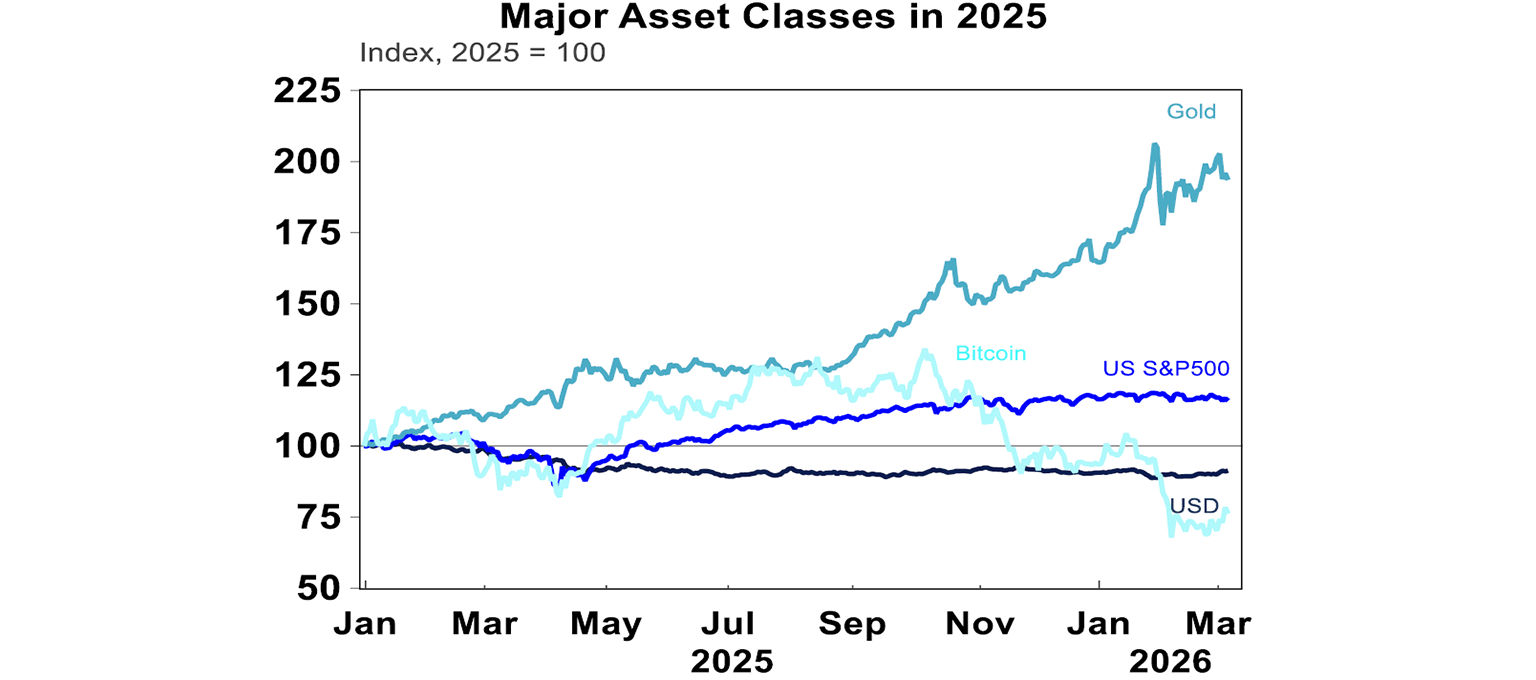
Surprisingly, bitcoin was up by 8.2% over the week (after already falling 25% YTD) while gold was down slightly (-3.5%) and the US dollar was broadly up.
Where to go from here? While there seems to be no end in sight as President Trump indicated that he was willing to fight for several more weeks using larger strikes and the Iranian leadership remained defiant, our base case is for Trump to find a way to declare victory before significant energy disruption and higher inflation expectations become entrenched. US voters’ number one concern remains inflation and affordability, and with the midterm elections coming up, it is likely that Trump will take an off-ramp to limit consumer dissatisfaction with rising gasoline prices. There is also limited domestic support from the MAGA base and even the Republican Congressmen for “forever wars”.
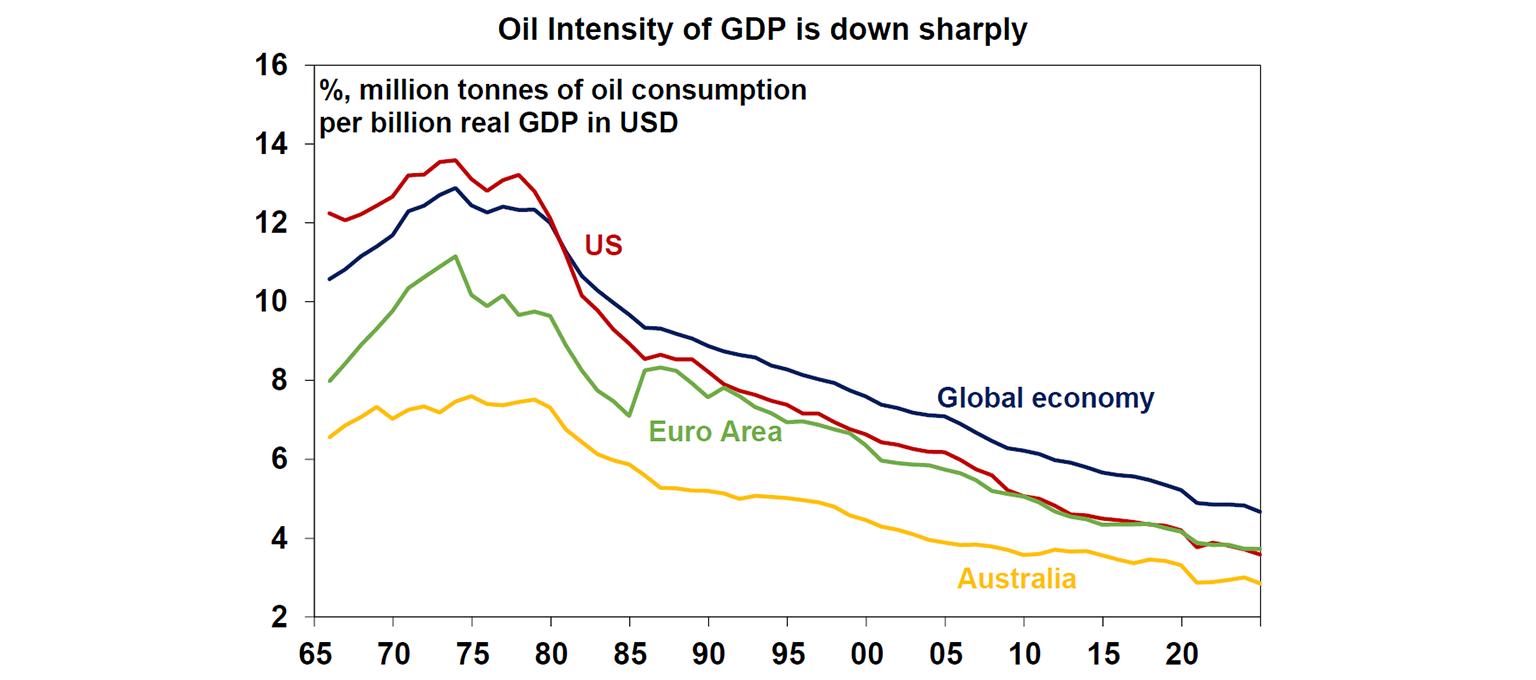
In addition, the economic impact of a spike in oil prices will be limited given that the amount of oil required to produce a unit of GDP around the globe has consistently fallen over the years (thanks to technological development, rising productivity, and a shift to alternative energy sources). In addition, the US is now a major exporter of crude oil while Australia is also a net exporter of energy, so rising commodity prices could boost national income. China, despite being the largest importer of both Iranian and global oil, has a 100-day import stockpile and an energy mix dominated by coal and renewables (rather than oil and gas).
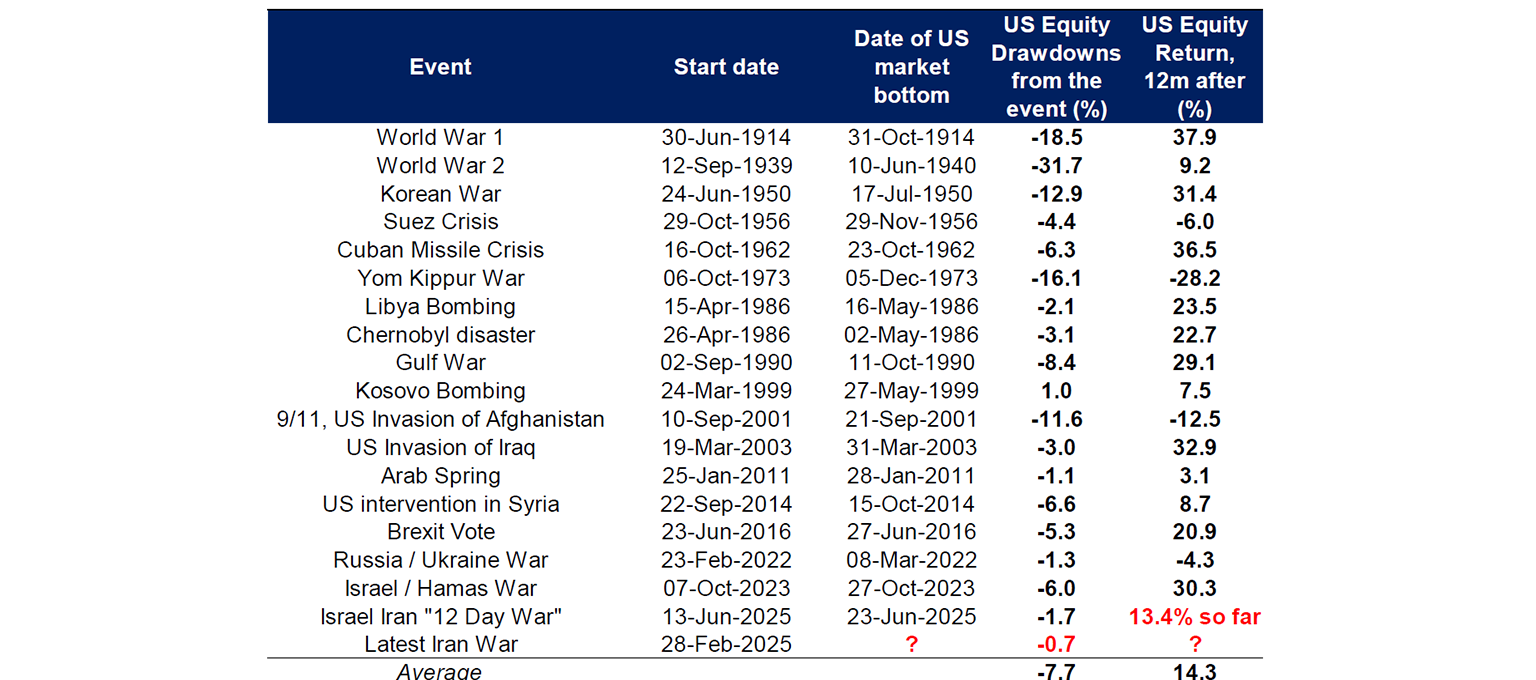
As a result, we continue to see positive returns for shares on a twelve-month basis, especially when US economic data has been resilient (see the Global events section below). Past conflicts have also seen some US equity drawdowns followed by stronger recovery a year later – see the chart below. Of course, things could get worse before it gets better!
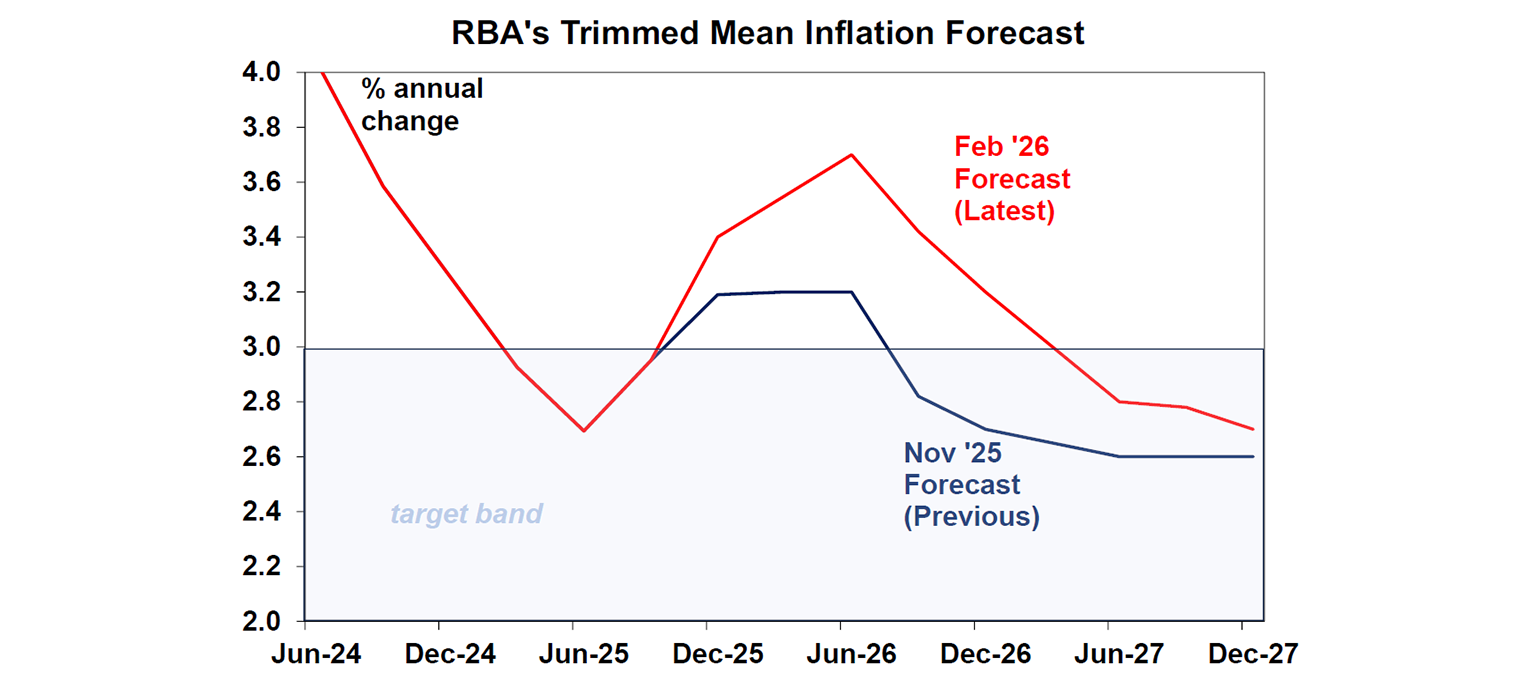
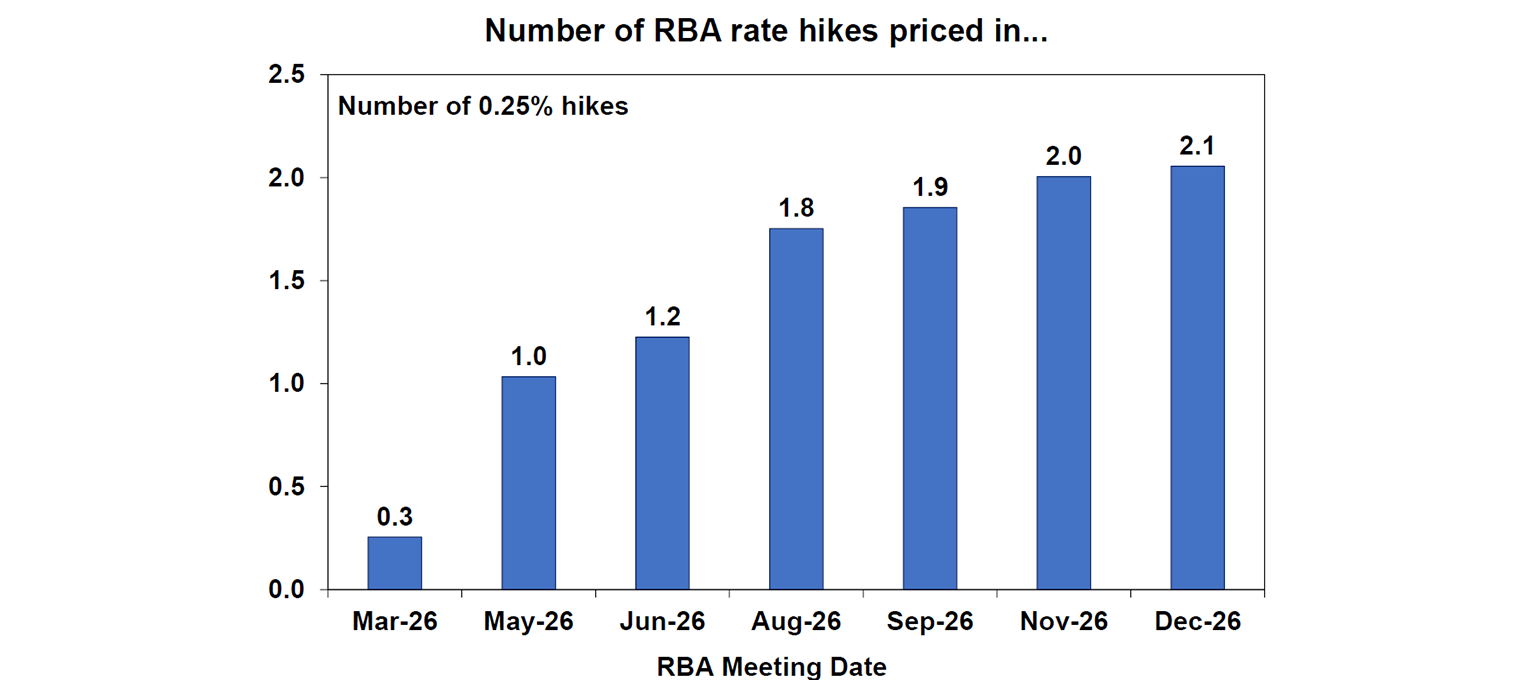
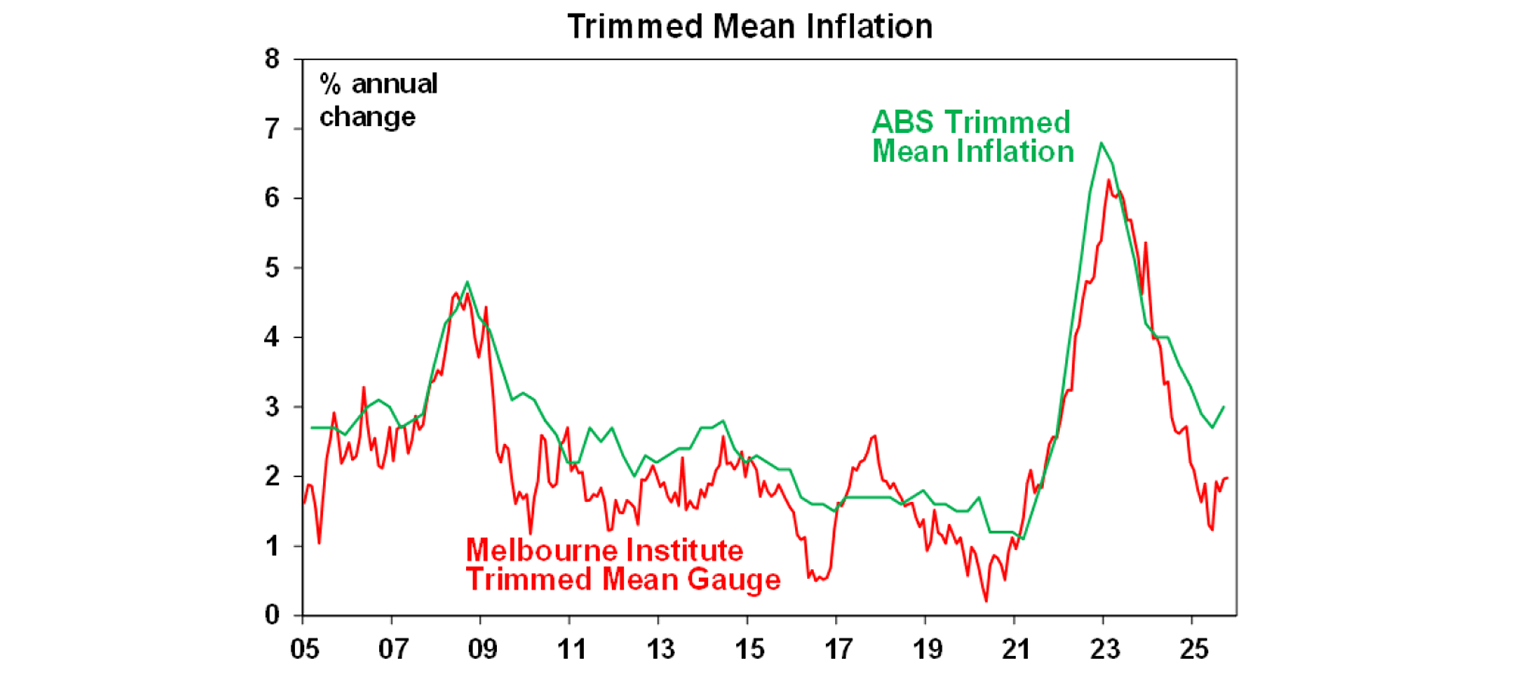
Australian economic data has been rather strong lately, which explains the RBA Governor Michelle Bullock’s hawkish commentary on Tuesday, following the Assistant Governor Sarah Hunter’s remarks on Monday. Both explained the rationale behind the recent rate hike decision: inflation towards 2H25 picked up a bit faster than expected, partly due to sector-specific demand which will likely ease but a large part still driven by economy-wide pressures, while the labour market data points to the risk that overall economic conditions are tightening. These are reasonable given recent upticks in inflation and declines in the unemployment rate. However, Governor Bullock also mentioned a risk of inflation expectation becoming unanchored, and stated that it is still uncertain whether financial conditions are restrictive enough for inflation to return to 2.5% in a “reasonable timeframe” (right now the RBA forecast is for trimmed mean to be above the 2.5% target until mid-2028, even with 1-2 more hikes in the next 2 years, see the chart below). This essentially indicates that if the inflation profile tracks close to the RBA forecast, then we’ll see more rate hikes to come. And most importantly, markets have repriced over comments about a “live” March meeting (in other words, the RBA does not need to wait for a quarterly inflation print to hike rates if necessary). Governor Bullock then also downplayed the impact of a rising $A on inflation, stating that the appreciation of the Aussie dollar is reflecting expectations for interest differentials which is part of the normal monetary policy mechanism.
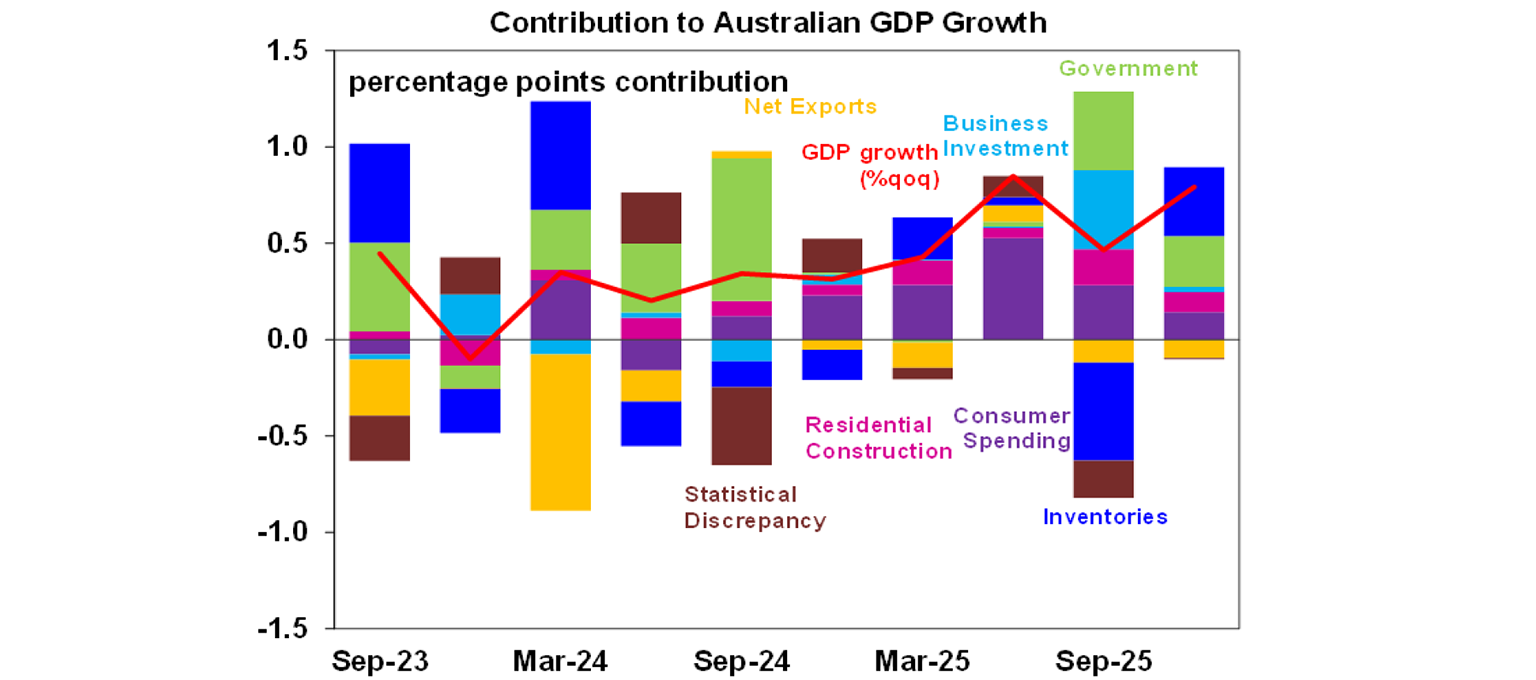
The RBA’s hawkish view certainly has merits, especially confirmed by the Australian GDP data released on Monday. The December quarter GDP increased by 0.8%qoq, similar to the RBA’s forecasts. However historical upward revisions meant that the annual growth ticked up to 2.6%yoy, which was the best result since early 2023 and much higher than the Reserve Bank’s estimate for the potential growth rate of ~2.2%. In other words, the economy was growing too hot versus its supply capacity, forcing inflation to turn up. Growth has been rather broad-based with contribution from both public and private sectors, and while private business investments were slightly more sluggish (light blue bar in the chart below), households’ consumption, government spending, and residential construction all contributed a decent chunk to the quarterly figures.
But overall, there are plenty of positives from the GDP report: Per capita GDP growth is now turning up at 0.4%qoq/0.9%yoy which means that the average living standard for Australians has completely improved for four consecutive quarters, following a disappointing contraction between mid-2023 to end-2024. And finally, the average cost of labour per unit of output slowed to 0.5%qoq (it was averaging around 1.5%qoq in prior quarters), which could lessen the RBA concerns about wages pressures translating into sticky inflation.
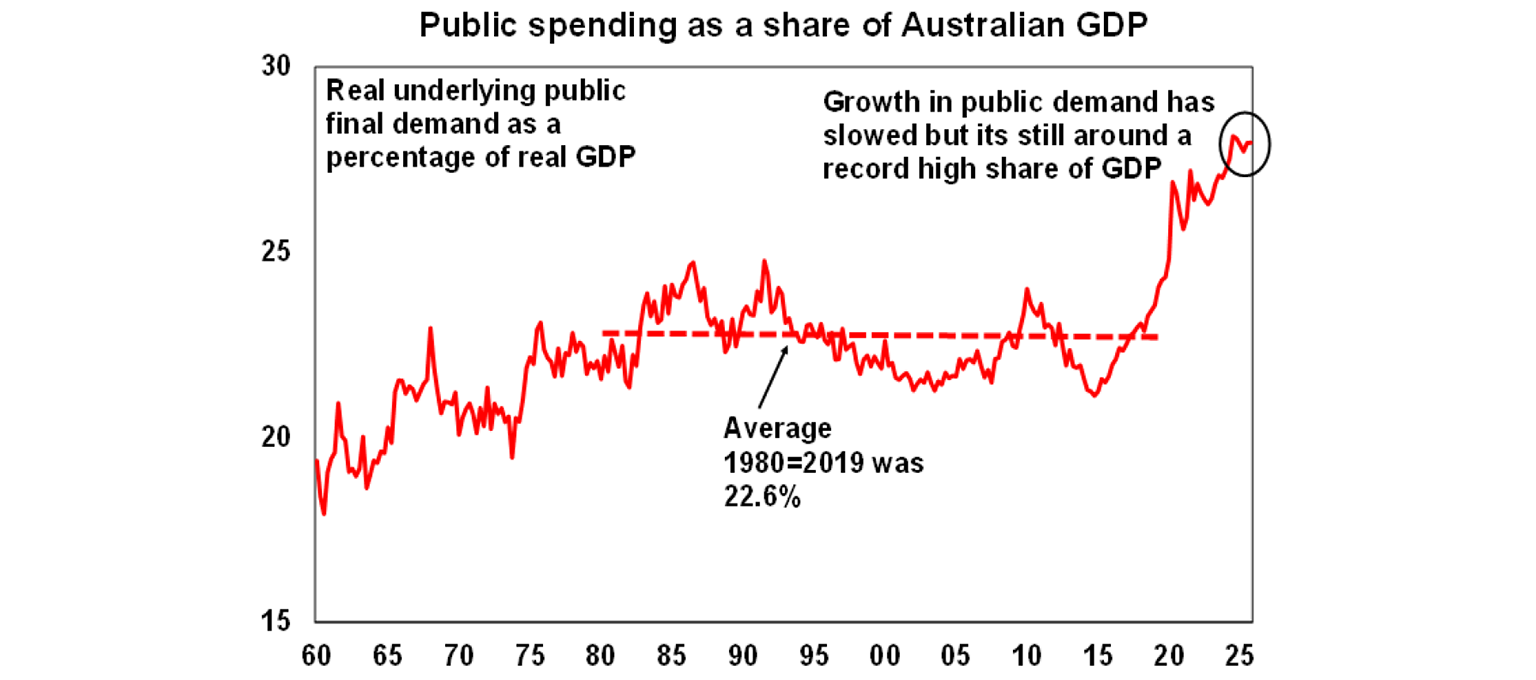
That being said, there are still three “bad” numbers from this GDP report that we would point out. One, government spending growth remained very high at 0.9%qoq (higher than GDP as well as most other sectors), driven by defence spending and transport infrastructure. After slowing somewhat in late 2024 and early 2025, the public sector is accelerating again, accounting for a near-record 28% share of the economy. While government spending is necessary, the fast growth at the same time the economy faces supply constraint has contributed to a pickup in inflation and arguably hurts productivity. In fact, the second worrying figure from the GDP report is growth in nonfarm productivity, only up 0.4% over the year despite a stronger 1%yoy headline number (because of sustained strength in agricultural productivity). And finally, consumer spending seems to have slowed in momentum. Household final consumption grew by 0.3%qoq or 2.4%yoy in the quarter, a big step down from 1%qoq in June and 0.5%qoq in the September quarter. Even excluding electricity, alcohol & tobacco (which has caused distortions because of rebates & excise taxes), consumption was only up by 0.6% over the three months. More significantly, the RBA was forecasting a much stronger 0.9%qoq/3.1%yoy growth from the household sector, so this was a rather big miss and could indicate that household spending momentum would slow quickly in the coming months.
In fact, a stepdown in the pace of spending growth has already been confirmed with the latest household spending indicator (see the Australian section below). The rate hike in February has also already negatively impacted consumer sentiment and we expect spending to moderate further in the coming months. As a result, we see the RBA remaining on hold in the March meeting to wait and assess the impact of the rate hike (and talks of rate hikes) on the consumer. A May hike remains a possibility, depending on the evolution of the monthly inflation data from here but more likely if the trimmed mean inflation measure comes out to be 3.6%yoy or above.
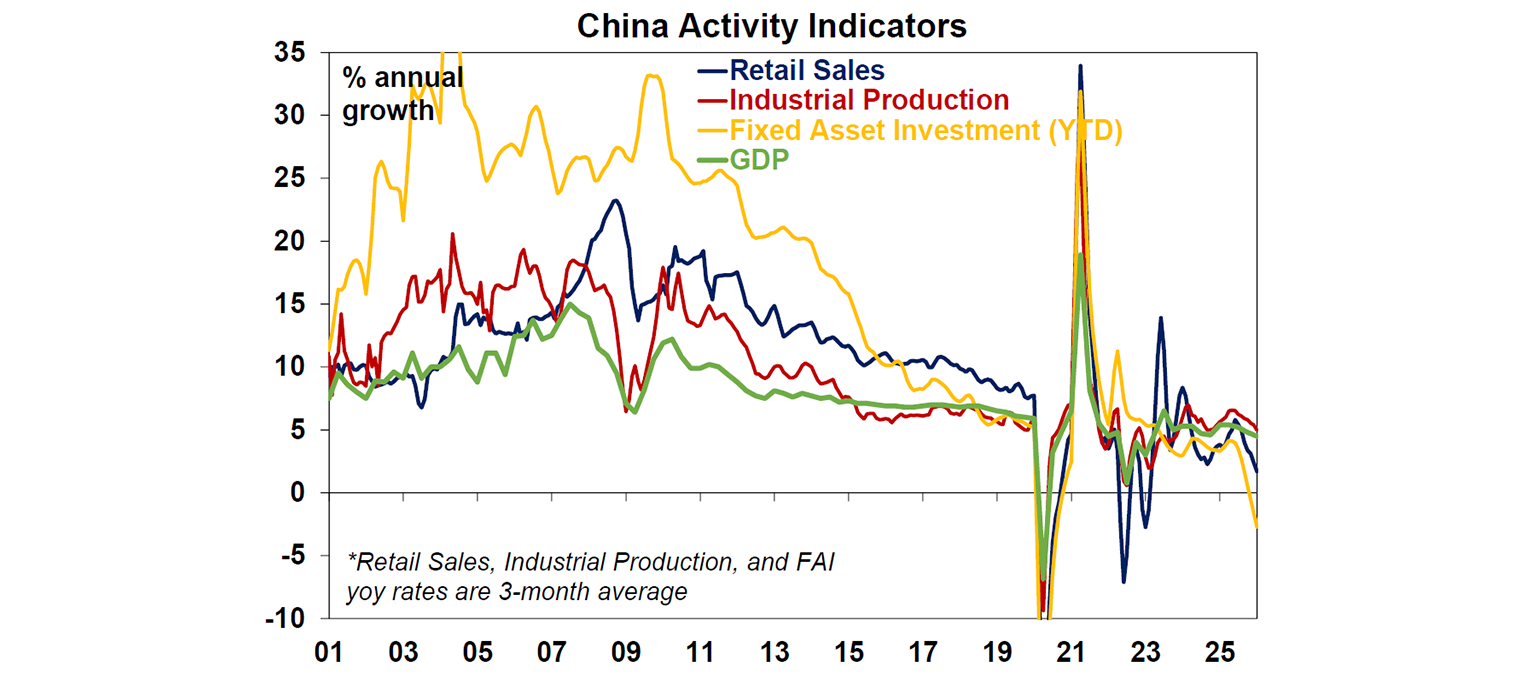
China’s National People’s Congress met this week, where the Government set a GDP growth target of 4.5-5% for 2026. After three consecutive years of 5% growth target, the reduction this year has been widely anticipated by economists, but it still made headlines as 5% is the lowest target in 35 years and signals that Beijing is now comfortable with a slower pace of growth. In other words, Chinese policymakers are acknowledging the various headwinds from both internal and external factors for the country this year: the trade war with the US is still on a pause since October last year and could flare up again in the future, multiple Western countries (such as Canada and EU countries) are putting up trade barriers as Chinese trade surplus reached a new record high, the war in Iran is threatening slower global growth which hurts demand and increases input cost for firms when there is already little room to raise selling prices, and meanwhile, the property downturn still does not seem to have an end in sight.
By itself, a lower GDP target is not that alarming, as it is inevitable that Chinese trend growth rate must slow as the country develops and population declines. Generally, developing countries have faster GDP growth rates due to the catch-up effect where they can quickly import technologies from other developed economies and build basic infrastructures as well as move labour into high productivity sectors like manufacturing. But as the country matures, GDP growth tends to taper off as the economy shifts to a more consumption-based and service-oriented model. The issue with China is that consumption growth is now also slowing, accounting for about 40% of GDP (compared to above 50% for Australia and 68% for the US), driven by negative sentiment in the property market, so there is a fear that growth could nosedive rather than stabilising at a lower level.
It’s not all doom and gloom though because the shift to lower growth is also at the same time the Chinese government reiterates their goals for technology self-reliance and achieving breakthroughs in technologies through the supply chain. As population declines, China will have to rely on this increase in productivity to deliver sustainable growth. For Australia, it means that we’ll need to diversify away from iron ore (as Chinese demand for steel would decline) but it’s likely that copper, nickel, cobalt and other critical minerals exports would hold up in China’s quest for technological dominance.
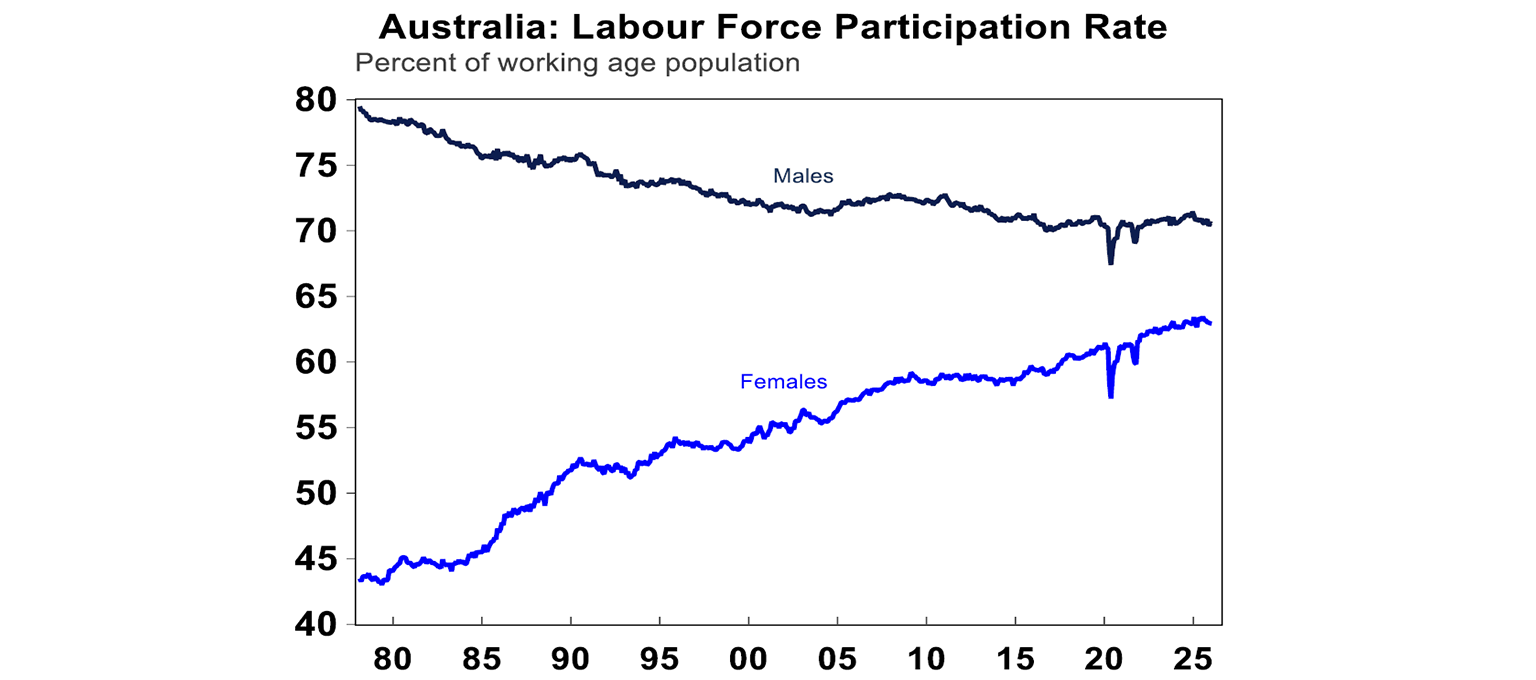
Our team’s favourite show this week is Bridgerton! We loved watching the challenges of Lady Whistledown in obtaining information, after the Queen meddled to reveal her identity last season. It’s the perfect lesson for Australia about the negative consequences of overregulation from the government. It also portrays the benefits of increased female participation in the workforce as barriers for women are removed, which is a timely reminder for International Women’s Day this weekend.
Major global economic events and implications
US ISM surveys for February were surprisingly strong and clearly indicated expansion for both the manufacturing and services sectors (though note that this was surveyed before the escalation of war on Iran). The manufacturing index held around 52.4 with increased backlogs of orders and low customer inventories, while the services survey rose by 2.3 points to 56.1, the highest level since middle of 2022, as employment within services improved.
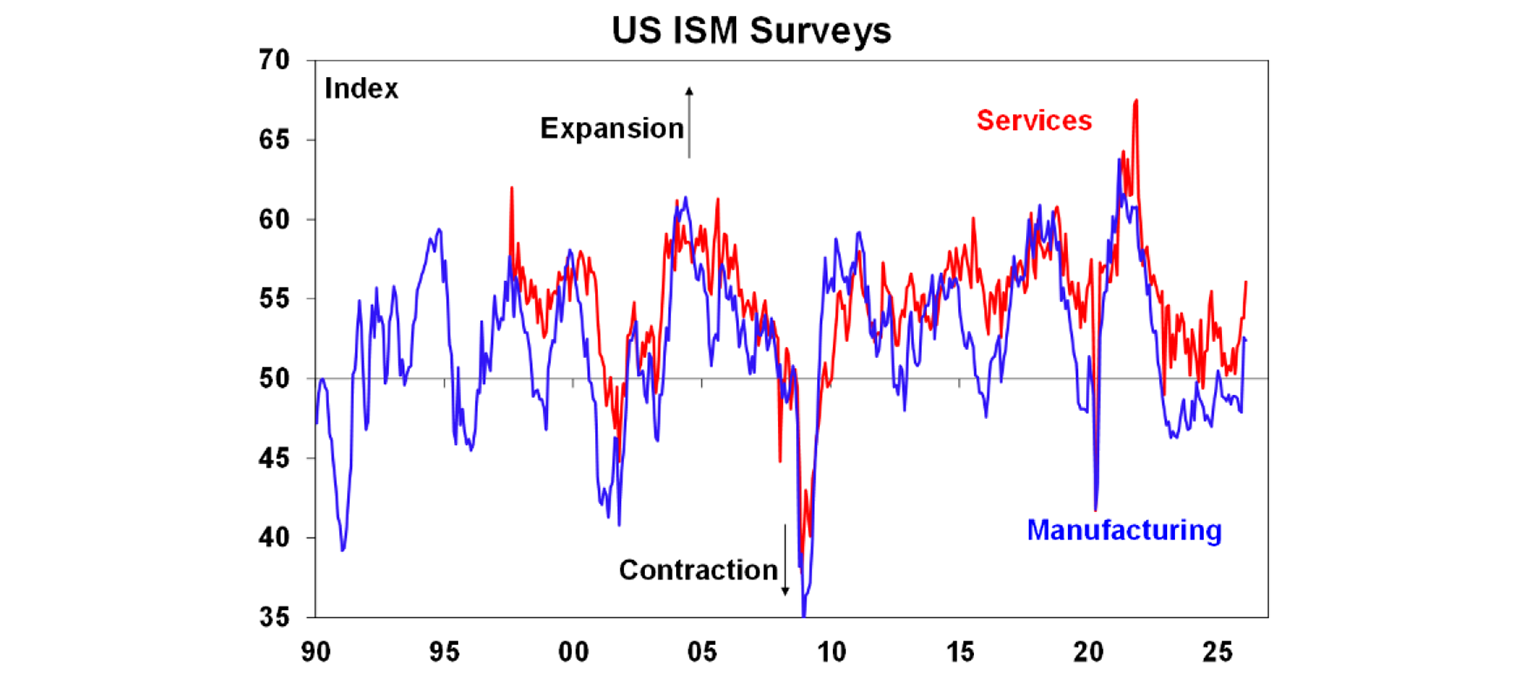
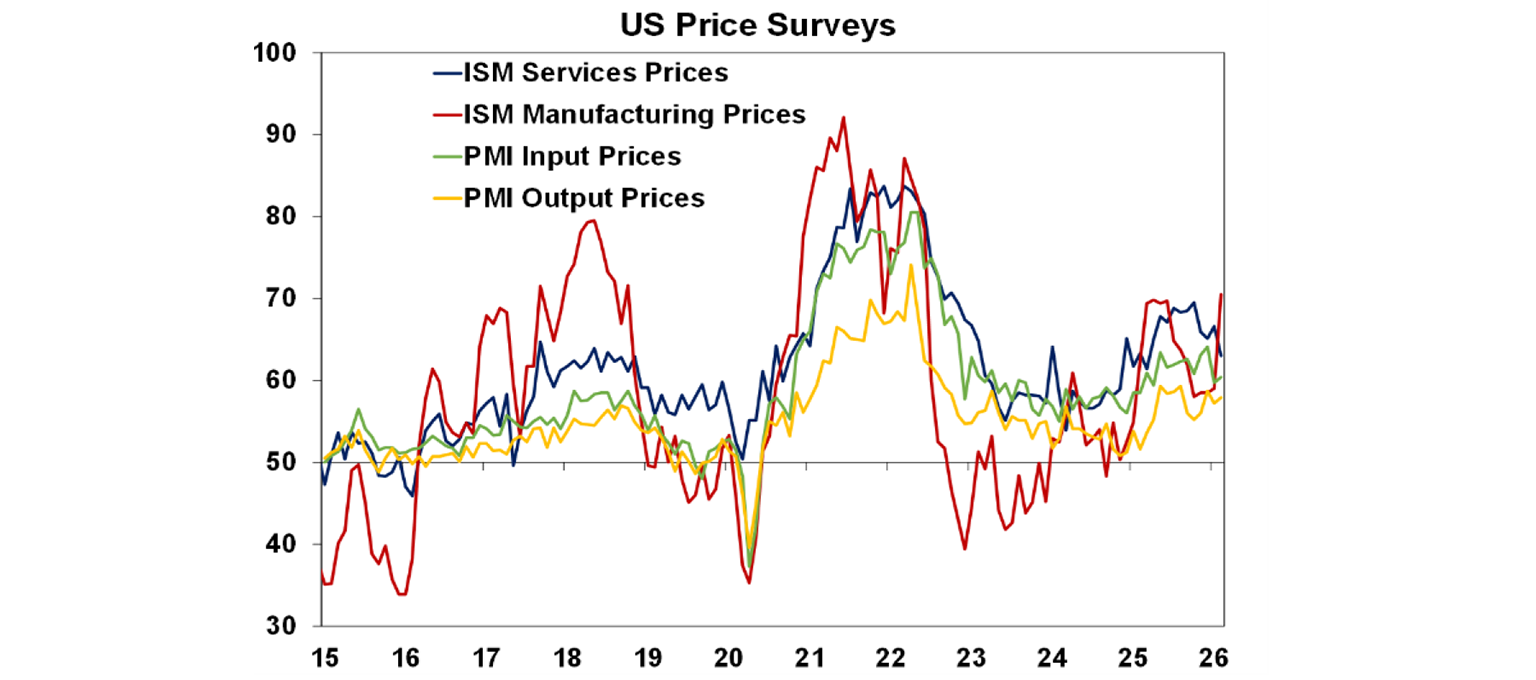
The price indicators from the ISM report were mixed, however. Manufacturing prices saw input prices jump related to tariff costs, higher metal prices, and rising energy prices; but services price paid fell to the lowest level in almost a year. They point to a continuation of rising goods but stabilising services trend in US inflation in the coming months.
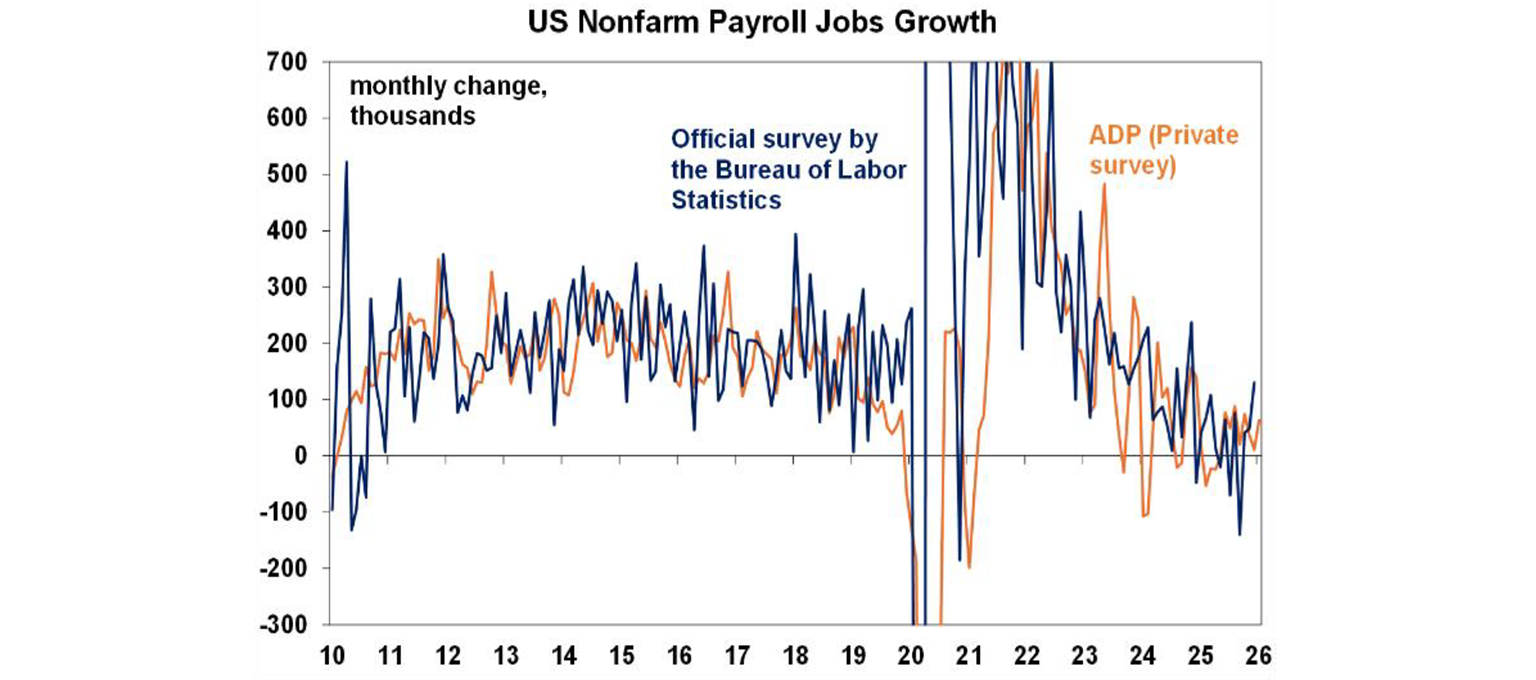
US labour market continued to soften but not yet to concerning levels. The February official total nonfarm payrolls figure was much weaker than expected, falling by 92k while consensus expected a 55k rise (as indicated by the strong ADP private payrolls report). In addition, the unemployment rate rebounded to 4.4% from 4.3% prior, while the labour force participation rate fell to 62.0% - the lowest since late 2021. But don’t forget that the payrolls data tend to be very volatile (see the chart below), and February’s weak report came in after January’s upside surprise. Therefore, while the labour market is clearly cooling, it would take another few months of weaker trend for the Fed to cut – a sentiment shared by some Fed officials this week.
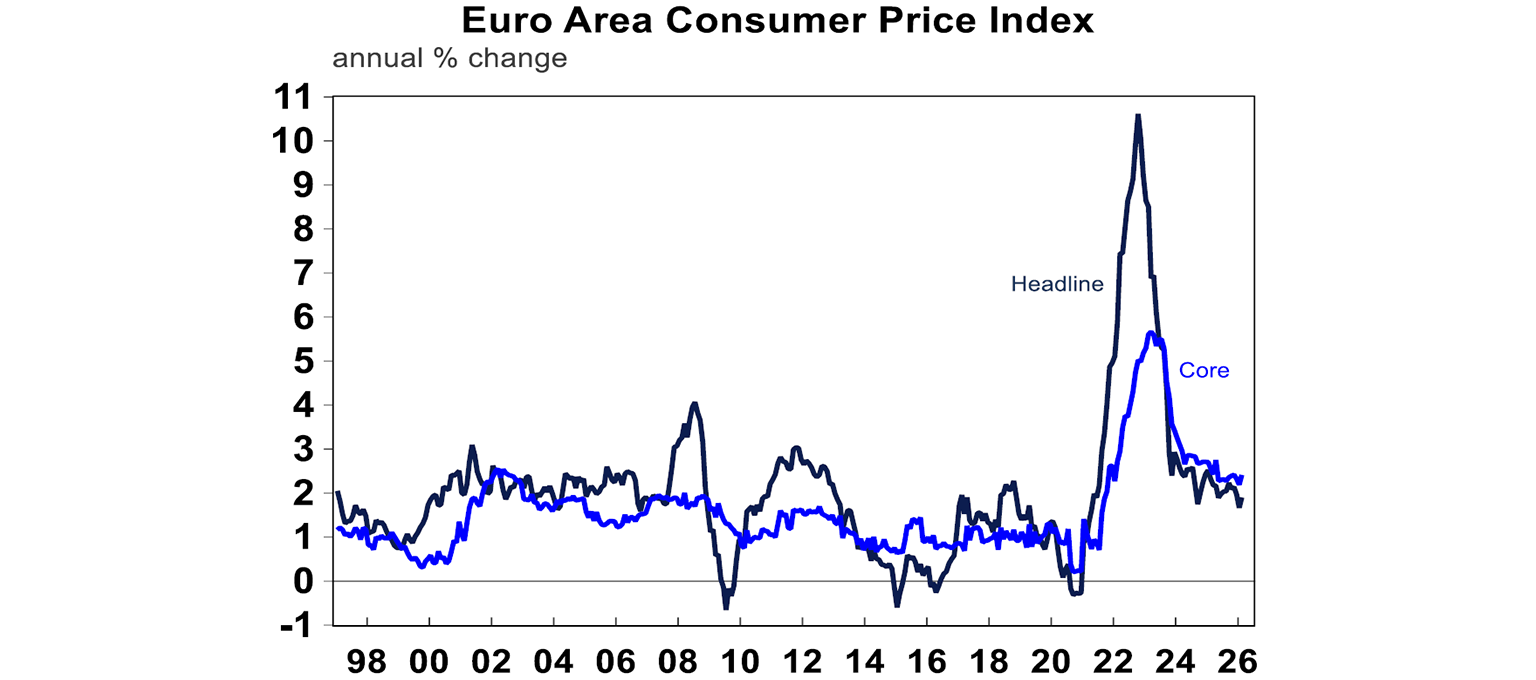
Eurozone CPI was higher than expected after the Winter Olympics. The headline inflation figure increasing to 1.9%yoy (from 1.7% in January) while the core measure climbed to 2.4%yoy (from 2.2%). However, the increase is not too concerning as the surprise has been driven by Italy and more specifically hotels and restaurant prices. The worry for the Eurozone for now is disruption from the war in the Middle East, however – which explains the underperformance of European shares this week.
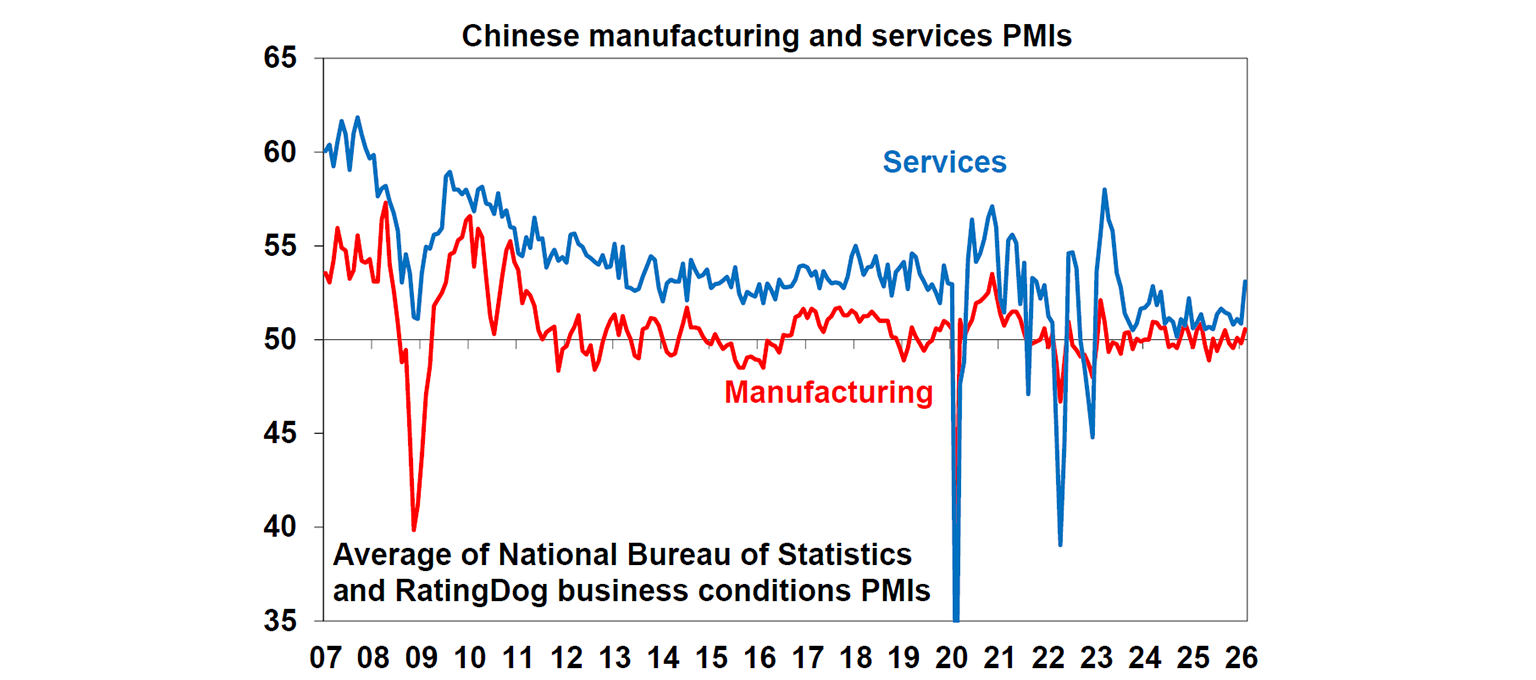
China’s suite of official and private PMI surveys showed a marked divergence between domestic and global conditions for Chinese firms. The official PMI from its National Bureau of Statistics showed activity hovering just below neutral and in the same range they have been in throughout the past year; but the RatingDog survey (which tends to track smaller, private, export-oriented firms) unexpected jumped to 52.1 and 56.7 for the manufacturing and services indices, respectively. This divergence likely indicates that domestic demand remained softer while global conditions are still supportive for exports growth.
Australian economic events and implications
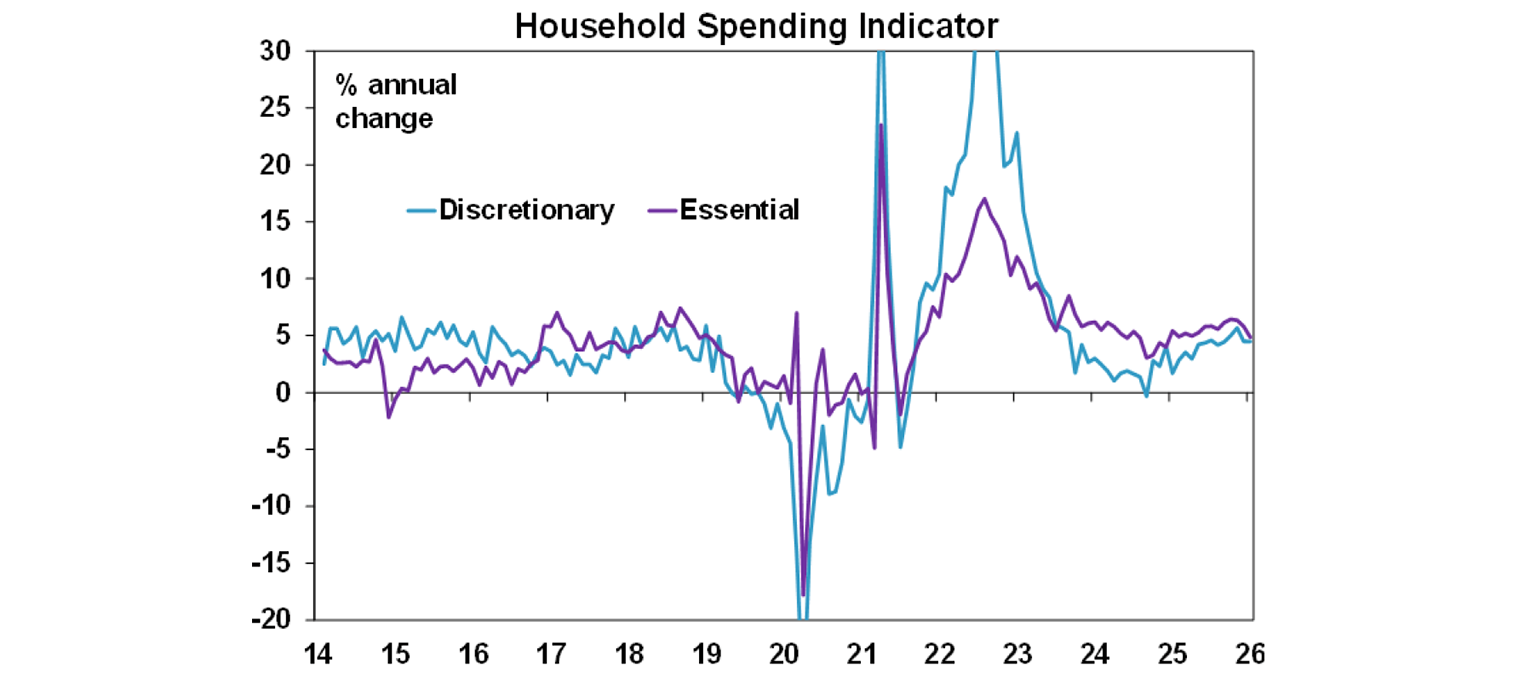
Australian household spending disappointed for the second month in a row, increasing by only 0.3% over January after a 0.5% contraction in December (forecasts were for a 0.4% rebound). The momentum has clearly slowed with annual growth in spending slowing to just 4.6% from a peak of 5.9% last year, while real spending is up only by about 1.8% from a year ago. More notably, January increases were concentrated in essential items while discretionary spending only ticked up by a small 0.1%mom. We think that the data indicates an already cautious consumer sector which will no doubt be further impacted by the February rate cut, and spending growth will moderate further in the upcoming months.
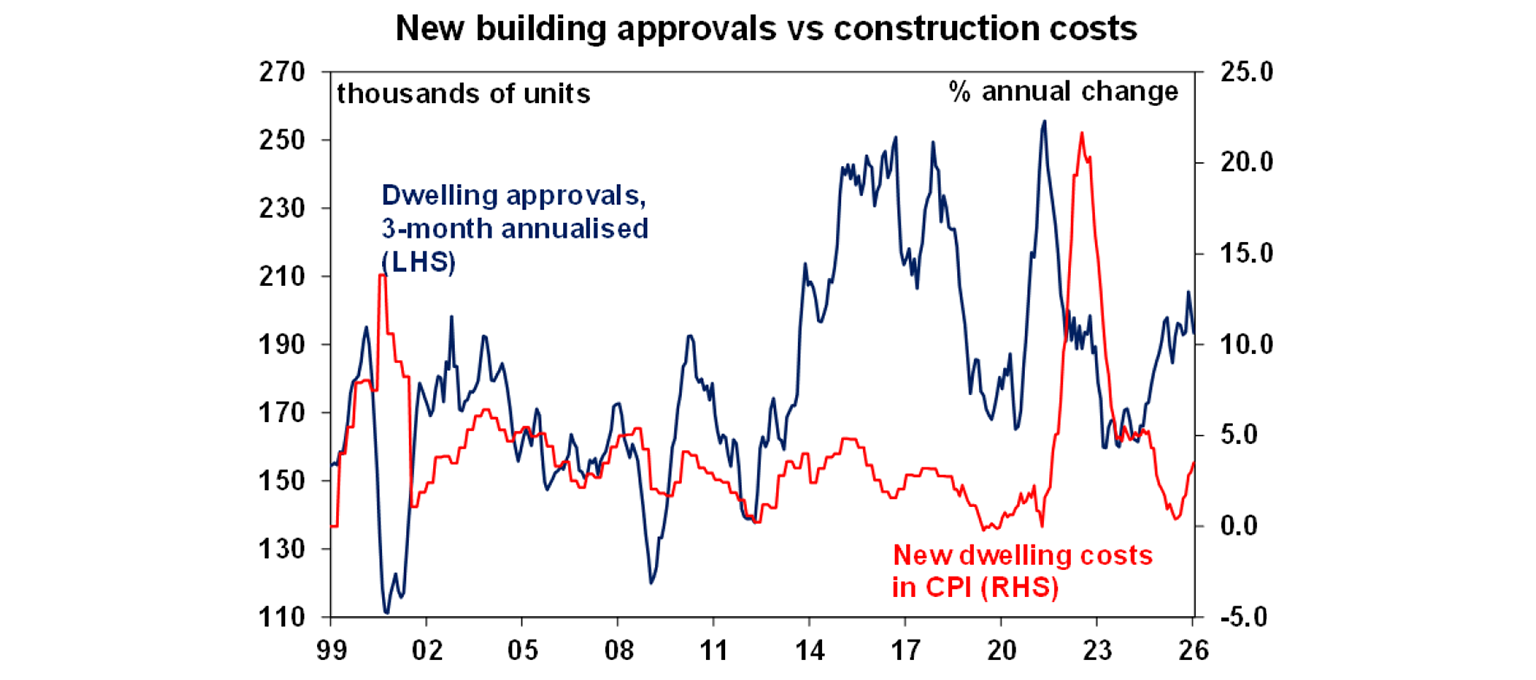
Dwelling approvals data also underwhelmed in January, falling by 7% over the month, contrary to economists’ expectations for a 5% rise. This month, the fall was driven by a 22% drop in unit approvals; but both detached houses and units have seen a moderation in approvals trend over the last three months (to an annualised pace of 193 thousand units from a peak of 205 thousand). Looking forward, construction sentiment could dampen further, given the rate hike as well as the continued shortage in construction labour and materials. Coincidentally, in her talk this week, Governor Michelle Bullock also mentioned the capacity constraints for the dwelling construction industry because there is a crossover between high density buildings and government infrastructure projects. The key to boost housing supply in Australia is to get more building approvals and completions (especially for units), but this is unlikely to be realised if these capacity constraints are not alleviated.
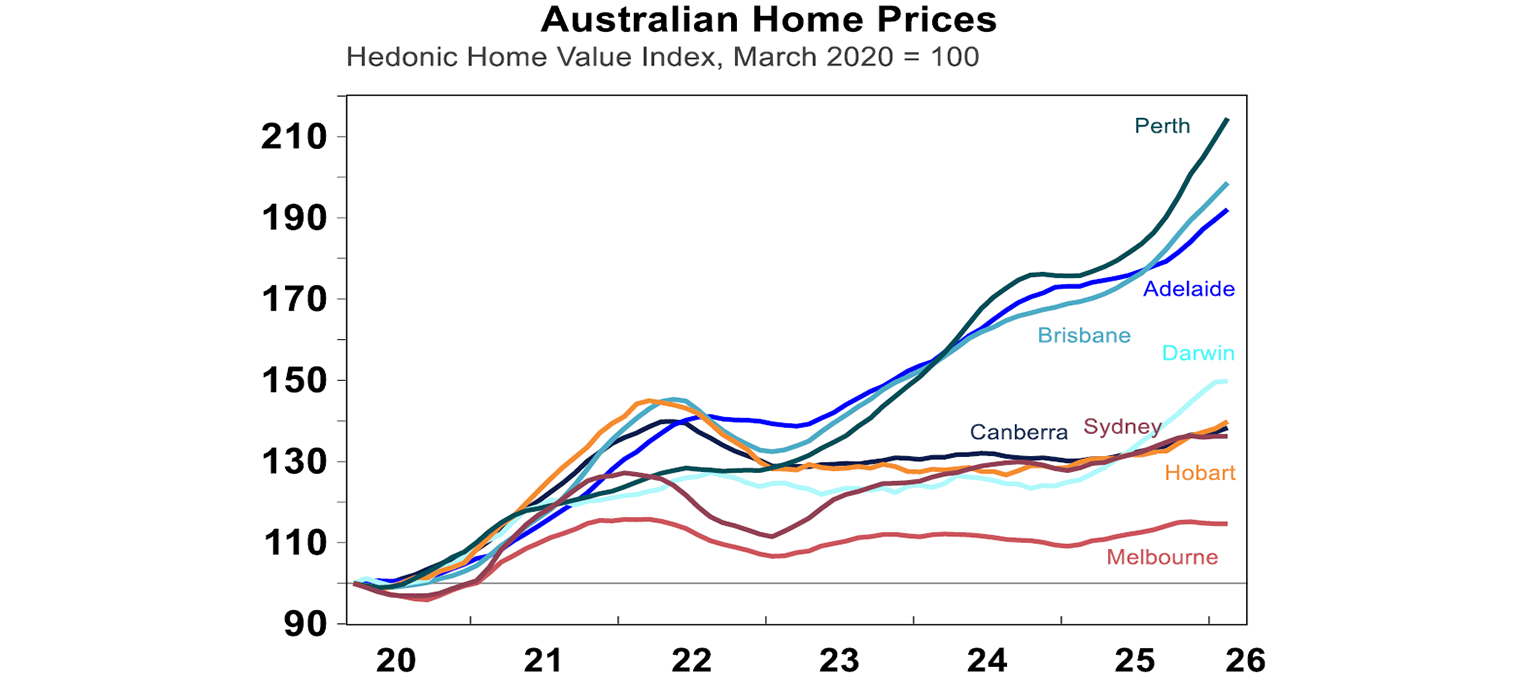
Unsurprisingly, Australian home prices rose again to another record high in February. Cotality data shows that the national average home prices rose by 0.8% over the month, but there is a wide divergence with Sydney and Melbourne flat while Brisbane, Adelaide, and Perth recorded rises of 1.6, 1.3, and 2.3%mom, respectively. However, the broad trend is quite similar across states: 1) Monthly price momentum has slowed from talks of rate hikes and poor affordability, and monthly price gains will likely slow further; and 2) The boost from the expansion of the 5% deposit scheme for first home buyers is showing up in stronger growth for entry-level properties. Overall, Australian home prices this year will be constrained by less favourable rates and the potential for more APRA intervention in investor lending, but the chronic undersupply issue will continue to support home price appreciation of around 5-7%. Risks remain on the downside if there are more rate hikes, a sharp rise in unemployment or smaller than expected net migration.
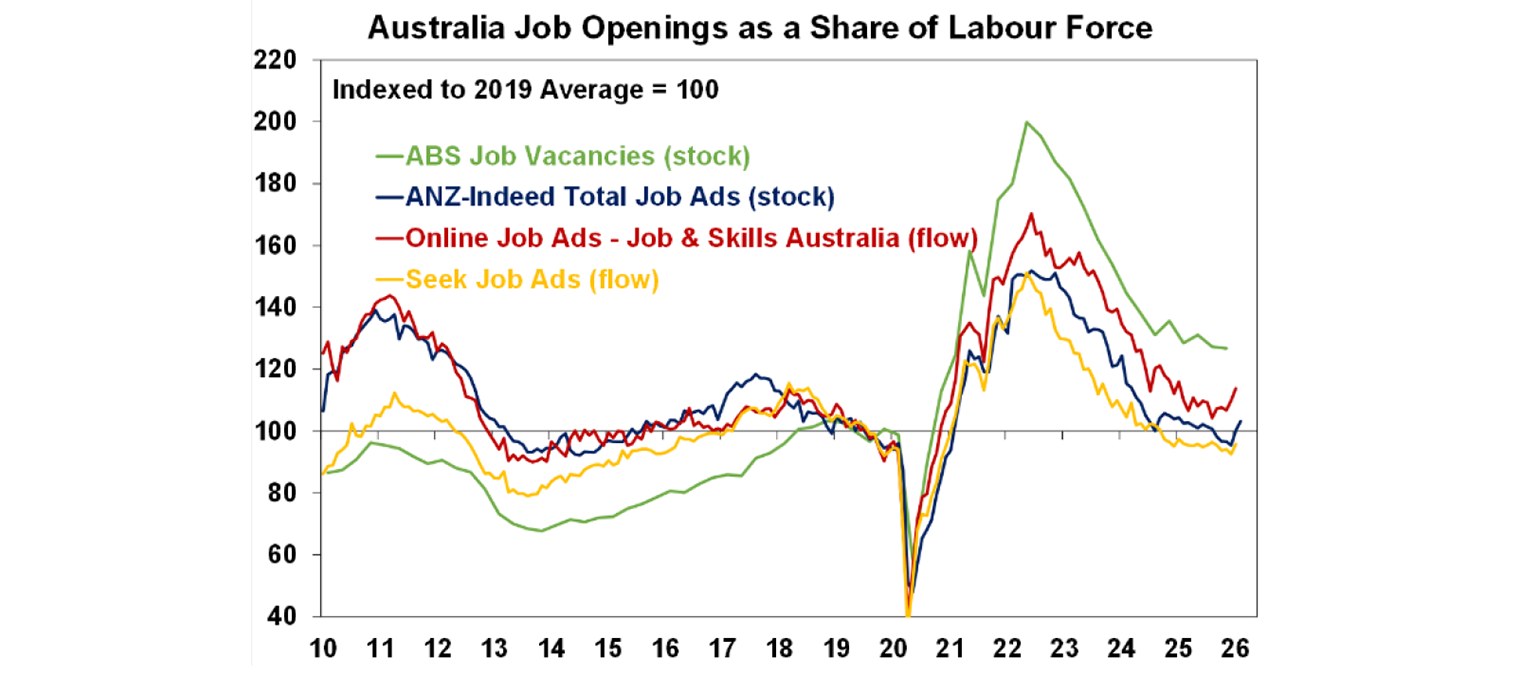
Job advertisement counts, as measured by ANZ-Indeed, rose a strong 3.2% in February following a 5.2% rise in January. This has coincided with the improvement in the unemployment rate lately. Overall the labour market seems to be stabilising after softening somewhat throughout 2025.
The Melbourne Institute inflation gauge pointed to a flat trimmed mean measure of 2.1%yoy in February. While the figure has diverged from the official measure, the Melbourne Institute gauge has correctly anticipated the uptrend in inflation since July 2025, so an unchanged measure versus last month is a good sign!
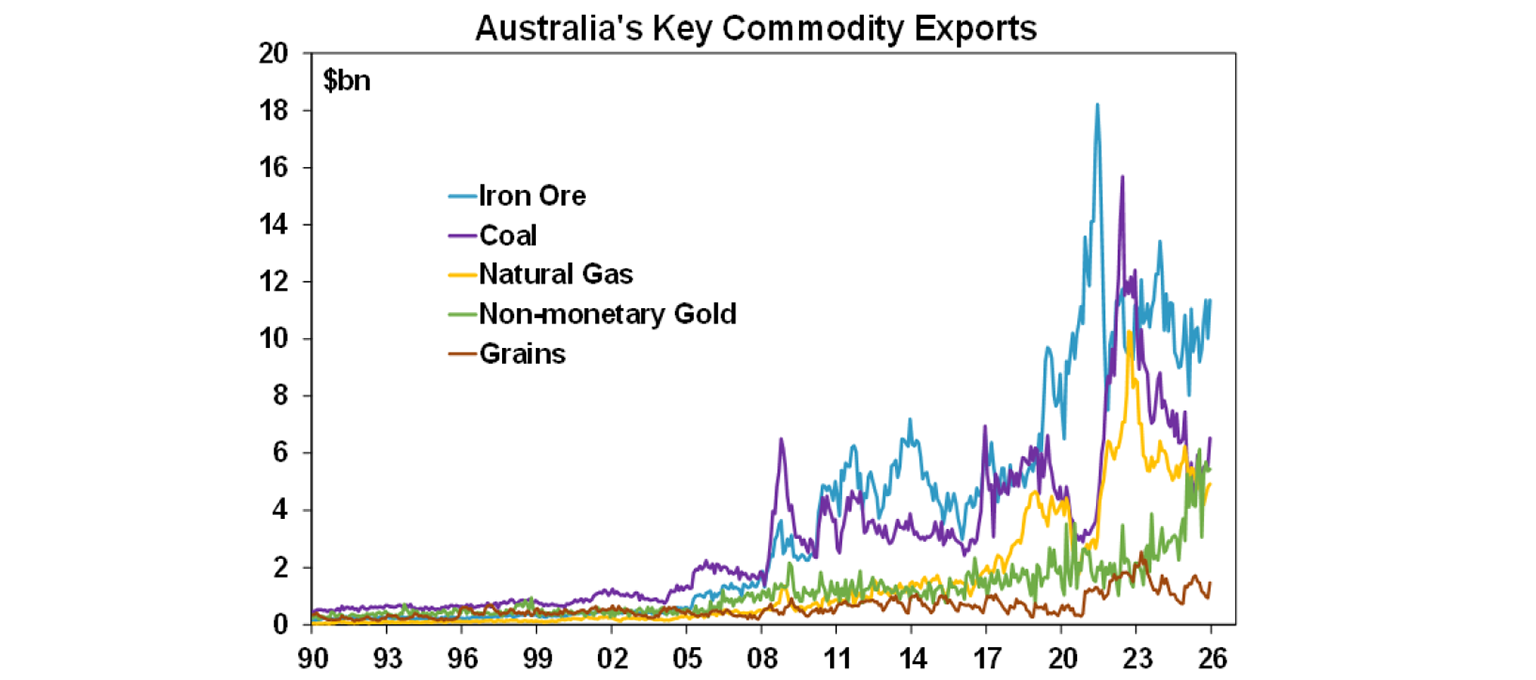
Australian goods trade balance narrowed to $2.6bn in January from $3.3bn prior; continuing the trend of slower exports growth relative to imports. Over the last year, despite the US trade war with the world, key commodity exports have held up okay (both in terms of prices and quantities), with gold surpassing LNG and becoming the 3rd biggest export product after iron ore and coal. While heightened geopolitical risks this year could potentially hurt global demand, nominal export revenues would still benefit from an uptick in commodity prices.
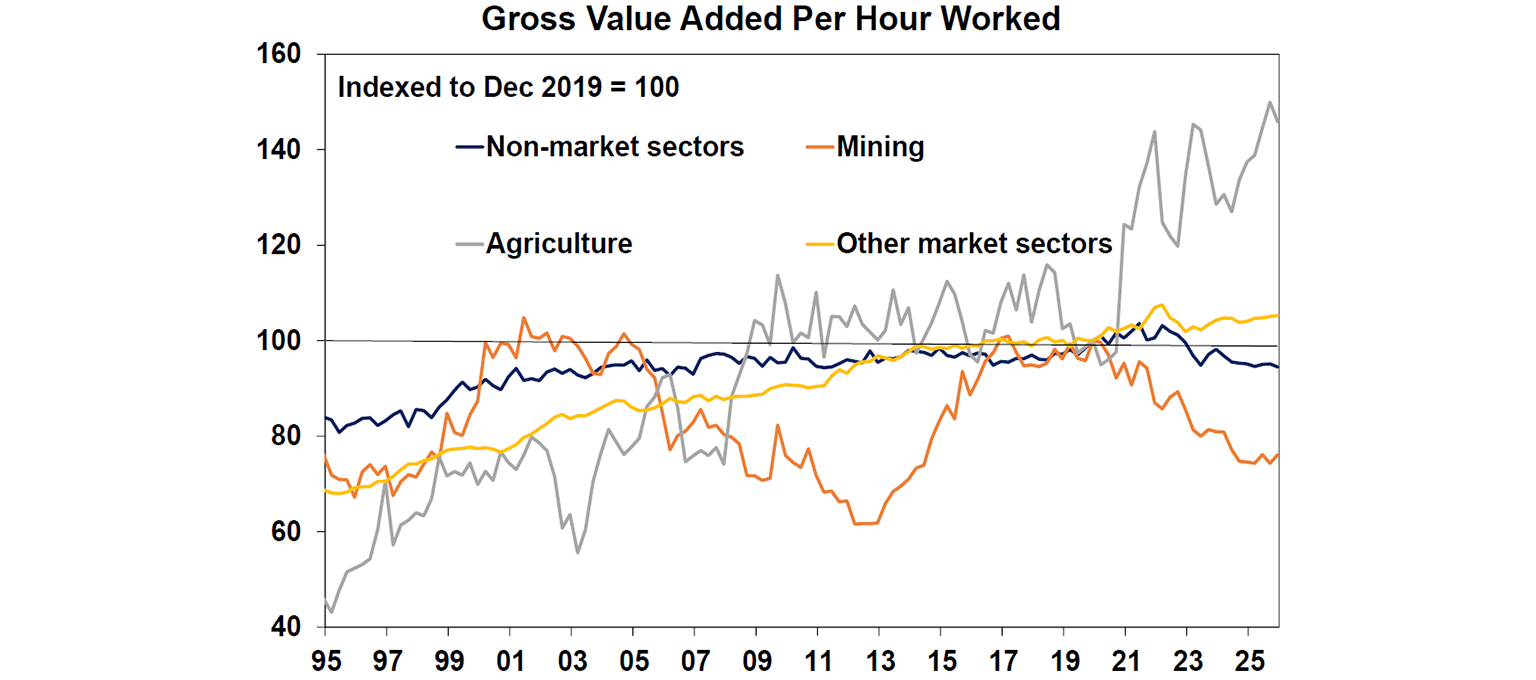
The Australian labour account for 4Q25 was released and showed a continued increase in filled jobs and divergence in productivity levels across sectors. This data is lagged but it is the best guide to jobs across industries (rather than the number of employed persons like in the monthly labour force data). Over the year, market sector jobs have increased by 93 thousand while non-market (education, health, public admin) jobs rose by 68 thousand.
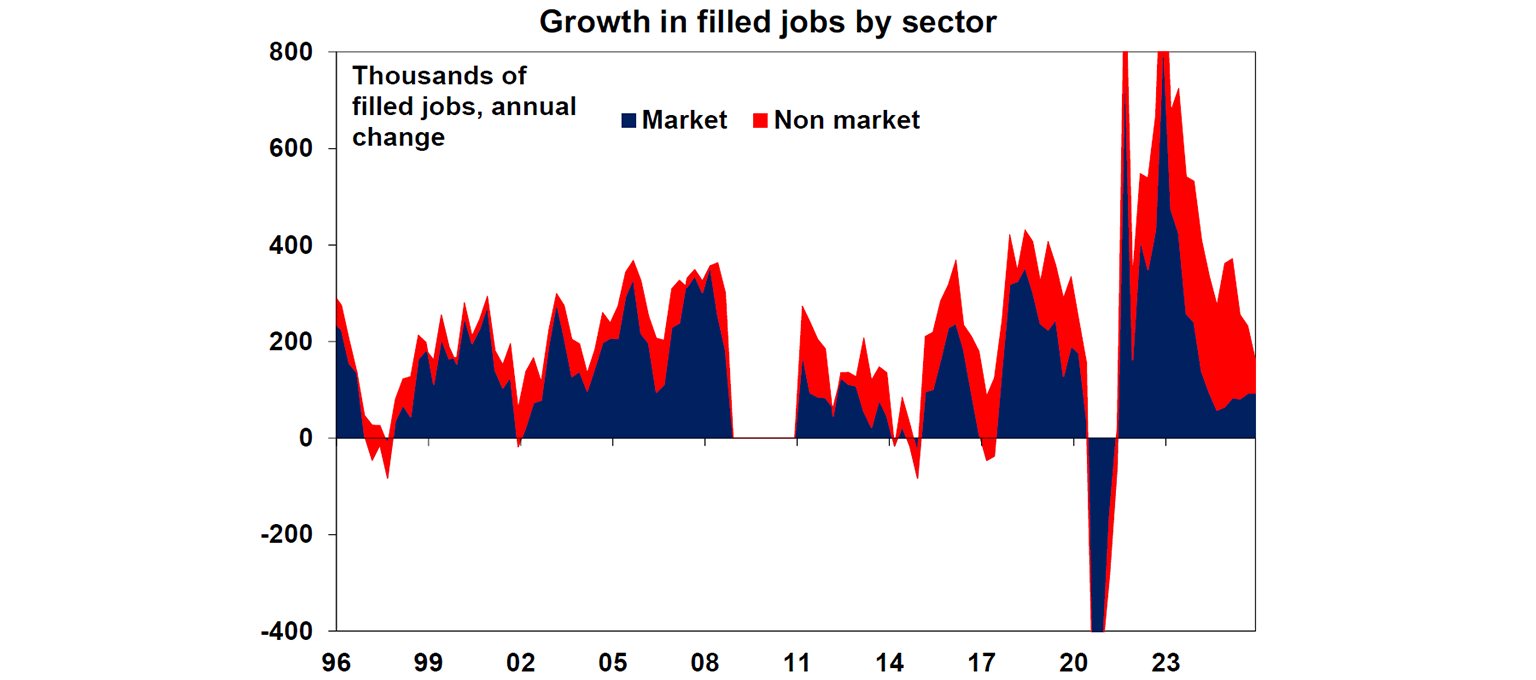
It is a good sign to see the market sectors stepping up in jobs creation, because over the last year, productivity for non-market sectors has fallen by 0.7%, while market sectors other than agriculture and mining have seen a 1.2% boost!
What to watch over the week ahead?
In the US, while markets continue to assess the impact of the war in Iran, there will also be a focus on February inflation data (Wednesday). The headline consumer price index is expected to advance by a reasonable 0.2%mom or 2.5% over the year, while core inflation is likely printing at 0.3% over the month or 2.4% annually. Housing starts on Thursday is likely softening by 4.6% versus last month.
In Australia, the Westpac-Melbourne Institute Consumer Confidence Index (Tuesday) will likely deliver another pessimistic print as consumers receive negative news on inflation, rates, and rising global geopolitical risks. The NAB Business Survey released on the same day is likely stronger, but could show some deterioration in February as the RBA hiked rates over the survey period.
Outlook for investment markets
Global and Australian share returns are expected to remain reasonable this year. Stretched valuations, political uncertainty associated with Trump & the midterm elections, AI bubble & tech valuation worries, and geopolitical risks are the main drags. But returns should still be positive thanks to Fed rate cuts, Trump’s consumer friendly pivot and solid profit growth. The return to profit growth should also support gains in Australian shares even though the RBA has increased rates and may do more. Another 15% or so correction in share markets is likely along the way though.
Bonds are likely to provide returns around running yield.
Unlisted commercial property returns are likely to be solid helped by strong demand for industrial property associated with data centres.
Australian home price growth is likely to slow to 5% or less due to poor affordability, the RBA raising rates with talk of more to come and APRA’s move to ramp up macro prudential controls.
Cash and bank deposits are expected to provide returns around 3.85%.
The $A is likely to rise as the interest rate differential in favour of Australia widens as the Fed cuts and the RBA holds or hikes. Fair value for the $A is around $US0.72.
You may also like
-

Weekly market update - 24-07-2026 Renewed global worries weighed on the Australian share market which fell around 0.3%, but with its lower exposure to tech shares providing some protection. -

Oliver's insights Charts to watch 21 July 2026 Share markets had a strong first half despite the oil supply shock as expectations for de-escalation, okay economic data, strong profits and the AI boom provided an offset. -

Weekly market update - 17-07-2026 Following the renewed escalation in the US/Iran conflict, the Strait of Hormuz is effectively closed again with Iran attacking ships and the US attacking Iran and blockading its ports. Both are now back to attacking energy infrastructure which is a signficant & concerning escalation.
Important information
Any advice and information is provided by AWM Services Pty Ltd ABN 15 139 353 496, AFSL No. 366121 (AWM Services) and is general in nature. It hasn’t taken your financial or personal circumstances into account. Taxation issues are complex. You should seek professional advice before deciding to act on any information in this article.
It’s important to consider your particular circumstances and read the relevant Product Disclosure Statement, Target Market Determination or Terms and Conditions, available from AMP at amp.com.au, or by calling 131 267, before deciding what’s right for you. The super coaching session is a super health check and is provided by AWM Services and is general advice only. It does not consider your personal circumstances.
You can read our Financial Services Guide online for information about our services, including the fees and other benefits that AMP companies and their representatives may receive in relation to products and services provided to you. You can also ask us for a hardcopy. All information on this website is subject to change without notice. AWM Services is part of the AMP group.