


Oliver's Insights
The outlook for Australian shares – is the long underperformance versus global shares over?
Australian shares have had a strong start to 2026 with the ASX 200 up 3.3% and flirting with a new record high. The local market has also outperformed US shares which are down 0.1% and global shares which are up 1.6%. However, this could just be noise and follows a significant underperformance against US and global shares since 2009.
6 min read

Key points
Over the long-term Australian shares have been a relatively strong performer, but it does go through relatively long periods of out and underperformance versus global shares.
We see more upside in Australian shares supported by the return of profit growth. And its underperformance over the last 16 years is getting long in the tooth.
But rich valuations, a more hawkish RBA and global risks suggest it will be a bumpy ride.
Introduction
Australian shares have had a strong start to 2026 with the ASX 200 up 3.3% and flirting with a new record high. The local market has also outperformed US shares which are down 0.1% and global shares which are up 1.6%. However, this could just be noise and follows a significant underperformance against US and global shares since 2009. So, can the gains continue and is the 16 year structural underperformance finally over?
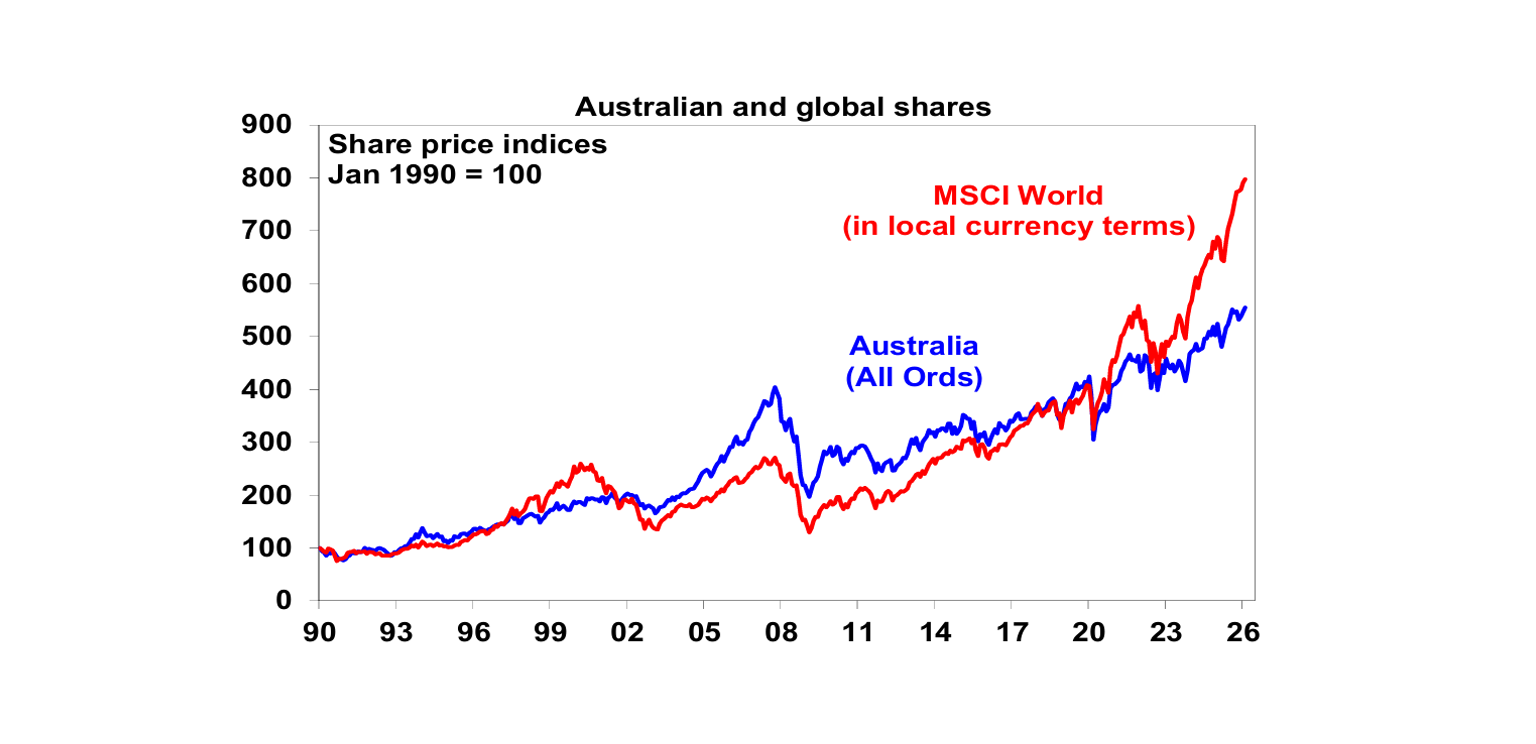
Australian shares in a long-term context
To get a handle on the future, it’s first useful to understand the past and here some key points on the performance of Australian shares:
Over the very long-term Australian shares have been a strong performer. Since 1900 Australian shares have returned 11.6% per annum once dividends are allowed for versus 10.1% pa for US shares.
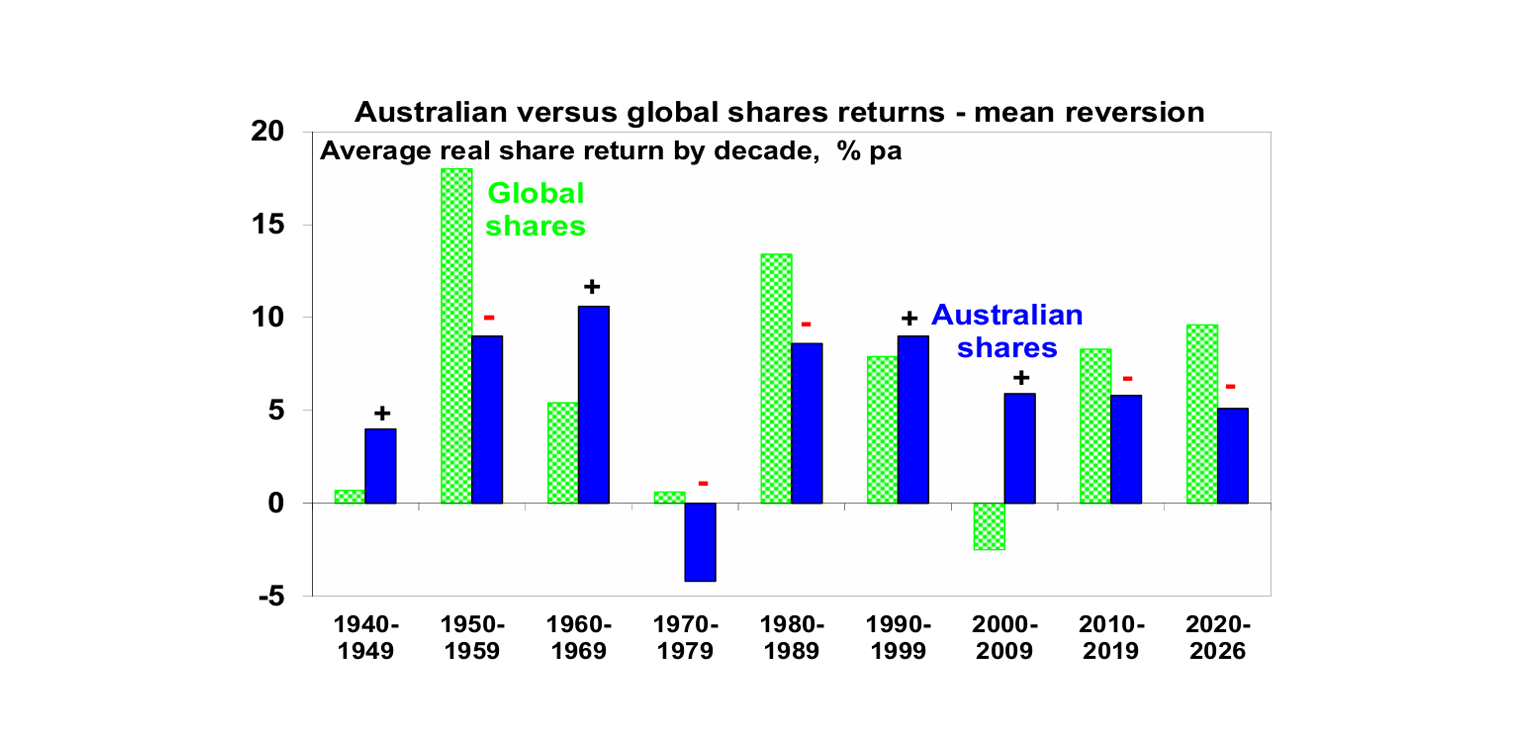
However, Australian shares go through periods of relative out & underperformance or “mean reversion”. This can be seen in the next chart. Australian shares outperformed in the 1940s (indicated by a +), unperformed in the 1950s (indicated by a -), outperformed in the 1960s resources boom years, underperformed in the high inflation 1970s and 80s, outperformed in the 1990s (although Australia underperformed in the second half of the 1990s when the tech boom raged), outperformed dramatically in the resources boom of the 2000s and underperformed in the 2010s and this decade so far.
The more recent swings in relative performance can be seen more starkly in the next chart. It compares the relative performance of Australian to global shares since 1970 in terms of: relative share prices in local currency terms (green line); relative total returns ie with dividends added in (blue line); and relative total returns with global shares in Australian dollars (red line). A rising ratio means Australian outperformance and vice versa.
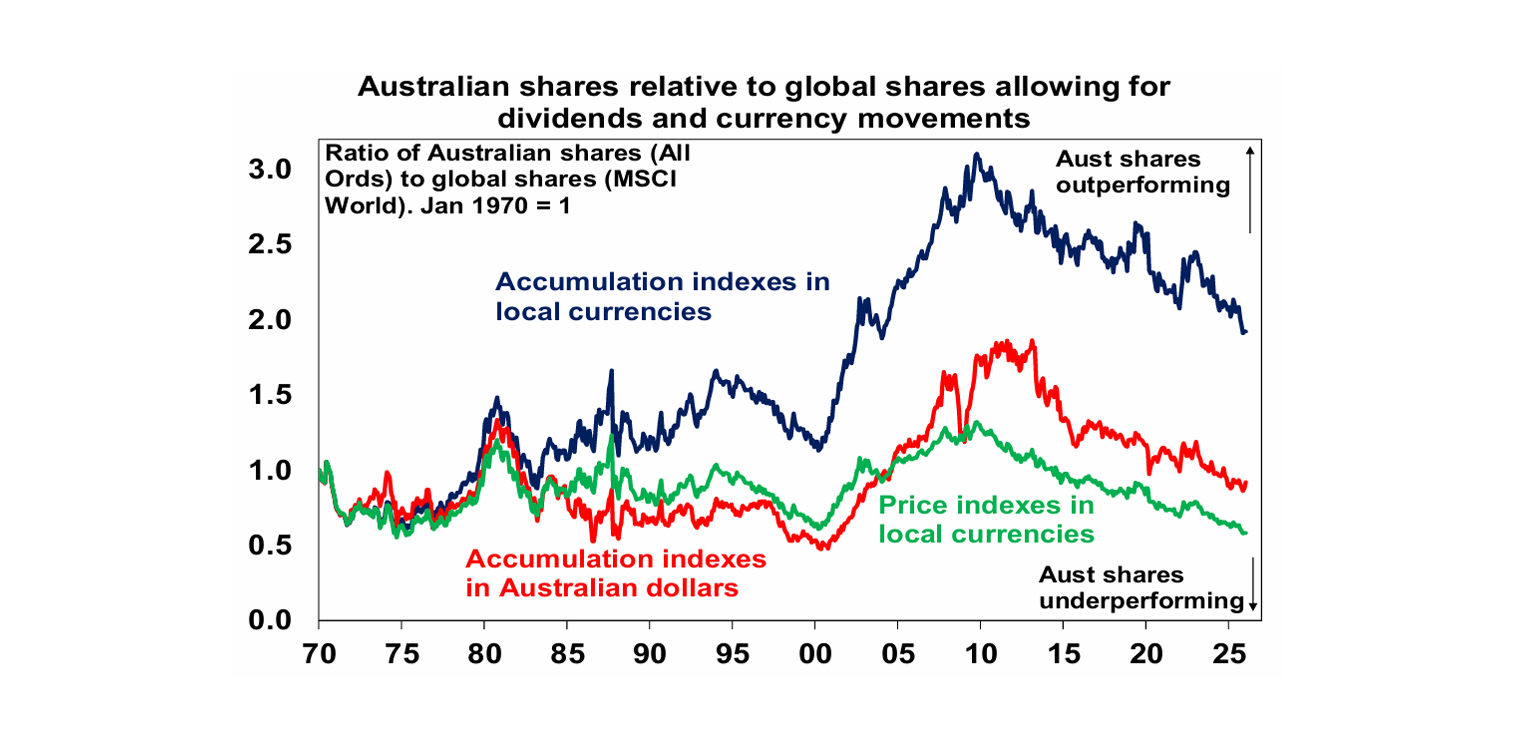
As Australian shares pay high dividend yields (3.3% currently) versus global shares (1.5%), dividends should be included in comparisons of Australian & global share returns. So, the focus should be on the blue line (comparing total returns) or the red line which compares totalreturns in $As, and not the green line which only looks at share prices.
Several things stand out.
First, as noted earlier, over long periods of time and when dividends are allowed for Australian shares have performed well versus global shares. Since 1970 Australian shares have returned (capital growth plus dividends) 10.2% per annum versus 8.9% pa for global shares in local currency terms. However, the falling $A over this period has enhanced the return from global shares to 10.4% pa but its not that different to the return from Australian shares.
Second, the swings in the relative performance of Australian shares are apparent if dividends and currency moves are allowed for or not.
Finally, since October 2009, Australian shares have seen a long run of underperformance. Over that period, they have returned 8.5% pa compared to 11.8% pa from global shares in local currencies or 12.9% pa from global shares in Australian dollar terms (as the $A fell).
Why has Australia underperformed since 2009?
The underperformance of Australian shares since 2009 reflects a combination of: payback for the huge mining boom related outperformance of the 2000s; the slump in commodity prices from 2011; the lagged impact of the surge in the $A above parity against the $US into 2011; relatively tighter monetary policy in Australia for much of the post GFC period; fears that higher post pandemic interest rates will hit Australia harder due to more indebted households and Australia’s expensive property market; worries about the slowing Chinese economy; and a low exposure to tech stocks – with tech stocks propelling US shares in the pandemic and more recently with AI excitement.
5 reasons Australia’s underperformance may be over
There have been several occasions over the last few years where it looked like the relative underperformance of Australian shares may be ending - such as around 2018-19 and 2022 – only to see it resume taking the ratios in the previous chart to new lows for this cycle. But there are now several positives for the Australian share market suggesting at least more upside on a 12 month view andpossibly some relative outperformance.
Mean reversion – the historical experience tells us that after a lengthy period of underperformance the local share market eventually bottoms and outperforms for a few years. This may now be due after more than 16 years of underperformance.
Rotation from tech to non-tech shares – global investors appear to be rotating away from tech shares on the back of concerns about stretched valuations, excessive capex related to AI and worries that AI will decimate software businesses (ie “tech eating itself”). This will work against the tech heavy US share market (and was evident in the global relative underperformance of US shares last year) and may benefit the Australian share market. As we saw in the tech wreck of 2000-03 Australia’s low tech exposure turned out to positive for Australian shares and helped kick of a long period of outperformance.
A new super cycle in commodities – the commodity price slump from their 2008-2011 highs looks to be over with commodities embarking on a new super cycle bull market driven by constrained supply after low levels of investment and electrification and rising defence spending driving increased demand for metals. This will benefit Australia’s resource stocks. Iron ore is likely to feature less this time around partly reflecting slowing urbanisation in China and its property slump. But it’s worth noting that copper is now a bigger contributor to BHP’s earnings than iron ore.
Artificial Intelligence could add to demand for commodities – North American research provider the Bank Credit Analyst has posited that if AI driven robotics effectively boosts the supply of labour and drives a surge in global GDP, then the value of other factors of production like land and natural resources will soar. So, Australia might turn out to be a big long-term beneficiary of the AI revolution.
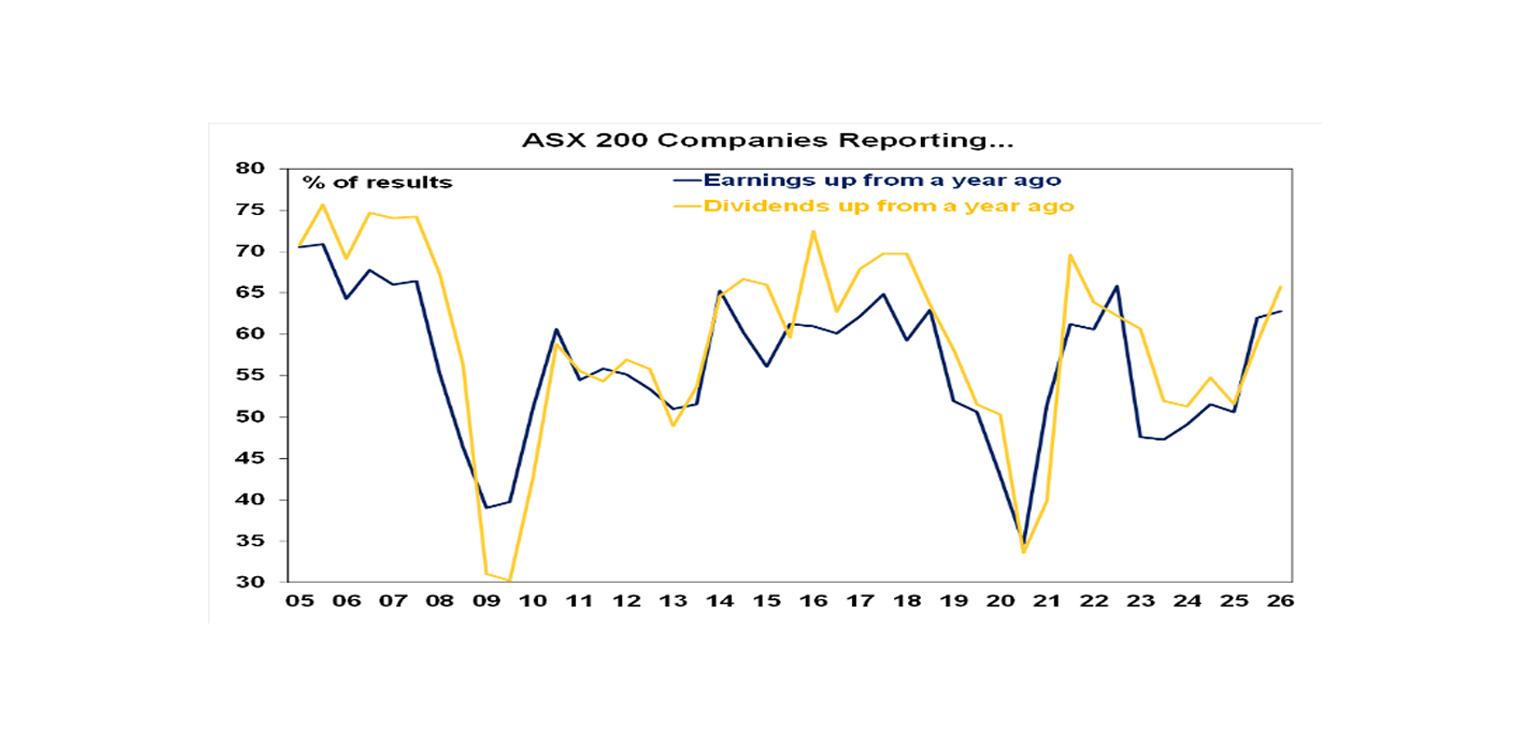
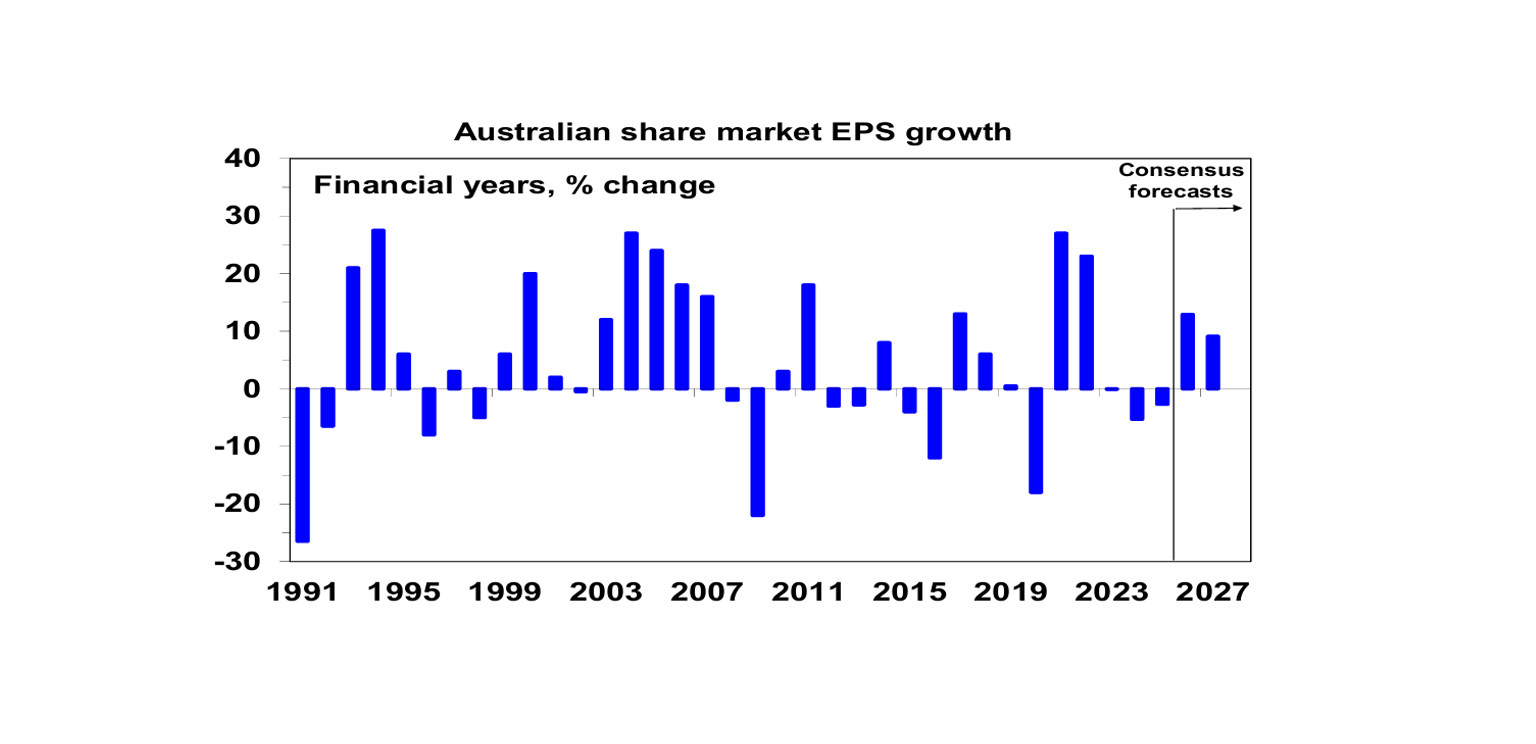
Company profits are rising again in Australia – this is the key driver in the near term. After three years of falls listed company profits are turning up with the latest profits reporting season confirming this: upside surprises have been surpassing downside surprises by almost two to one which is the strongest since 2021 and more companies are reporting profits and dividends up on a year ago compared to what was occurring in 2023 and 2024.
Consensusearnings expectations for this year have risen to 13%.
But it’s unlikely to be smooth sailing
There are three key threats or constraints for Australian shares:
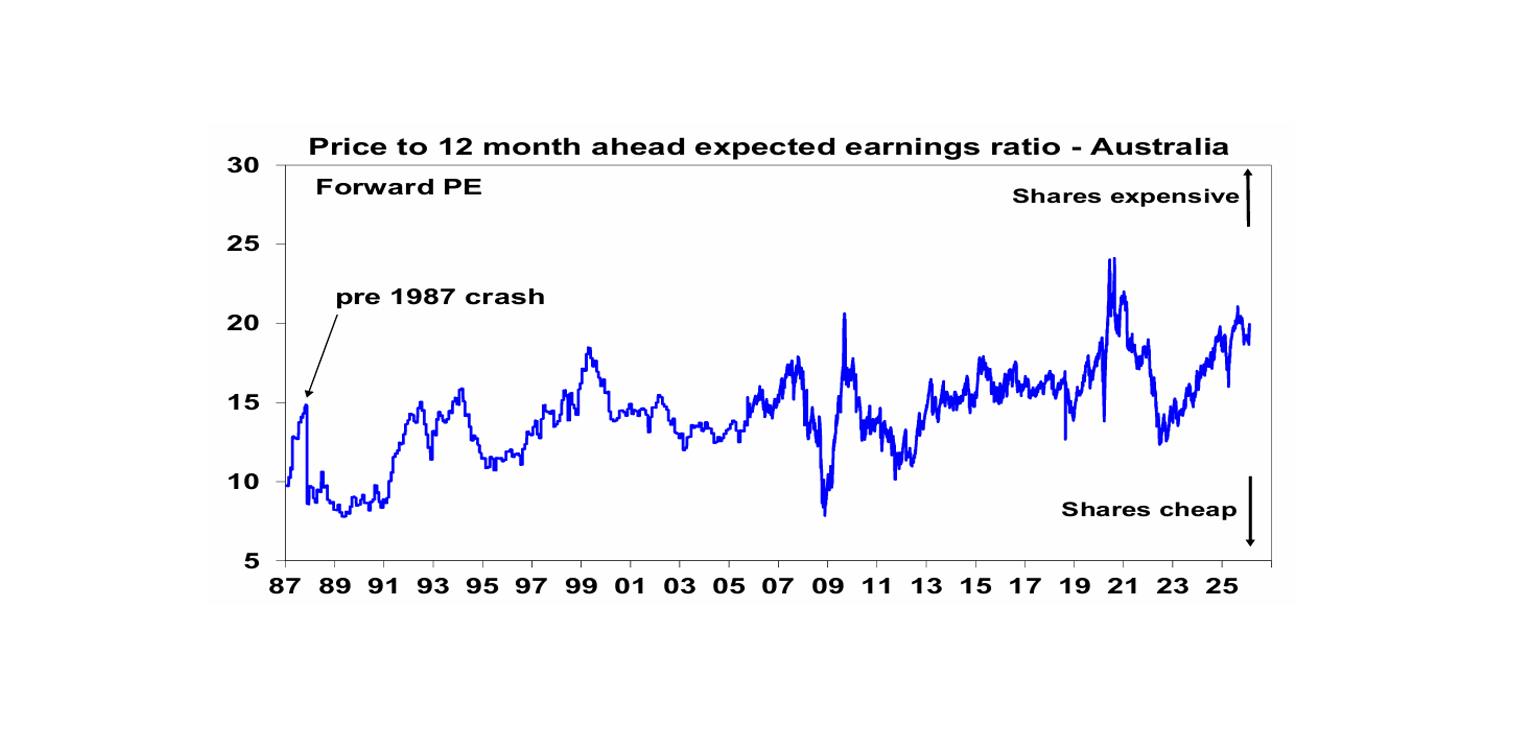
Valuations are rich with the forward PE of 20 times well above its norm of 15 times and the absence of a risk premium over bonds.
2. The RBA’s hawkish bias with the high risk of more rate hikes could threaten the Australian economic and profit growth outlook.
3. Global uncertainty around tech shares, US policies and geopolitics. As we have seen in the past, big ructions in US tech shares can have a flow on to Australian shares even if we have a low exposure to tech stocks. While the US Supreme Court has provided confidence that legal constraints remain on President Trump and Trump is now more politically constrained with the midterms this year, his replacement tariff strategy has ramped up the uncertainty around US trade policy. Finally, the high probability of another US strike on Iran risks a spike in oil prices should Iran decide to be uncooperative.
Concluding comment
A range of considerations suggest the outlook for Australian shares remains positive – particularly with profits on the rise. And there is a good chance its relative underperformance of the last 16 years is at or close to over. But given the various threats around valuations, the RBA and global conditions, there remains a case to be a bit cautious until confirmation is received. And the ride is likely to be bumpy. So, stay well diversified.
Dr Shane Oliver
Head of Investment Strategy and Chief Economist, AMP
You may also like
-

Oliver's insights - Why have Australian living standards “fallen” and how do we fix it? For the last few years there has been much talk of a “cost-of-living” crisis in Australia and of “falling living standards”. This has flared up again lately with the pickup in inflation resulting in a renewed fall in real wages. -

Weekly market update - 10-07-2026 Ceasefire over but markets are also over the war, Why oil prices can't go too low or too high, Is AI adding to inflation risk or taking it away, and Australia’s wage problem. -

How to protect yourself from phishing and impersonation scams Phishing scams can look like everyday messages – emails, texts or calls. Learn the signs and simple steps to protect your money and personal information.
Important note
While every care has been taken in the preparation of this document, neither National Mutual Funds Management Ltd (ABN 32 006 787 720, AFSL 234652) (NMFM), AMP Limited ABN 49 079 354 519 nor any other member of the AMP Group (AMP) makes any representations or warranties as to the accuracy or completeness of any statement in it including, without limitation, any forecasts. Past performance is not a reliable indicator of future performance. This document has been prepared for the purpose of providing general information, without taking account of any particular investor’s objectives, financial situation or needs. An investor should, before making any investment decisions, consider the appropriateness of the information in this document, and seek professional advice, having regard to the investor’s objectives, financial situation and needs. This document is solely for the use of the party to whom it is provided. This document is not intended for distribution or use in any jurisdiction where it would be contrary to applicable laws, regulations or directives and does not constitute a recommendation, offer, solicitation or invitation to invest.