


Econosights
Dual Mandate, Double Trouble?
The two goals of the RBA’s dual mandate – price stability and full employment - may become a challenge for the central bank as inflation is trending higher while the labour market looks to be unravelling quicker than expected.
7 min read

Key points
The two goals of the RBA’s dual mandate – price stability and full employment - may become a challenge for the central bank as inflation is trending higher while the labour market looks to be unravelling quicker than expected.
While the central bank will ultimately need to weigh the risks associated with its dual mandate, we believe that labour market conditions will take precedence over any moderate upside surprises in the September quarter inflation data.
We still expect further rate cuts from the RBA, with the next move a 25 basis point cut in November, to 3.35%
Introduction
The two primary goals for the Reserve Bank of Australia are price stability and full employment, otherwise known as the “dual mandate”. But recent inflation figures have surprised higher and labour force data has weakened, showing that the two policy goals may be moving in the wrong direction. We unpack this further in this edition of Econosights.
The dual mandate – a long-standing RBA objective
Price stability means low and stable inflation, with the RBA having a flexible 2-3% target band (as measured by the annual change in the consumer price index), ultimately targeting the midpoint of the target. Full employment means having the maximum level of employment that is consistent with low and stable inflation, and this is determined by a range of labour market indicators. Usually, these two goals are complementary over the long-term. For example, usually elevated inflation occurs when the labour market has strengthened, so the response from monetary policy would be to increase interest rates, which would weaken labour market conditions and reduce inflation (and vice versa).
Over 2022 – 2024 Australia had high inflation (running well above the 2.5% midpoint target) and a very low unemployment rate (see the chart below).
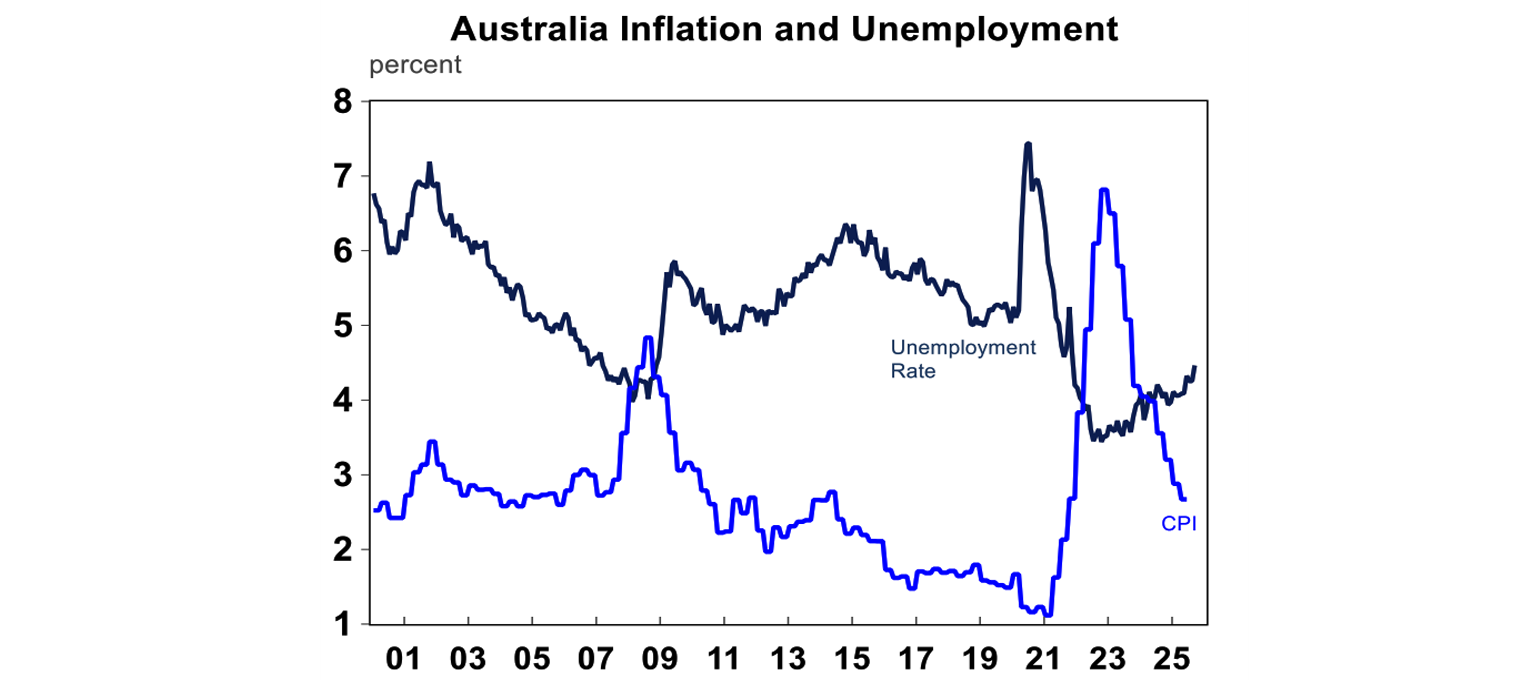
The interest rate hikes over 2022–2023 played a key role in bringing inflation down, but they also contributed to a softening in the labour market, with the unemployment rate edging slightly higher.
Housing and market services inflation has been surprising higher
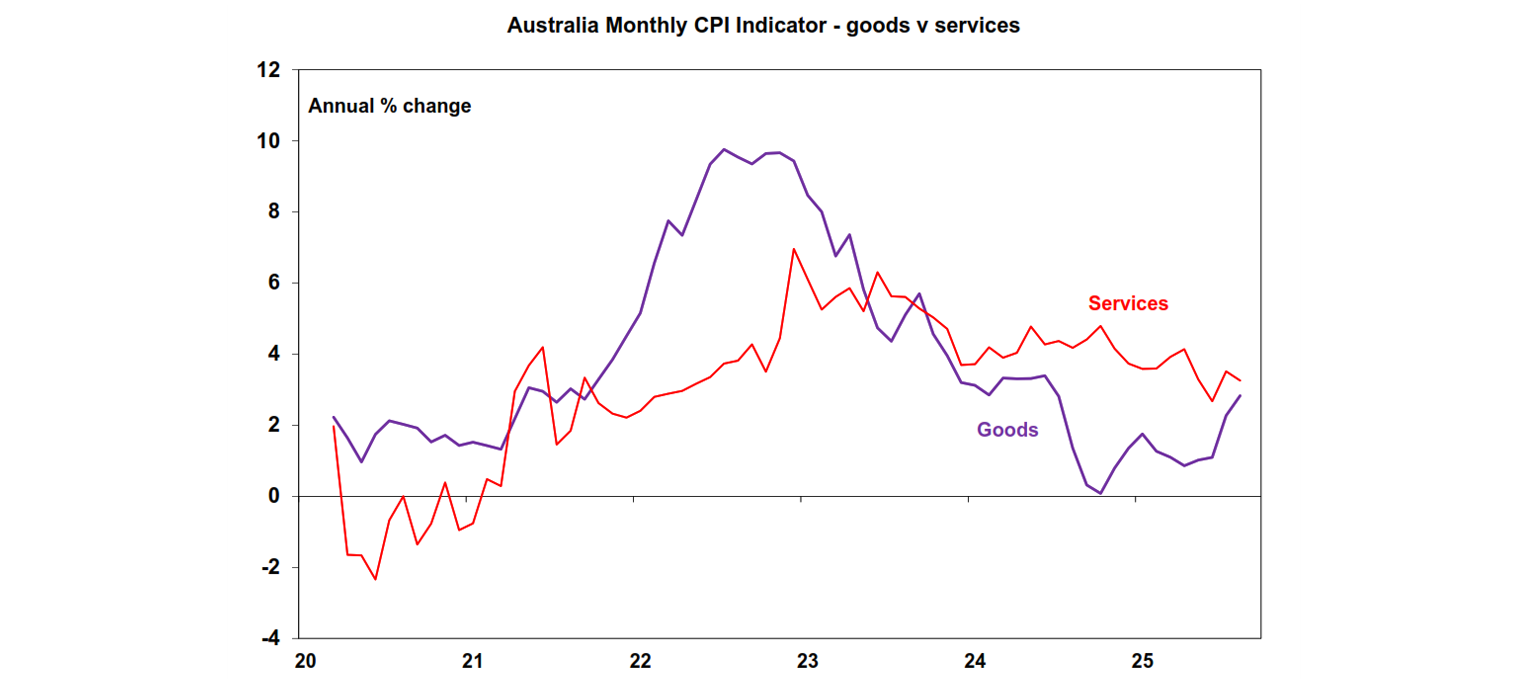
The monthly inflation indicator for July and August surprised to the upside, particularly in new dwelling construction costs and market services prices. Services inflation has been sticky in Australia, but this has (so far) been somewhat offset by lower goods inflation (see the chart below). But now goods inflation has been trending up again, particularly for food. The headline CPI (on the monthly figures) is at up by 3% over the year to August (mostly due to bounce back in electricity prices) and the trimmed mean is at 2.6%. For the September quarter, we expect headline CPI to rise by 0.9% (or 2.8% over the year) with the trimmed mean up by 0.7% or 2.6%. But the risk is with a higher inflation reading. As the RBA was forecasting trimmed mean to be up 0.6% over the quarter (2.5% year on year), actual September quarter inflation is going to beat the RBA’s forecasts and could cause the RBA to question its assumption that longerterm inflation is headed back to the mid-point.
The labour market is no longer “tight”
Full employment (or more technically the Non-Accelerating Inflation Rate of Unemployment or NAIRU) is the maximum level of employment that is consistent with low and stable inflation. The unemployment rate does not necessarily equal zero when full employment is reached because there will always be “frictions” in the labour market which includes seasonal workers, people in between jobs, skills of candidates not matching requirements.
At full employment, it will be harder for businesses to find staff so they may start offering workers higher wages to retain them and may offer higher wages to attract new workers. This tends to put upward pressure on wages growth and therefore inflation. When the economy is operating below full employment (i.e. operating with spare capacity), businesses can -4 -2 0 2 4 6 8 10 12 20 21 22 23 24 25 Australia Monthly CPI Indicator - goods v services Annual % change Goods Services OCTOBER 2025 Dual Mandate, Double Trouble? easily find other staff, so there is downwards pressure on wages growth, as employees are not trying to bargain between each other.
There are economic models that can be used to estimate the NAIRU, but there tends to be large variability around these estimates because the actual level of NAIRU is not observed directly, it has to be inferred by how the labour market is behaving and the level of wages growth. The RBA had been assuming that Australia’s current NAIRU was around 4.5% or just under, and the Commonwealth Treasury was assuming around 4¼% on its latest estimates.
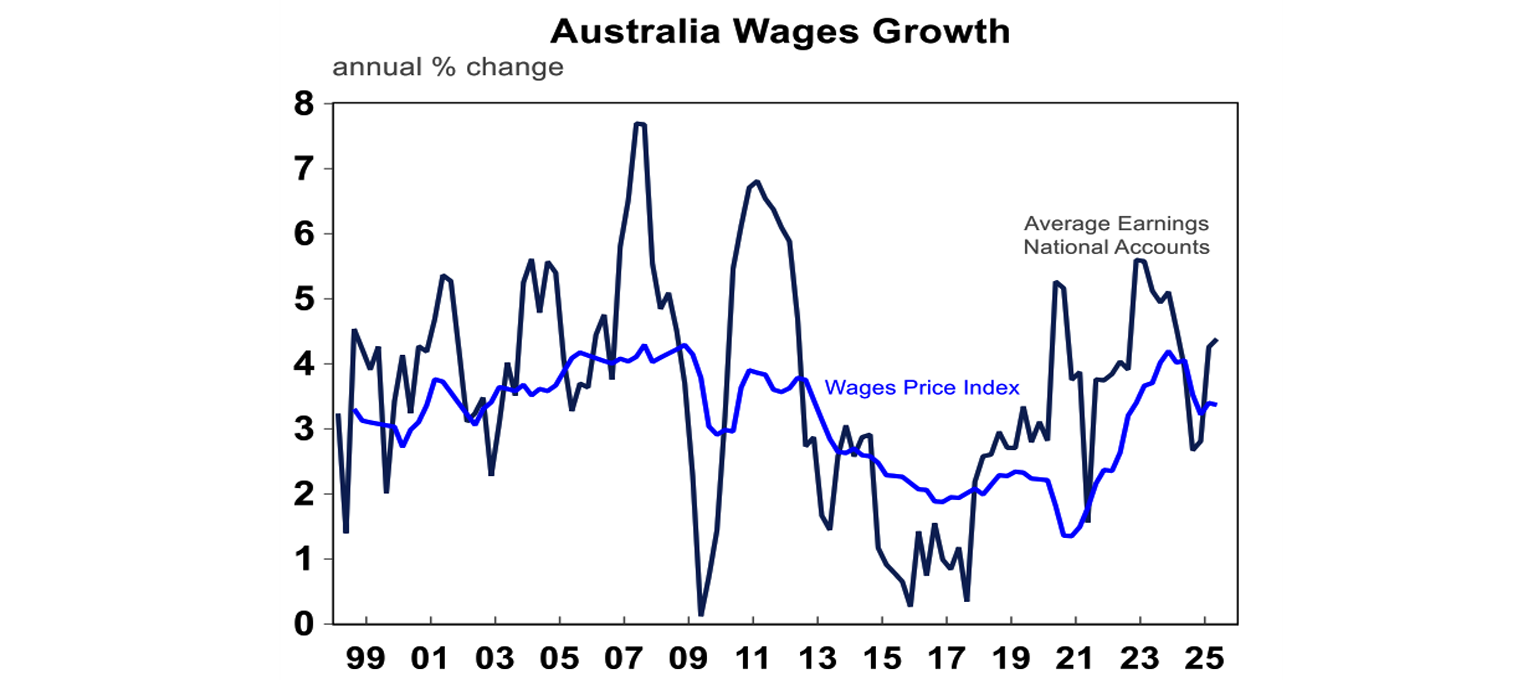
However, our view is that NAIRU is around 4% or even just under mostly due to the factors of globalisation, better matching of skills due to working from home and training programs (see more here) and the ease of finding suitable work thanks to technology. We think the “evidence” of a lower NAIRU is in the slowing of wages growth since its 2023 peak (see the chart below).
The RBA’s newly preferred measure of wages “Average Earnings National Accounts” is a proxy for the wages bill of the economy and is running at 4.4% over the year to June, down from its highs of 5.6% in 2022. The wage price index, a measure pf pure changes in wages that exclude compositional labour market changes is at 3.4% over the year to June, from a peak of 4.2%.
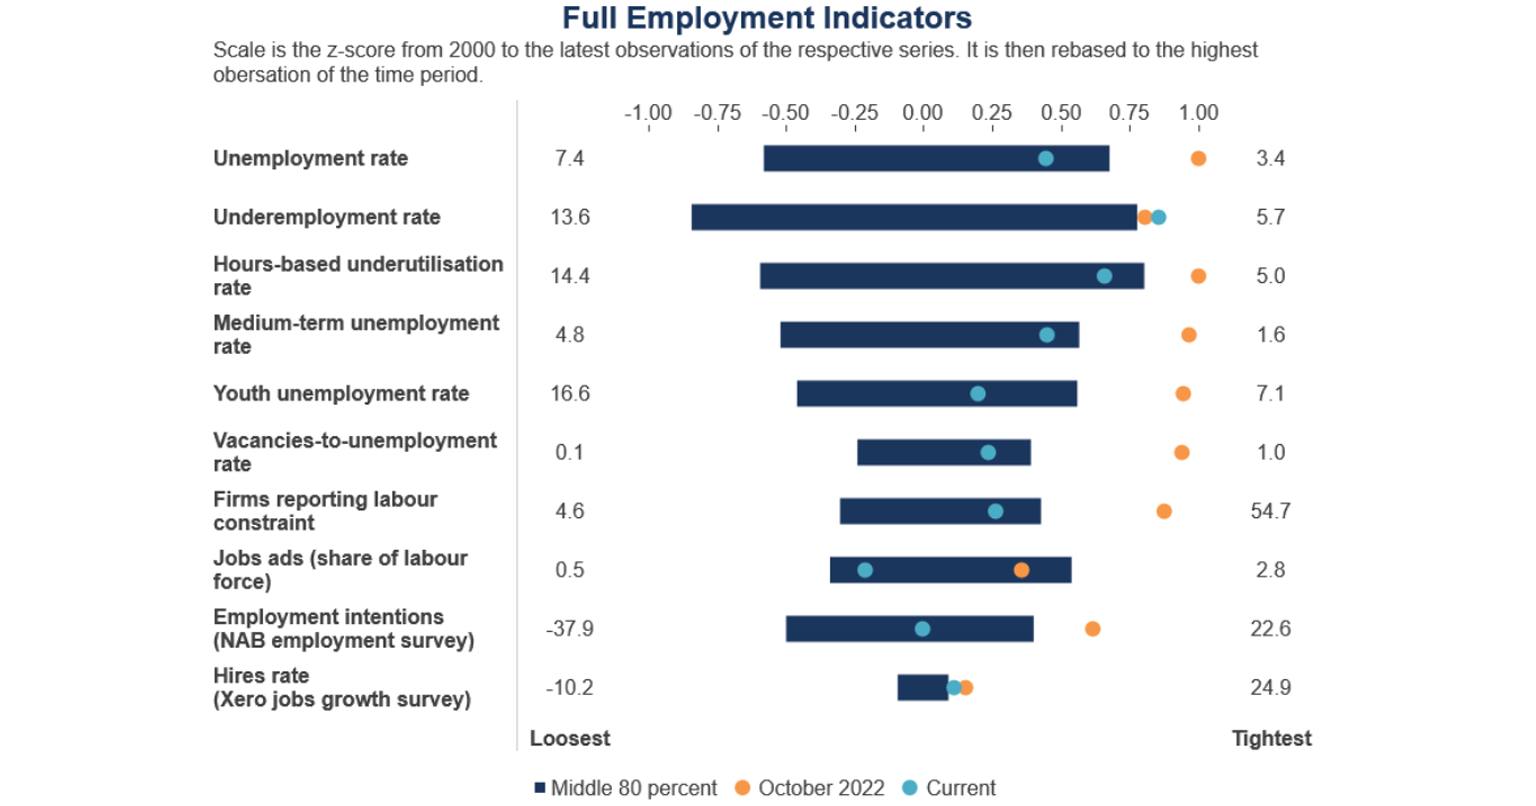
The RBA has a long list of “full employment” indicators which are in the table below. Most indicators have moderated back into the 80% historical average band which is also another sign that we have moved away from a “tight” labour market.
The dynamics between labour demand and supply show that labour supply continues to propel higher, while demand is moderating.
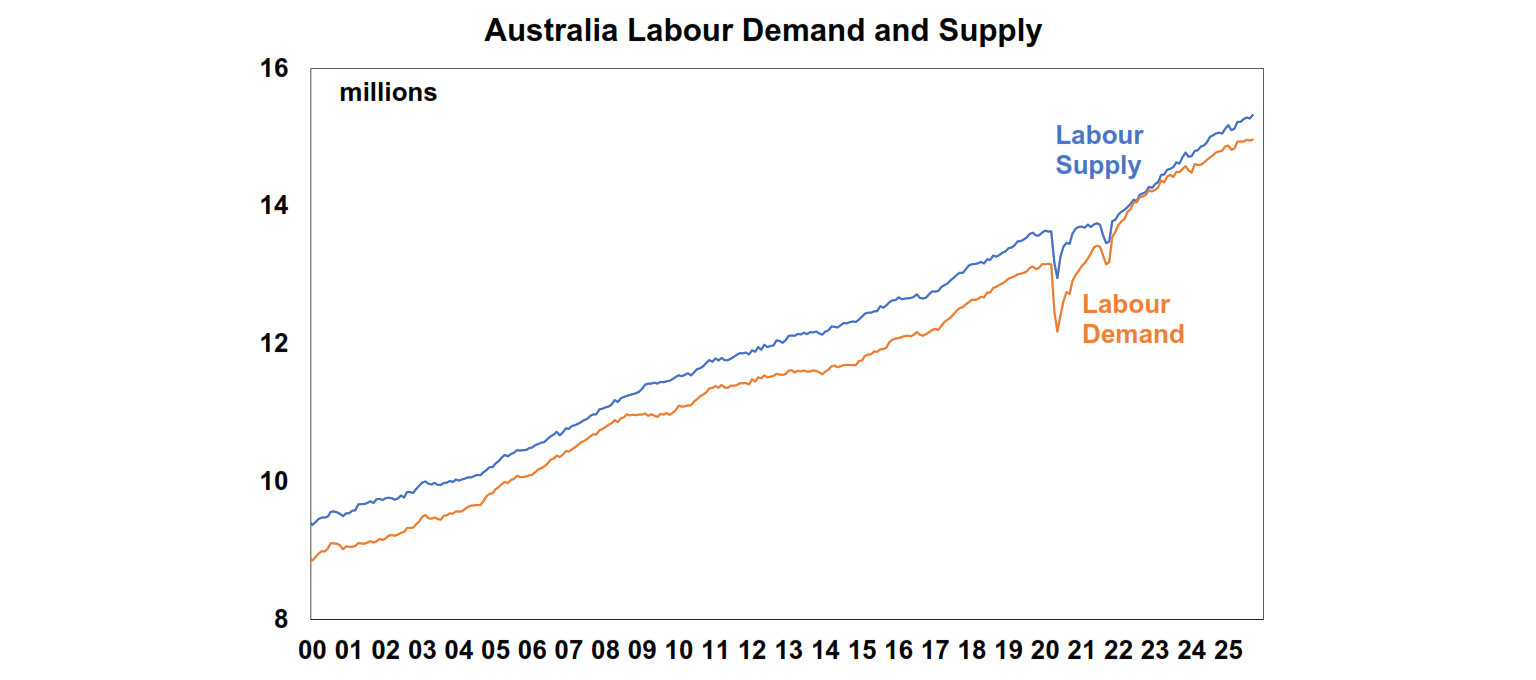
Labour supply is elevated from continued high levels of net migration, with growth in the working age population still running at 35-40K persons per month in recent periods.
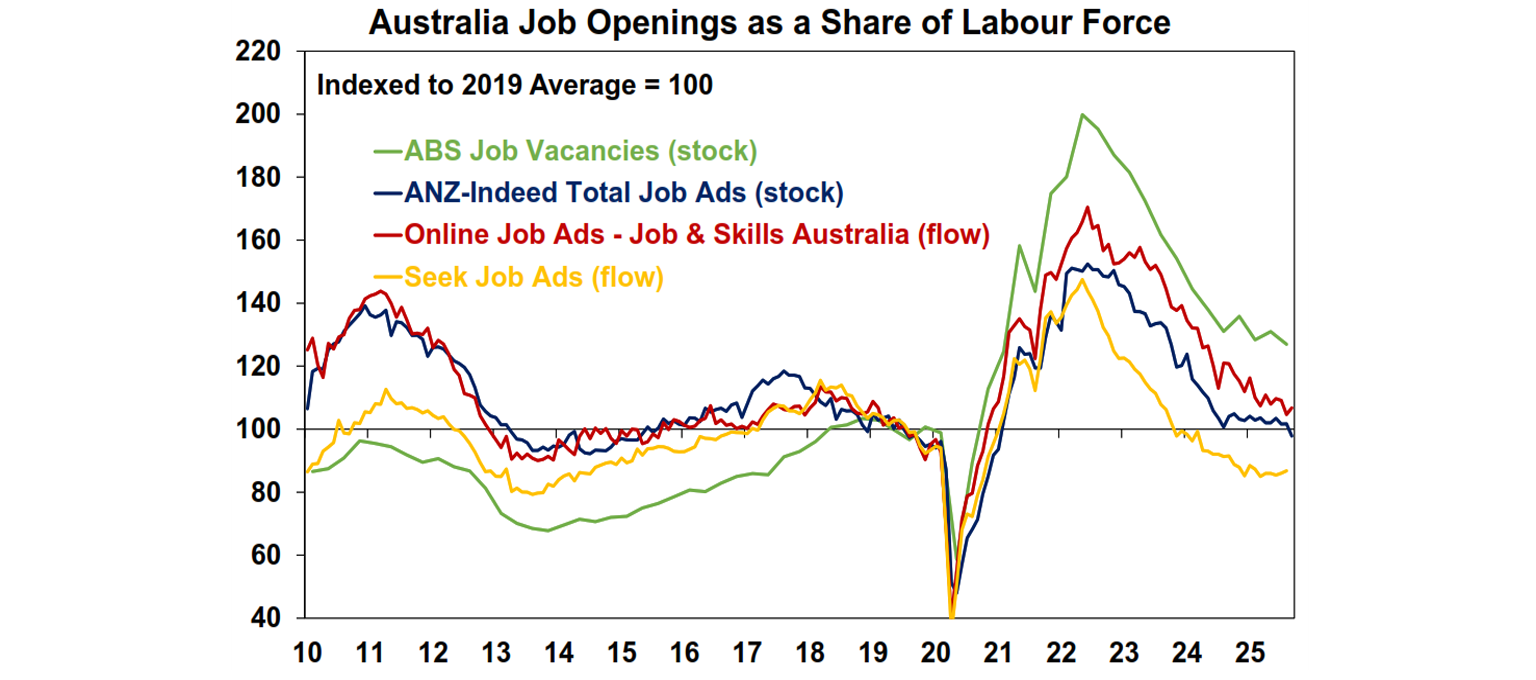
Demand for labour is slowing. The leading indicators of employment growth like the stock of job vacancies, job advertisements, online job ads are flat to down – see the chart below. Lower employment growth is most likely due to softer demand in non-market services, as public sector employment growth looks to have peaked after being the key contributor to jobs growth in the last 2 years.
Implications for investors
The September quarter inflation data (released later in October) is likely to show upside surprises to market services inflation. Australia is not the only country that has experienced pesky and persistent services inflation. It is also occurring in other major developed markets like the US and UK, reflecting some long-term dislocations from Covid. However, a weaker employment backdrop should see softer services inflation down the track. So, the RBA’s goals of getting inflation into the midpoint are not out of reach, it may just take a bit longer to get there.
While the central bank will ultimately need to weigh the risks associated with its dual mandate, we believe that labour market conditions will take precedence over any moderate upside surprises in the September quarter inflation data. As a result, we expect the RBA to cut the cash rate in November, which would take the cash rate from 3.6% to 3.35% although the votes of the Monetary Policy Board are likely to be split, so it’s a close call.
The other issue is that the market is not yet concerned by “stagflation” fears (which is high inflation and unemployment at the same time) but this is still possible. This would make the central bank’s job harder and it would be negative for GDP growth and company earnings which would spook sharemarkets. This is not our base case though and both inflation and unemployment are not high enough to cause this concern.
You may also like
-

Oliver's insights - Why have Australian living standards “fallen” and how do we fix it? For the last few years there has been much talk of a “cost-of-living” crisis in Australia and of “falling living standards”. This has flared up again lately with the pickup in inflation resulting in a renewed fall in real wages. -

Weekly market update - 10-07-2026 Ceasefire over but markets are also over the war, Why oil prices can't go too low or too high, Is AI adding to inflation risk or taking it away, and Australia’s wage problem. -

How to protect yourself from phishing and impersonation scams Phishing scams can look like everyday messages – emails, texts or calls. Learn the signs and simple steps to protect your money and personal information.
Important information
Any advice and information is provided by AWM Services Pty Ltd ABN 15 139 353 496, AFSL No. 366121 (AWM Services) and is general in nature. It hasn’t taken your financial or personal circumstances into account. Taxation issues are complex. You should seek professional advice before deciding to act on any information in this article.
It’s important to consider your particular circumstances and read the relevant Product Disclosure Statement, Target Market Determination or Terms and Conditions, available from AMP at amp.com.au, or by calling 131 267, before deciding what’s right for you. The super coaching session is a super health check and is provided by AWM Services and is general advice only. It does not consider your personal circumstances.
You can read our Financial Services Guide online for information about our services, including the fees and other benefits that AMP companies and their representatives may receive in relation to products and services provided to you. You can also ask us for a hardcopy. All information on this website is subject to change without notice. AWM Services is part of the AMP group.
Important note: While every care has been taken in the preparation of this document, neither National Mutual Funds Management Ltd (ABN 32 006 787 720, AFSL 234652) (NMFM), AMP Limited ABN 49 079 354 519 nor any other member of the AMP Group (AMP) makes any representations or warranties as to the accuracy or completeness of any statement in it including, without limitation, any forecasts. Past performance is not a reliable indicator of future performance. This document has been prepared for the purpose of providing general information, without taking account of any particular investor’s objectives, financial situation or needs. An investor should, before making any investment decisions, consider the appropriateness of the information in this document, and seek professional advice, having regard to the investor’s objectives, financial situation and needs. This document is solely for the use of the party to whom it is provided. This document is not intended for distribution or use in any jurisdiction where it would be contrary to applicable laws, regulations or directives and does not constitute a recommendation, offer, solicitation or invitation to invest.