


Econosights - How tight is Australia’s labour market?
The strength of Australia’s labour market post-Covid has been a surprise to economists. Job vacancies, a forward-looking signal for the labour market, suggest that employment growth is unlikely to slow much further and the unemployment rate may flat-line from here. Job advertisements and the NAB employment indicator have moderated more than the vacancies data.
8 min read

Key points
Job vacancies, a forward-looking signal for the labour market, suggest that employment growth is unlikely to slow much further and the unemployment rate may flat-line from here. Job advertisements and the NAB employment indicator have moderated more than the vacancies data.
Skills shortages in public-related roles and construction are keeping job vacancies high. Businesses may want to keep vacancies open from fear that shortages will worsen again.
Slower growth in public consumption and investment from budget constraints will see lower momentum for growth in public-sector related roles from here but jobs growth in the private sector may be slow to pick up as capital spending plans are modest and household consumption is weak.
The RBA still views the labour market as tight and moving towards its full potential, which may risk keeping wages growth (and inflation) elevated. However, we think that the unemployment rate is now above its full employment level. In our view, wages growth is going to continue easing to sub 3% per annum by early 2026, while the RBA sees wages growth running a tad higher.
We do not see the strength in the labour market as a threat to the RBA’s 2-3% inflation target. There is a risk that keeping interest rates higher for longer will put undue upward pressure on the unemployment rate.
Recent trends in the labour market
The strength of Australia’s labour market post-Covid has been a surprise to economists. The unemployment rate reached a 48-year low of 3.4% in October 2022, underemployment (the percent of people who would like to work more hours) also fell to 5.9% in early 2023 (its lowest level since 2000) and the participation rate kept rising and recently reached a record high of 67.2% (see the chart below).
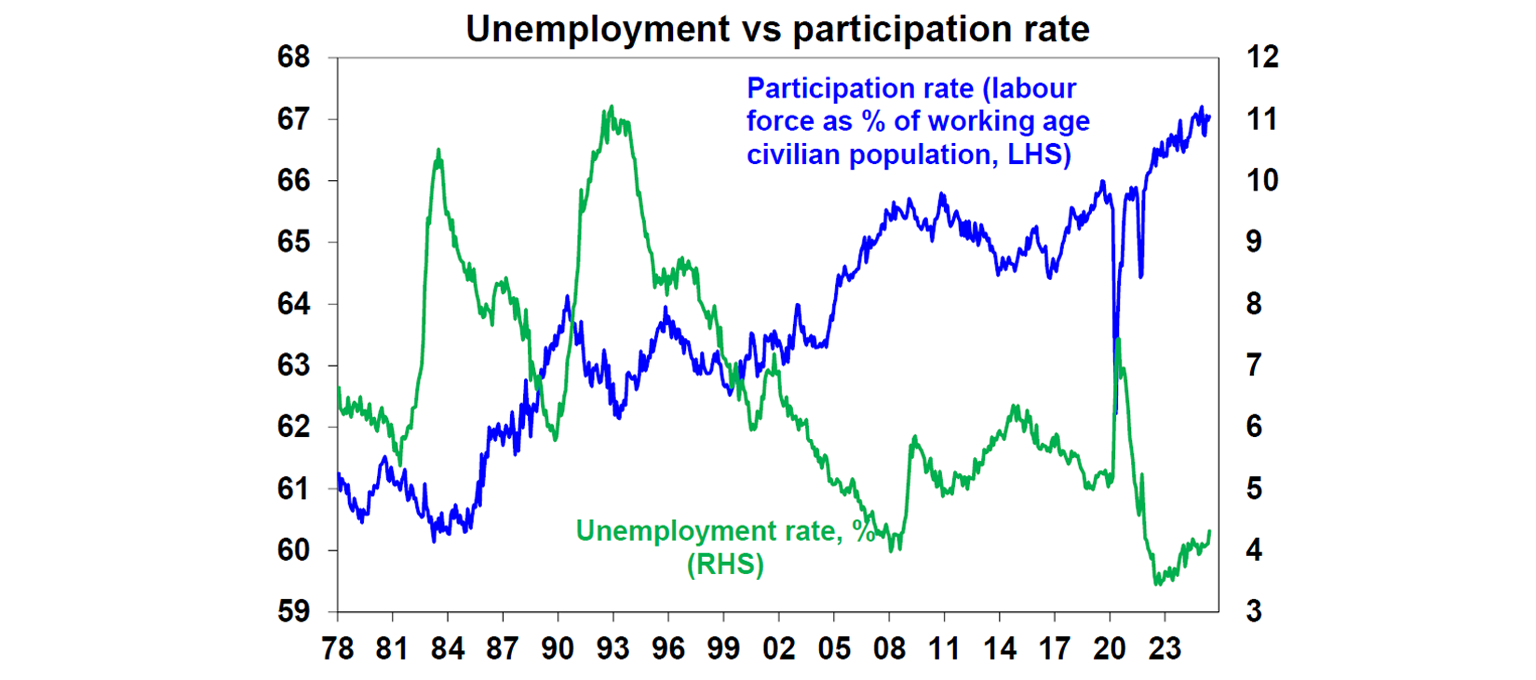
These outcomes compared very favourably to the pre-Covid period when the unemployment rate was running consistently above 5%.
It was expected that the labour market would slow over 2024-2025 from the lagged impacts of rising interest rates and the GDP growth slowdown. History shows that the unemployment rate would have risen by around 1 percentage point 12 months after the start of the growth slowdown (see the chart below). In contrast the current experience shows that nearly 3 years after the start of the growth slowdown, the unemployment rate is only up by 0.9 percentage points.
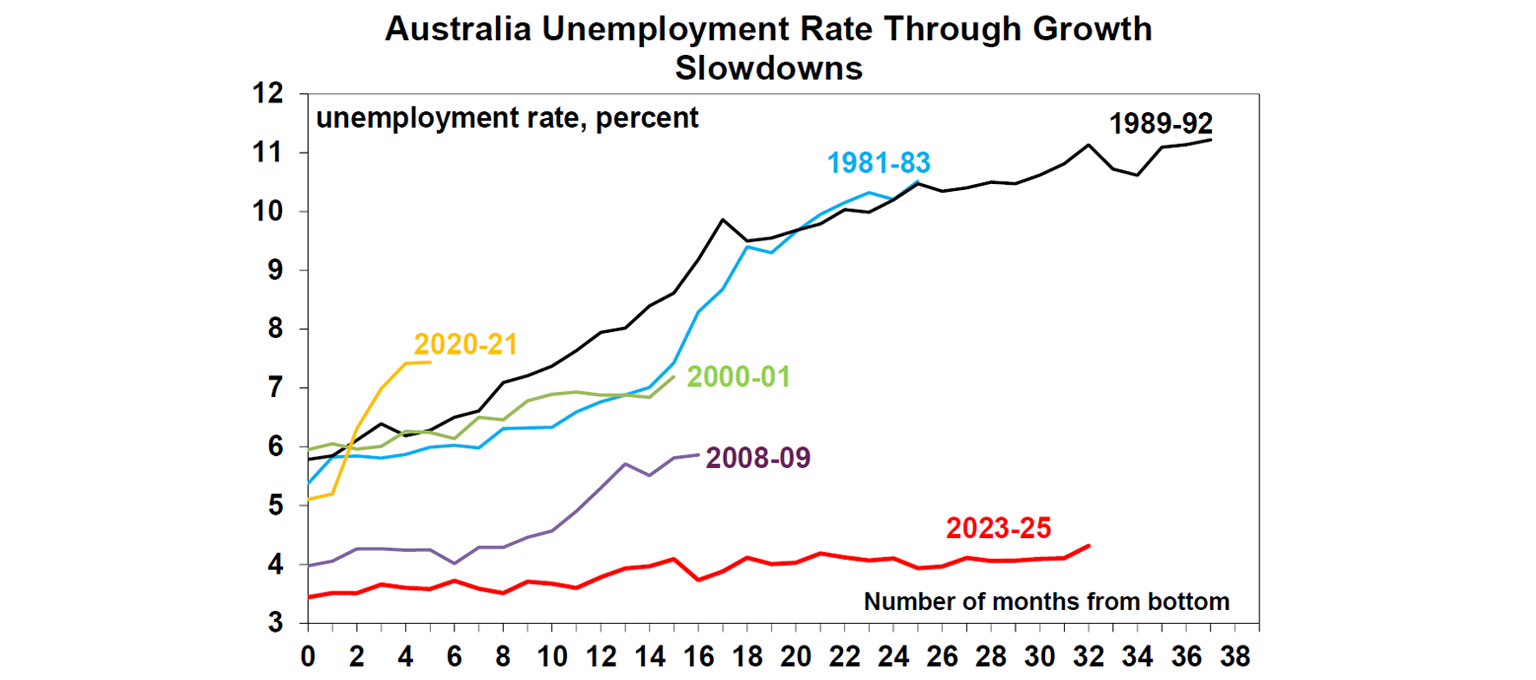
The RBA’s view is that the labour market has adjusted in other ways in the recent cycle (not just through job losses and therefore a higher unemployment rate) including lower job vacancies, a drop in hours worked and a reduction in voluntary job quits.
Labour market conditions are highly linked to wages growth. When labour market conditions are “tight” (employment growth is strong and unemployment rate is low which makes it easier for people to find new work), wages growth tends to increase and vice versa. Following the cyclical decline in the Australian unemployment rate over 2021-22, wages growth started rising and reached an annual high of 4.3% in December-2023.
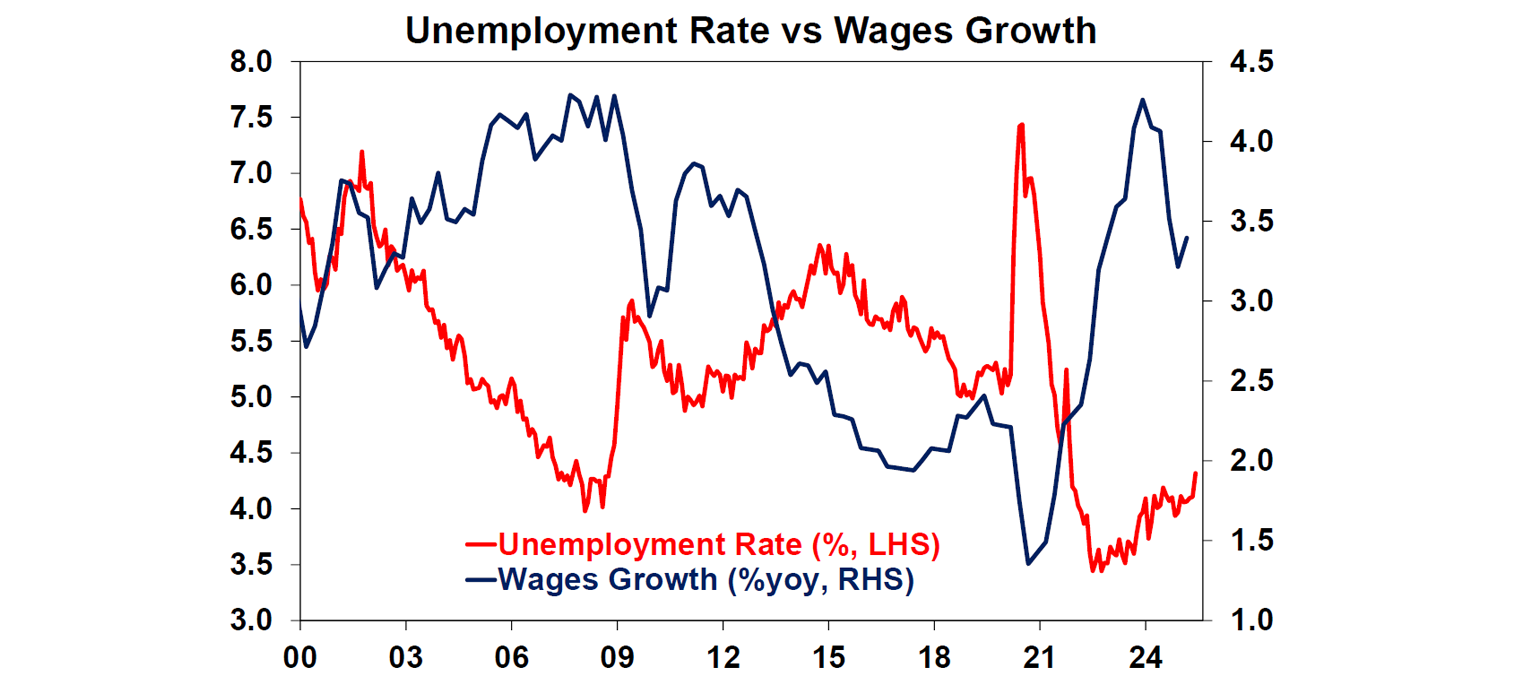
Over this period both private and public sector wages rose. The Fair Work Commission decision to lift the minimum and award wage rates (to be close to the high rates of growth in consumer price inflation at the time) as well as Federal and state government pay rises to specific industries like healthcare, aged care, transport and childcare were a major driver of stronger wages growth in this period, because it set off a strong of high wage demands from various public sectors and even trinkled down into the private sector.
At the point when the unemployment rate was well under 4% and wages growth was running above 3.5% per annum, the labour market was characterised as being very “tight” and operating above its “full employment level”. We have written about full employment before but here is another run down.
What is full employment?
Full employment (or more technically the Non-Accelerating Inflation Rate of Unemployment or NAIRU) is the maximum level of employment that is consistent with low and stable inflation. The unemployment rate does not necessarily equal zero when full employment is reached because there will always be “frictions” in the labour market which includes seasonal workers, people in between jobs, skills of candidates not matching requirements.
At full employment it will be harder for businesses to find staff so they may start offering workers higher wages to retain them and may offer higher wages to attract new workers. This tends to put upward pressure on wages growth and therefore inflation. When the economy is operating below full employment (i.e. operating below spare capacity), businesses can easily find other staff, so there is downwards pressure on wages growth, as employees are not trying to bargain between each other.
There are economic models that can be used to estimate the NAIRU, but there tends to be large variability around these estimates because the actual level of NAIRU is not observed directly, it has to be inferred by how the labour market is behaving and the level of wages growth. The RBA had been assuming that Australia’s current NAIRU was around 4.5%, and the Commonwealth Treasury was assuming around 4¼% on its latest estimates.
However, our view is that NAIRU is lower at 4% or a bit less mostly due to the factors of globalisation, better matching of skills and training programs and the ease of finding suitable work thanks to technology. We think that the Australian labour market is operating below full employment (i.e. there is some spare capacity again) as wages growth has slowed from over 4% per annum at its peak to 3.4% as at March.
What do the leading indicators of employment show?
The RBA places weight on the leading indicators of the labour market, including job vacancies, job ads and the employment sub-components of business surveys. Job openings as a share of the labour force have moderated from their highs but some measures (like the ABS job vacancies) still remain well above pre-Covid averages while the Seek job ads data has fallen more, back to 2013 lows and the NAB business survey employment indicator has also moderated noticeably in recent months.
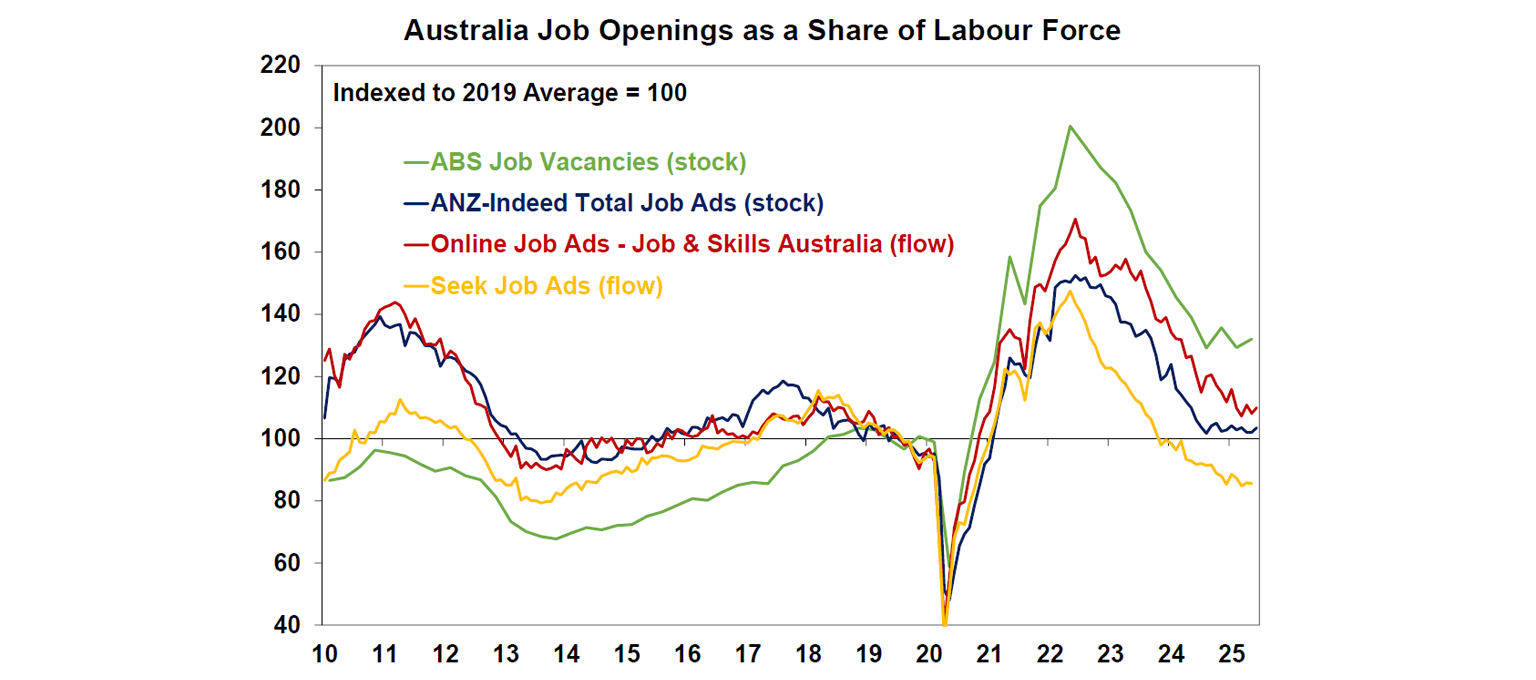
In recent months, most job vacancies figures have trended sideways, which could indicate better employment conditions ahead. There are also some other interesting trends that may be keeping job vacancies higher than usual including:
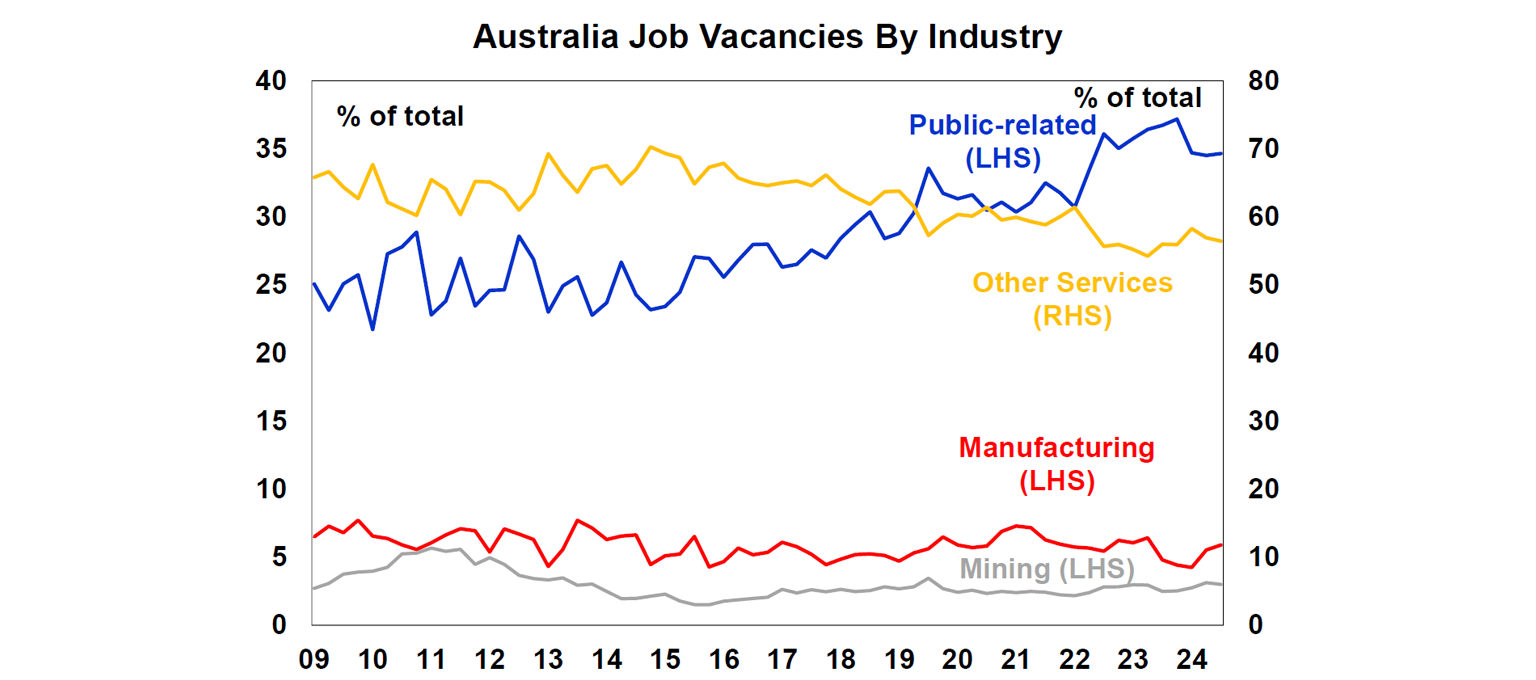
Ongoing skills shortages. The pandemic caused a huge rise in skills shortages, from the impact of prolonged closed international and state borders, at a time that demand was surging. While these shortages have eased (as indicated by the decline in businesses reporting suitable labour as a significant constraint to output), it is still much higher than its usual pre-Covid average. The 2024 government occupation shortage list shows that over 50% of the shortage is in public-sector related roles and construction. Public-related roles have seen a steady rise in job vacancies in recent years (see the chart below) against slower growth in vacancies across other industries. Elevated job vacancies are a sign that there is an associated skill shortage and labour market tightness, but it could also be businesses keeping vacancies open out of fear that labour shortages will get even worse. This means that job vacancies may remain high without generating additional employment growth.
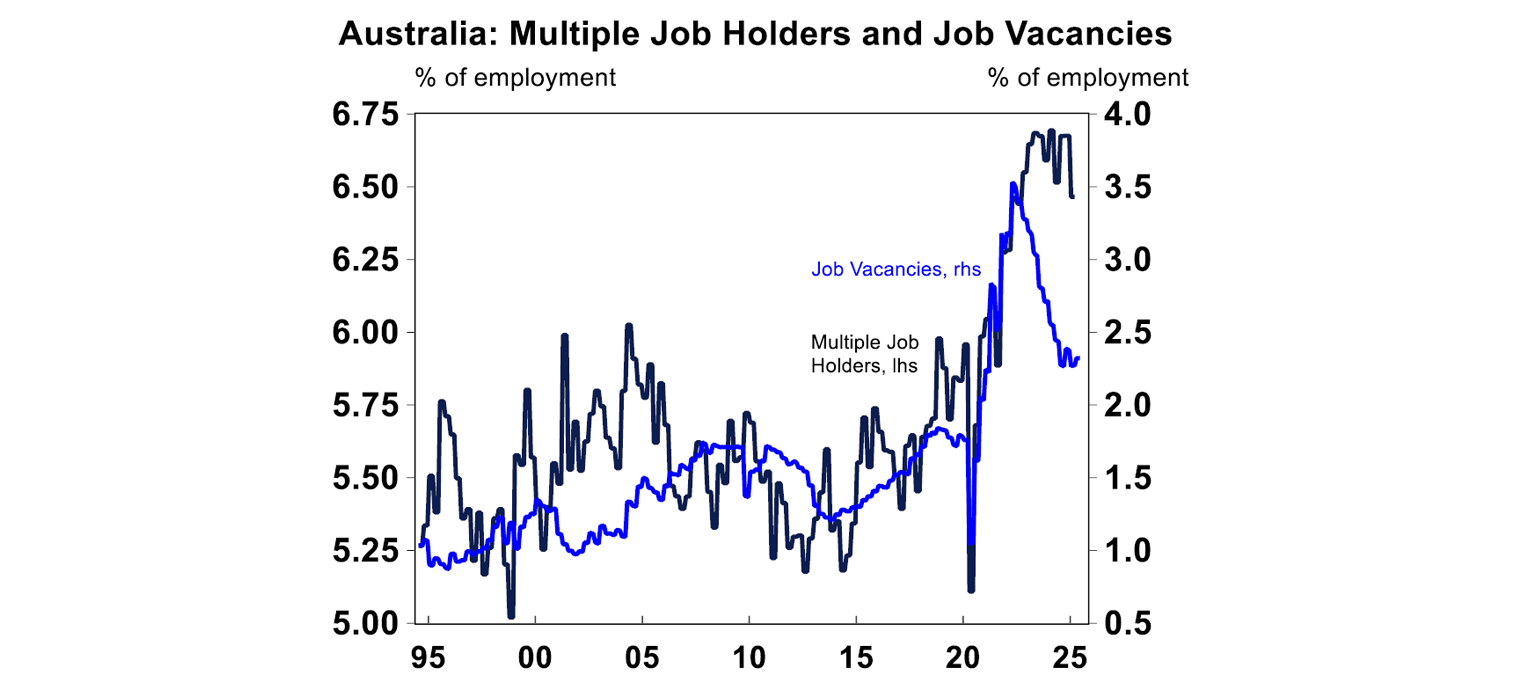
Multiple job holders. The number of multiple job holders has gone to a record high of 6.5%. (see the chart below). This could be because of a strong labour market encouraging more people into the market and reducing underemployment but it could also be a sign of the cost of living strain on households, encouraging people to seek additional work. Either way, higher multiple job holders could also be inflating job vacancies but from an employment point of view, holding multiple jobs does not benefit jobs growth, as you don’t get counted twice!
The impact of the public sector
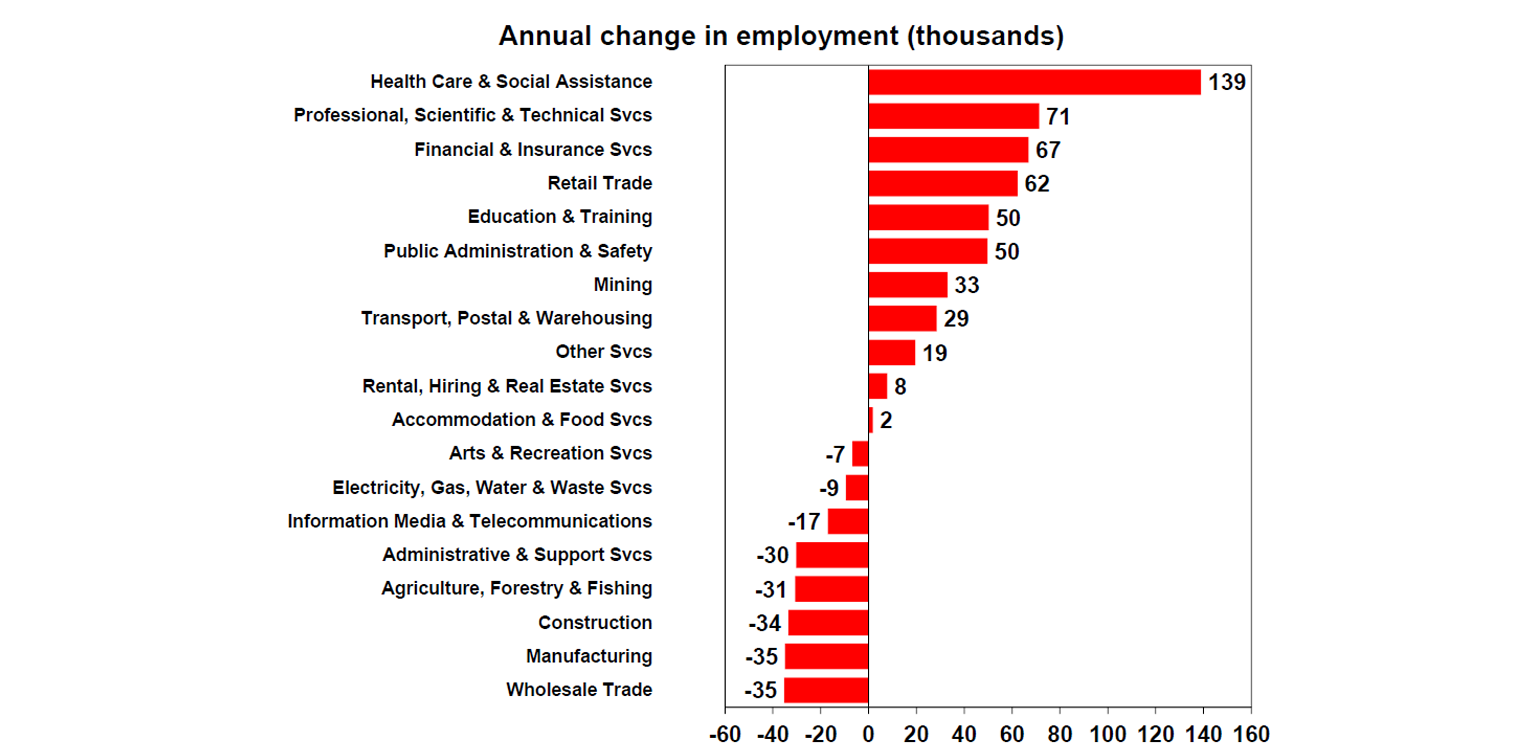
Another reason for the strength in the labour market is the impact of the public sector, including healthcare and social services, education, public administration and part of electricity, gas and waste utilities. Over 30% of jobs are related to the public sector. In the last 12 months, 70% of the job gains since have been from the public sector.
Through now public sector consumption and investment is slowing. Public spending was up by 3.8% over the year to March, down from 5.3% in the prior quarter and we expect the growth rate to moderate towards 2% over the near-term. This is likely to mean lower growth in public sector jobs.
The global experience
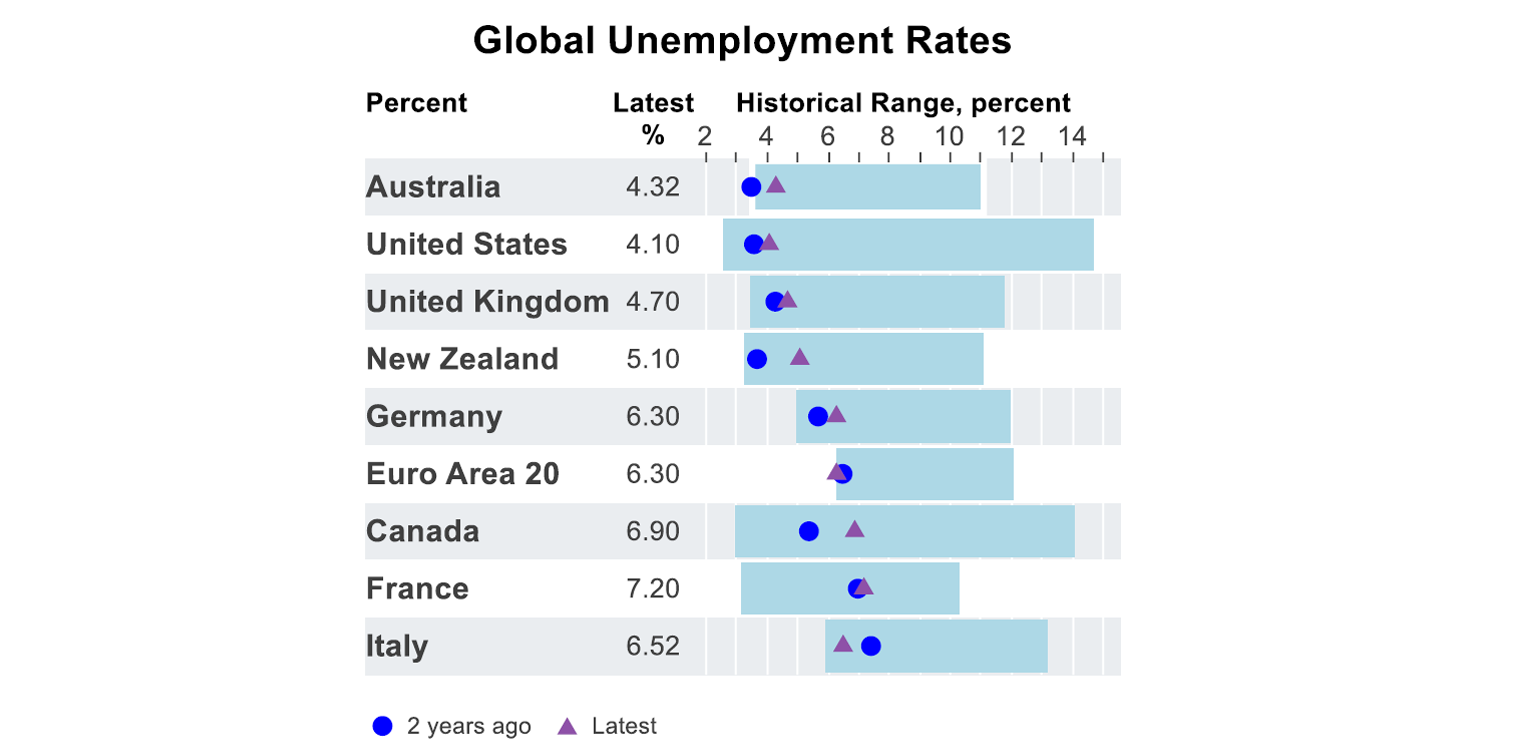
Australia’s experience in the post-Covid labour market has actually had some similarities to the US. Both countries have seen job ads remain elevated, compared to pre-pandemic averages. As well, the unemployment rate has only increased modestly in both the US and Australia. Similar patterns can also be some in the UK and Euro area. NZ and Canada have seen a much larger rise in the unemployment rate. The strength of global labour markets suggests that there may be global factors across markets, keeping labour markets strong. My view is that Covid has had some longer-term structural impacts to labour market dynamics including reducing NAIRU.
Most of our major peers are well underway in their rate cutting cycles and have not seen a reacceleration in either inflation or wages growth, which should be a good leading indicator for the RBA, who is still a relative laggard in the rate cutting cycle.
Implications for investors
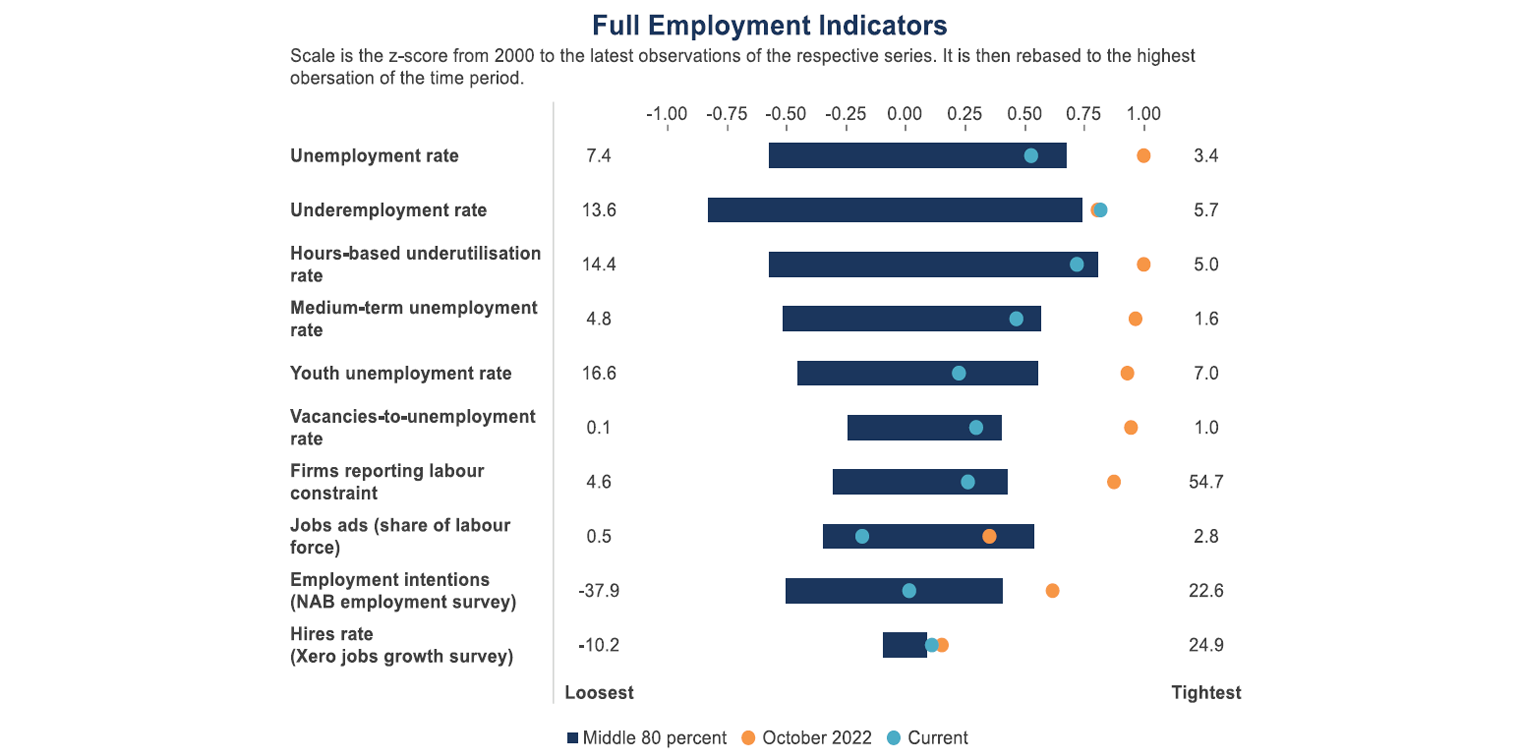
The RBA still views the labour market as “tight”. This is a fair assumption as the RBA list of full employment indicators (in the table below) shows that most are still in top range of the historical norm.
However, as we explained in this note, we are cautious at taking too much weight from the job vacancies figures, which could remain elevated for a while. We also expect public sector employment to slow from here. Private demand in the economy is modest. Private capital expenditure surveys indicate moderate growth ahead, but below recent years and household consumption is still weak. So it’s hard to see strong employment growth ahead. We expect a gradual increase in the unemployment rate from here, increasing to 4.5% in 2026 (from its current level of 4.3% in June). In our view, this is now a labour market running below its full employment level which should see a further moderation in wages growth, to below 3% per annum. There may be some pockets of public-sector related awarded wage increases, but the majority of those look to have already occurred in the last two years.
The RBA see the unemployment rate reaching 4.3% and remaining at this level over the forecast horizon (until mid-2027). Given the RBA’s expectation that full employment is at 4.5%, this means that they expect the labour market to remain tight for a while. So in that sense it’s unsurprising that they remain cautious about wages and the impact to inflation.
However, we do think that there is a risk of the unemployment rate rising faster than our own estimates if monetary policy is kept restrictive for too long. The labour market is not quickly unravelling so we are not arguing for a fast rate cutting cycle. However, the RBA’s caution around cutting the cash rate at the July meeting was a surprise to us. Financial markets see three more rate cuts (worth 25 basis points each) by June 2026 and we expect four. Perhaps the RBA could take some comfort from the global perspective that has not seen a sharp U-turn in wages despite moderate interest rate reductions. Most of Australia’s peers also had wages growth that was initially stronger than Australia, because Australia had a big rise in labour supply from a record high participation rate.
Diana Mousina
Deputy Chief Economist, AMP
You may also like
-

Oliver's insights - Why have Australian living standards “fallen” and how do we fix it? For the last few years there has been much talk of a “cost-of-living” crisis in Australia and of “falling living standards”. This has flared up again lately with the pickup in inflation resulting in a renewed fall in real wages. -

Weekly market update - 10-07-2026 Ceasefire over but markets are also over the war, Why oil prices can't go too low or too high, Is AI adding to inflation risk or taking it away, and Australia’s wage problem. -

How to protect yourself from phishing and impersonation scams Phishing scams can look like everyday messages – emails, texts or calls. Learn the signs and simple steps to protect your money and personal information.
Important information
Any advice and information is provided by AWM Services Pty Ltd ABN 15 139 353 496, AFSL No. 366121 (AWM Services) and is general in nature. It hasn’t taken your financial or personal circumstances into account. Taxation issues are complex. You should seek professional advice before deciding to act on any information in this article.
It’s important to consider your particular circumstances and read the relevant Product Disclosure Statement, Target Market Determination or Terms and Conditions, available from AMP at amp.com.au, or by calling 131 267, before deciding what’s right for you. The super coaching session is a super health check and is provided by AWM Services and is general advice only. It does not consider your personal circumstances.
You can read our Financial Services Guide online for information about our services, including the fees and other benefits that AMP companies and their representatives may receive in relation to products and services provided to you. You can also ask us for a hardcopy. All information on this website is subject to change without notice. AWM Services is part of the AMP group.