


Weekly market update
Investment markets and key developments
Global shares rose over the last week as the US share market rebounded on the back of increased confidence that the Fed will cut rates next month after Fed speakers turned more dovish amidst some softer US economic data.
14 min read

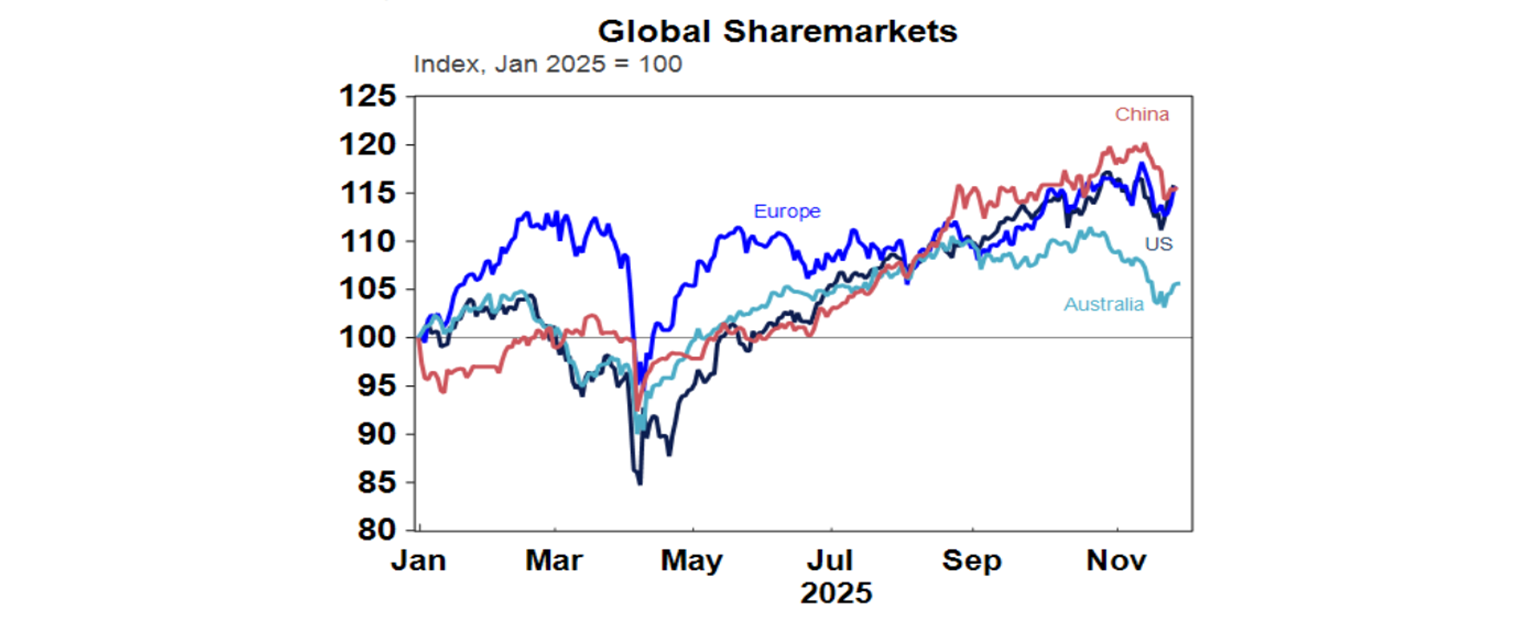
Global shares rose over the last week as the US share market rebounded on the back of increased confidence that the Fed will cut rates next month after Fed speakers turned more dovish amidst some softer US economic data. For the week US shares gained 3.7%, leaving them up 0.1% in November, Eurozone shares rose 2.8%, Japanese shares rose 3.3% and Chinese shares rose 1.6%. The positive global lead also pulled up Australian shares although they were constrained by a further rise in local inflation leading to talk that the next move by the RBA may be a rate hike later next year. The ASX 200 rose 2.3% for the week with gains led by IT, material, health and industrial shares. This still left it down 3% for November. Bond yields fell in the US and Europe but rose in Japan on increased expectations for another Bank of Japan rate hike next month and in Australia on the back of higher inflation and expectations that the next move by the RBA may be a rate hike.
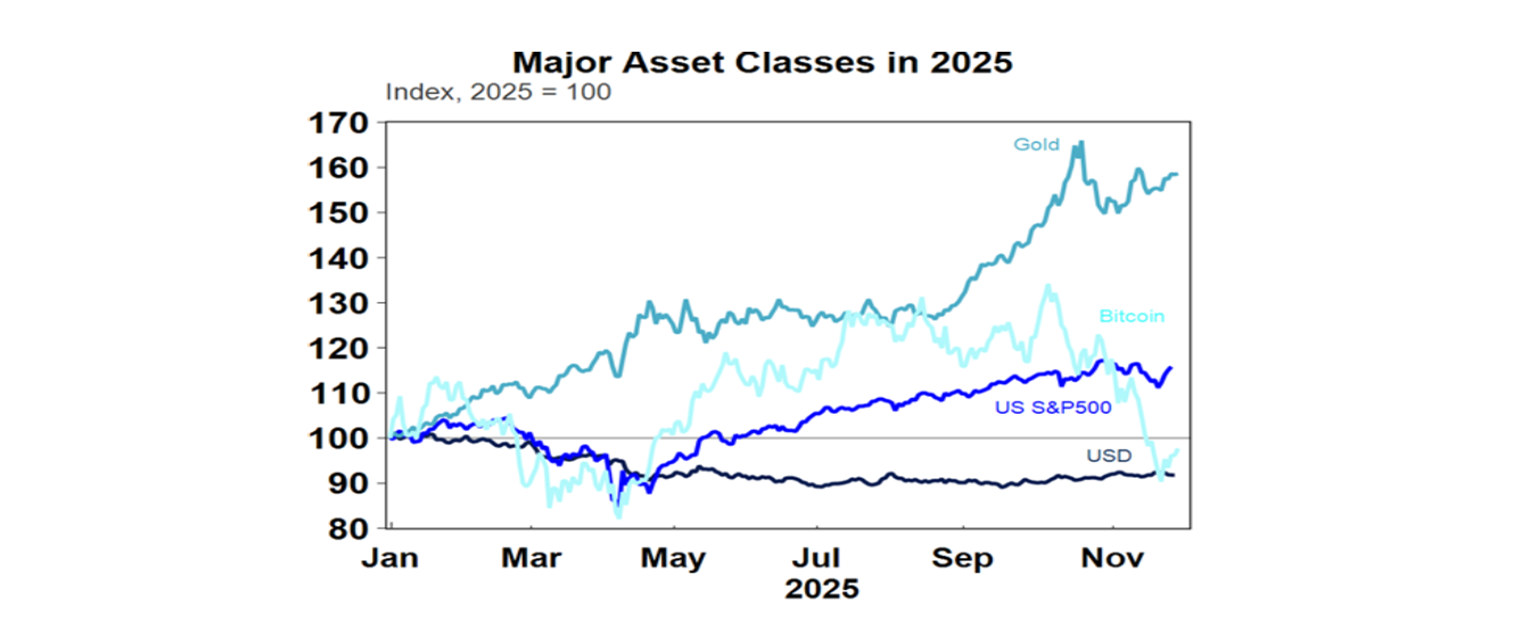
The past week saw gold and Bitcoin rise with share markets. Gold in particular, and maybe Bitcoin too, remain supported by concerns about Fed independence with President Trump likely to nominate Chair Powell’s replacement soon. Oil, metal and iron ore prices also rose over the last week. A fall in the $US and a widening expected Australian interest rate differential to the US saw the $A rise.
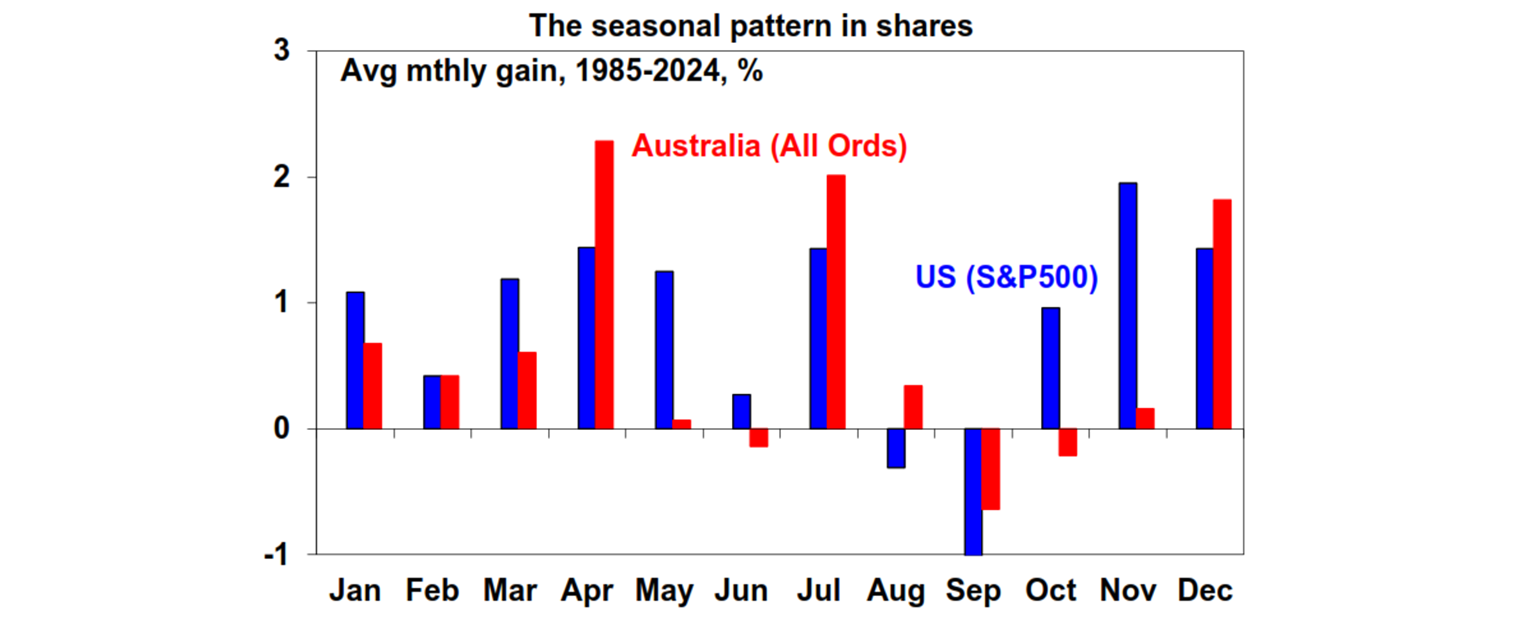
After a modest pull back from highs in October – with US and global shares falling about 5% and Australian shares about 7% – shares appear to be on the way back up again. The US share market is now just 0.6% below its record high. Concerns about valuations, an AI bubble and worries about whether the Fed will cut again have given way to positives around strong earnings, strong demand for AI, Trump pivoting towards more consumer friendly policies (with more talk of a $2000 tariff rebate), more positive noises around the US/China relationship and more dovish signs from the Fed. This has as usual flowed through to the Australian share market but its lagging again reflecting lower profit growth and an increasingly less positive outlook for the RBA’s cash rate. Positive seasonal pressures associated with the Santa rally may also be impacting. So far the rally in the US has come on good volumes and breadth with positive moves from consumer discretionary shares.
The worries around valuation and AI remain but this could be the case for a while as valuation is not a good timing tool and while there are some similarities to the late 1990s tech boom there are also many differences (with cheaper valuations, Nasdaq up less today, very strong tech profit growth and lower bond yields). Next year could be a more volatile year though as central banks get to the bottom on interest rates and US mid-term election years are known to be rough with an average top to bottom drawdown in shares of 17% in mid-term election years since 1950.
The battle for the Fed may soon start to hot up. President Trump’s desire for lower rates is well known, and reports indicate he will soon announce the next Fed Chair to succeed Jerome Powell. The three main contenders are current Fed Governor Waller, former Governor Warsh and White House National Economic director Hassett (of Dow 36,000 fame). Waller and Warsh would be seen as less of a threat to Fed independence, but Hassett would be seen as a threat given his closeness to Trump, and he is thought to be the front runner. If he is confirmed (and Trump may change his mind) it may lead to renewed concerns about the Fed’s inflation fighting credentials. It may not be a problem initially particularly if the US economy is still cooling but could become a concern over time and may further support demand for gold as a hedge against “currency debasement”. This issue also comes at a time when the concerns about weak jobs and inflation have been dividing the Fed with Fed hawks expressing their desire to leave rates on hold next month given the inflation concerns (and possibly also to send a signal to Trump that they won’t just roll over to his demands). Lately the hawks have gone a bit quiet again possibly to allow more room for Powell and to avoid perceptions of a “crisis of confidence” at the Fed but at least in the near term ongoing signs of softer jobs, a weak consumer and okayish inflation readings in the last week probably leave it on track to cut again next month with the market now putting the probability of a cut at 82%. This has been a big factor helping shares rebound although concerns about Fed independence may resurface at some point.
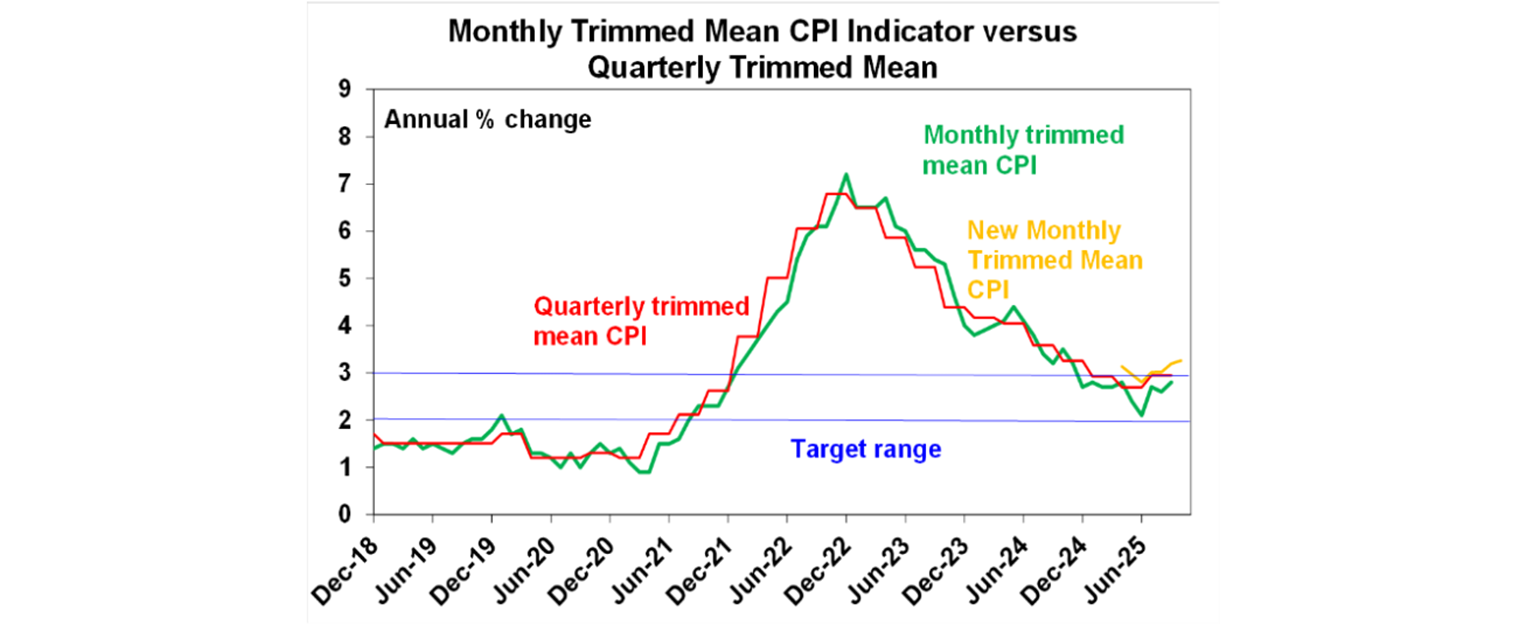
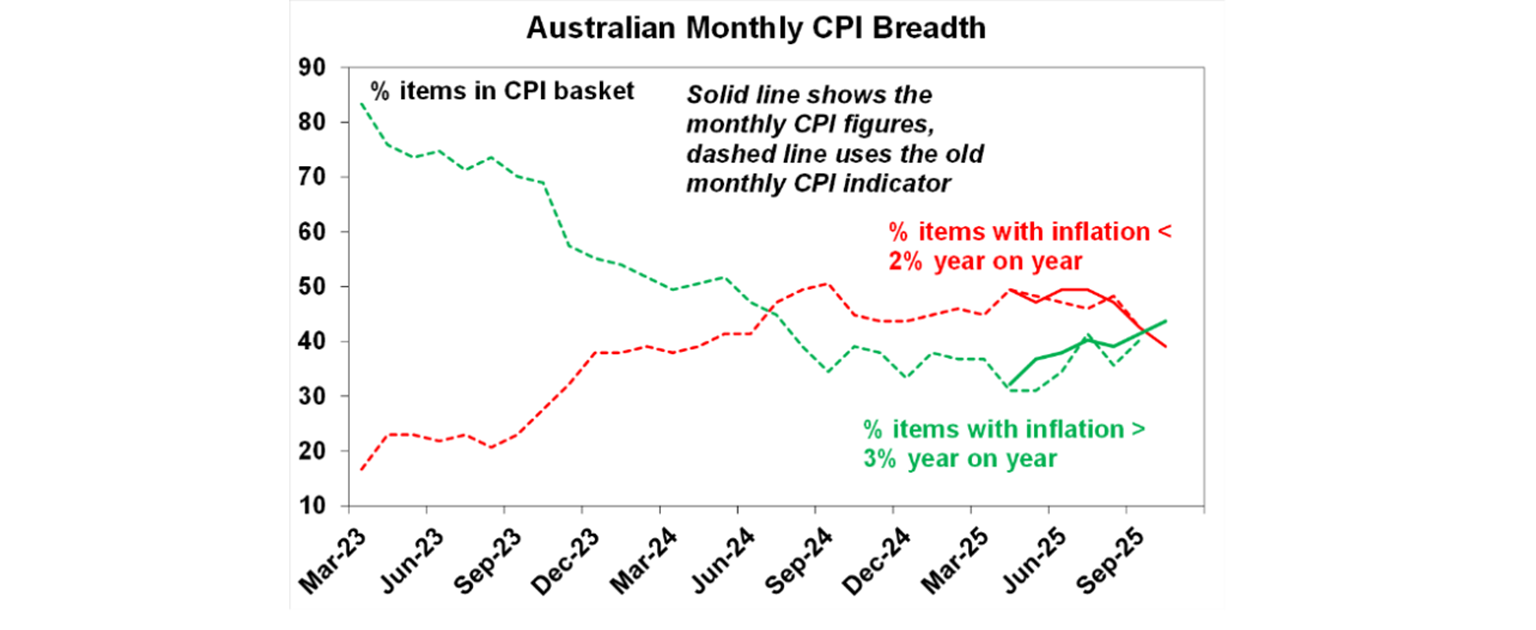
More bad news Australian inflation is now leading to talk of rate hikes next year. The bad news came in the form of the new full coverage monthly CPI (well at least 87% of items are now surveyed monthly) showing another lift in inflation in October to 3.8%yoy. What’s worse is that the all-important trimmed mean underlying inflation rate rose to 3.3%yoy. So both are now back above the target range.
And the rise was broad based with goods inflation well up from its lows, services inflation remaining elevated and there are now more CPI items again with inflation above 3%yoy than items below 2%yoy.
This was higher than expected and disappointing as we thought that the September quarter bounce in inflation was largely temporary and so would start to settle down again this quarter. With this not happening so far it will add even more to RBA caution and concern that we are bumping up against capacity constraints and has led to speculation that we will now see rate hikes next year – with some economists now forecasting that and the money market seeing a 20% chance of a hike by August next year and 41% by year end. This may be reinforced by September quarter GDP data to be released in the week ahead which is expected to show growth above RBA forecasts.
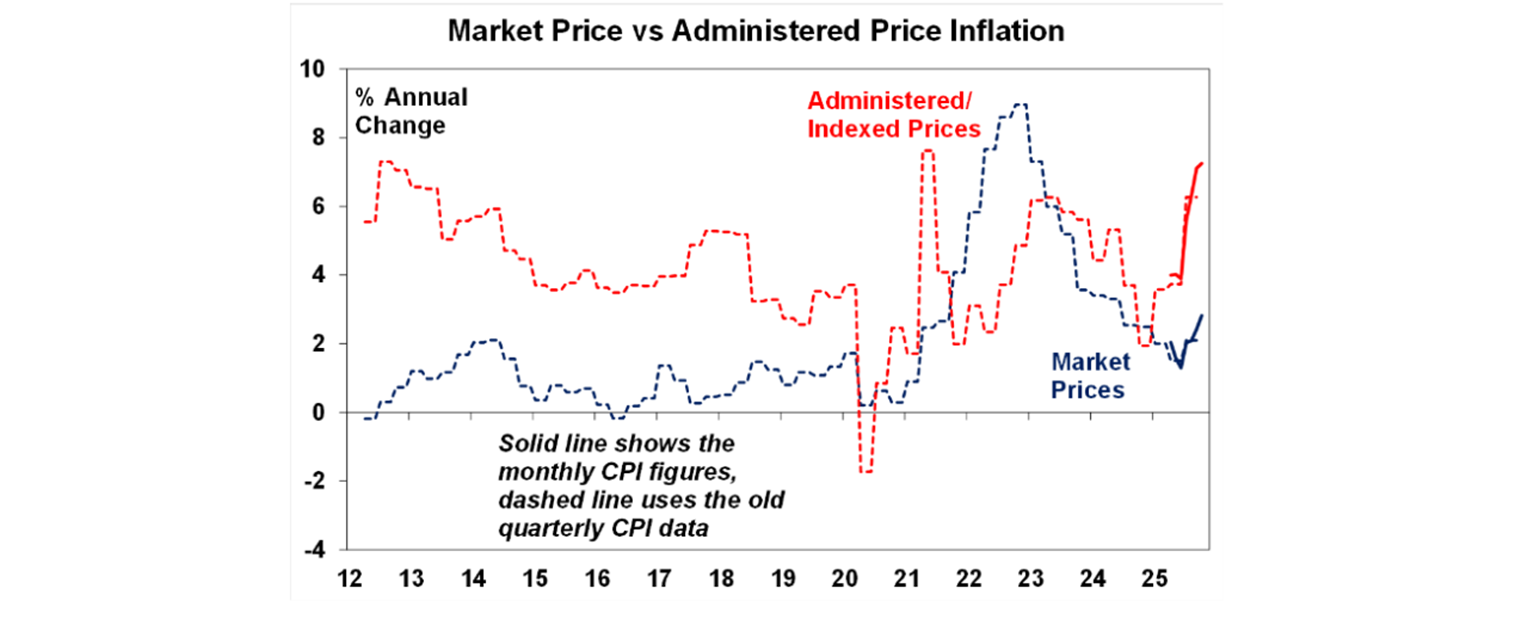
However, there are good reasons not to get to carried away just yet: the monthly full coverage CPI is new and will take a while to settle down and it looks odd that its now showing trimmed mean inflation running well above the trimmed mean in the Monthly CPI Indicator and even the quarterly trimmed mean for the last six months (see the second last chart above); November and December are likely to see a return to more price discounting with Black Friday sales etc; both the NAB and PMI business surveys have been reporting a falling trend in output price inflation in contrast to the CPI; much of the rise in inflation has been in government or regulator administered or indexed prices which are up 7.3%yoy and not in market determined prices which are up 2.8%yoy (see the next chart); and forward jobs market indicators still point to softer jobs growth and higher unemployment. So, we think another RBA rate cut next year is still possible but will require a run of softer inflation numbers back below target and higher unemployment. Given the recent run of data, we are not particularly confident! But given the still early stage of the economic recovery would see next year as too early to expect the RBA to start raising rates again. That’s more likely a 2027 story.
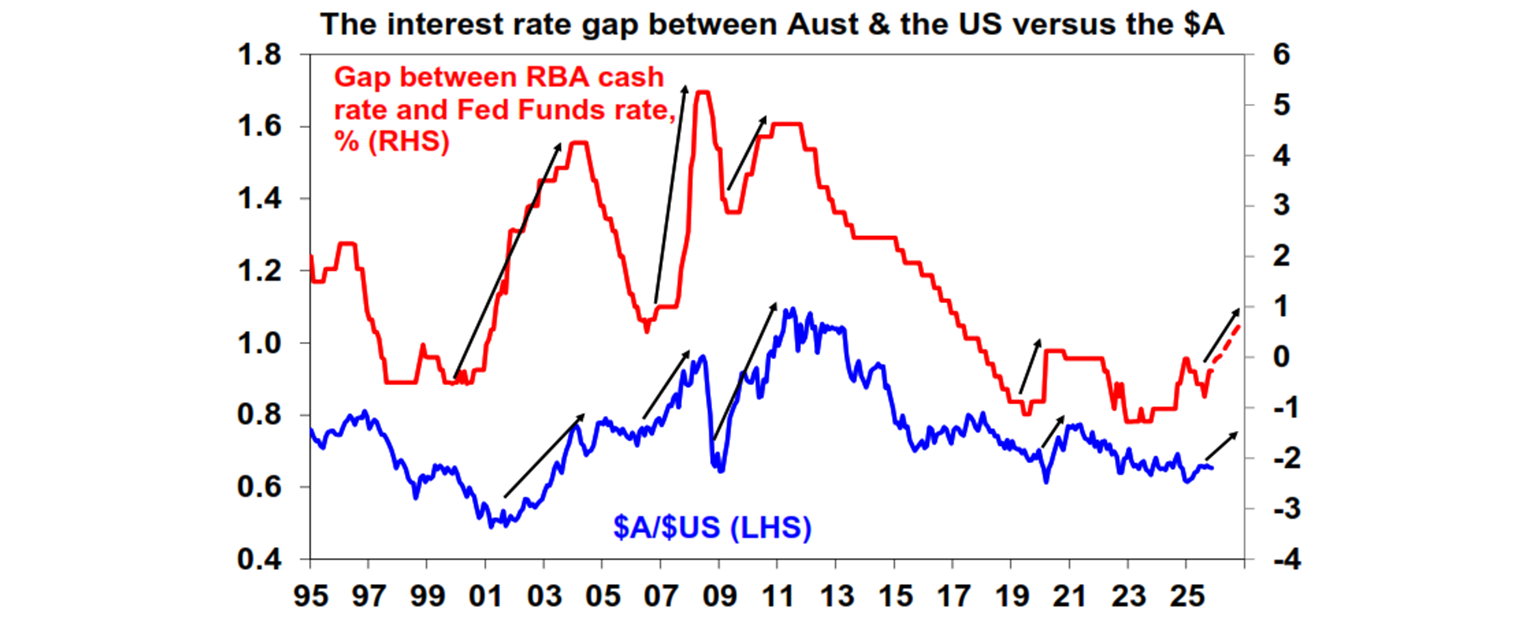
More support for the Australian dollar. With market expectations moving further against RBA cuts and Fed rate cut prospects getting a ramp up again over the last week the money markets’ expectation for the RBA/Fed interest rate differential is moving further in favour of the $A. See the next chart. One wonders whether this might be going a bit too far though – nearly 4 rate cuts are now projected by the US money market out to early 2027 against a high chance of RBA hikes. Surely the Australian economic outlook is not that much stronger than that for the US to justify such a different interest rate outlook.
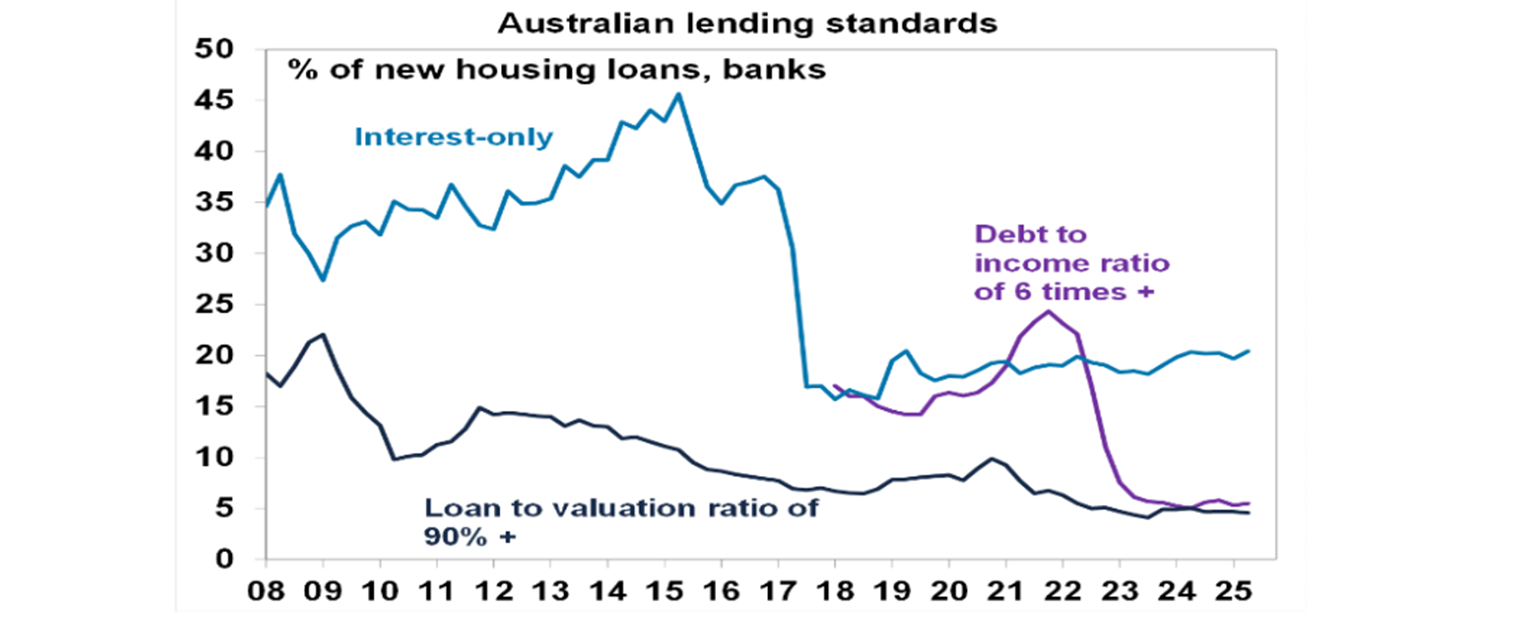
Macro prudential regulation to cool the property market is ramping up again in Australia. As had been widely flagged APRA announced it will cap the proportion of each bank’s housing lending that goes to borrowers with a debt-to-income ratio of six times or more at 20% from 1st February. This will be applied separately to each lender’s owner occupier and investor lending. It’s likely to impact investors (who tend to have higher DTI ratios) more than owner occupiers but could impact some first home buyers seeking to take advantage of the 5% deposit scheme. This follows a surge in investor lending and concerns that the property market may get too speculative. While the aggregate ratio is well below the 20% cap at present (see the next chart) and so may not really have much impact initially (except for some smaller banks) its clearly a pre-emptive move designed to cool investor activity before it gets too hot. If it doesn’t work (and some borrowers may try to get in ahead of the cap become binding so it could actually boost lending in the near term) APRA is likely to do more like putting a cap on investor credit growth like it did in 2014. For 2026 as a whole though the move to ramp up macro prudential controls and the chance of more to come along with the outlook for less rate cuts will constrain home price growth. We are lowering our 2026 national home price growth forecast to 5%, from 8-10% a few months ago.
After another week of noisy economic data and share market gyrations I always like a bit of head kandy. Cliff Richard’s tour of Australia reminded me that he produced quite a lot of that. He used to be seen as a bit of light weight version of Elvis with songs like Living Doll. But then in the late 1970s and through the 1980s he seemed to reinvent himself and came out with a run of excellent songs including We Don’t Talk Anymore and Wired For Sound.
Major global economic events and implications
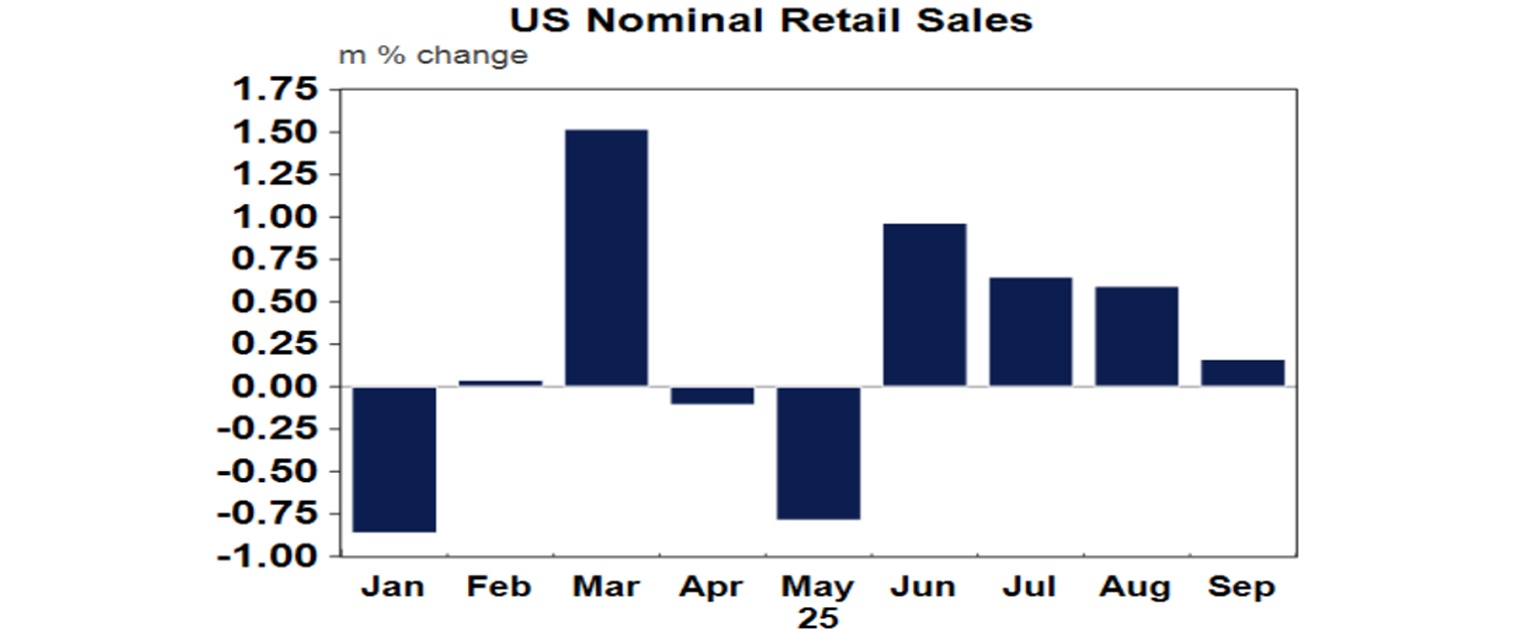
With the US Government reopening has come an increased flow of data and over the past week it has been mixed with a weaker consumer but solid business investment. September retail sales rose less than expected and were flat after excluding auto and gasoline sales.
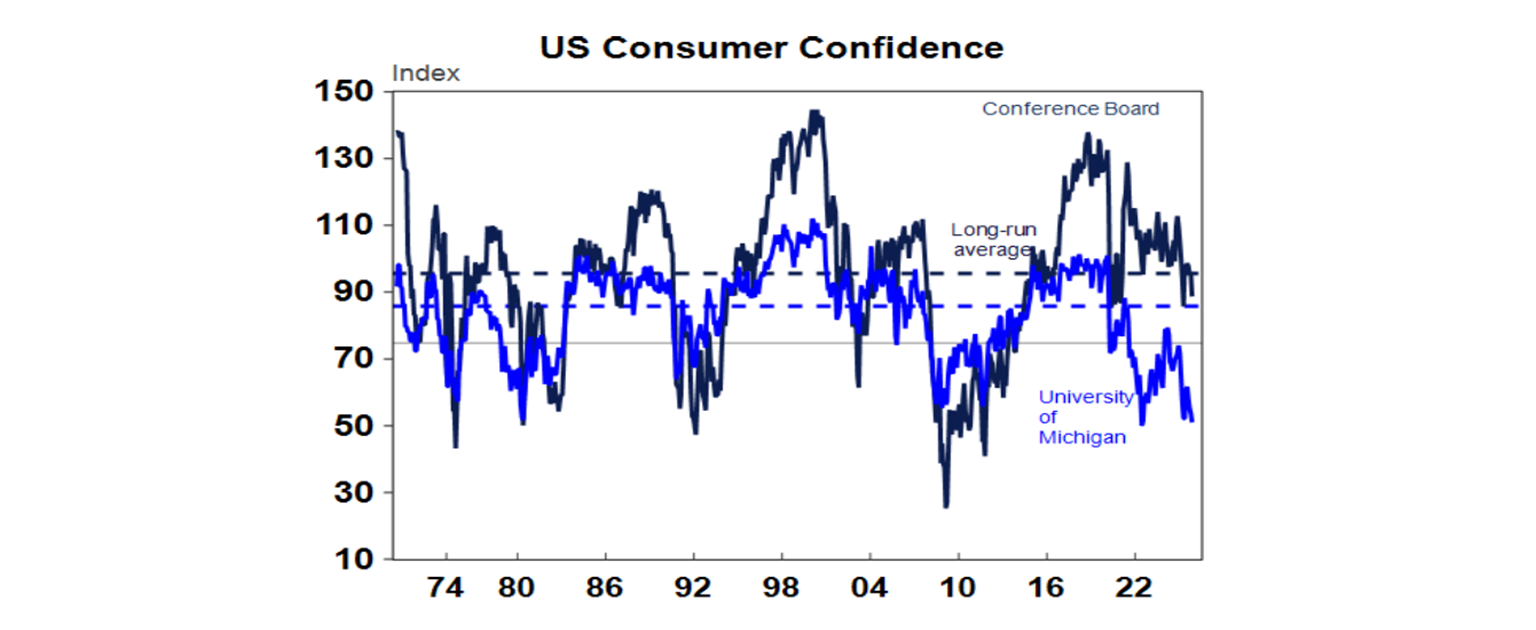
And falling consumer confidence doesn’t augur well for consumer spending. Home price growth remained soft at just 1.6%yoy. Initial jobless claims remain low but continuing claims remain in a modest rising trend and the trend in the ADP’s new weekly employment survey is weak. Against this durable goods orders for September rose in line with expectations and underlying capital goods orders and shipments both rose a stronger than expected 0.9%mom with August revised up and remain in rising trends. Strong AI related capex is helping here. Overall the Fed’s Beige Book of anecdotal evidence saw little change in economic activity, with weak consumer spending and employment and moderate price growth.
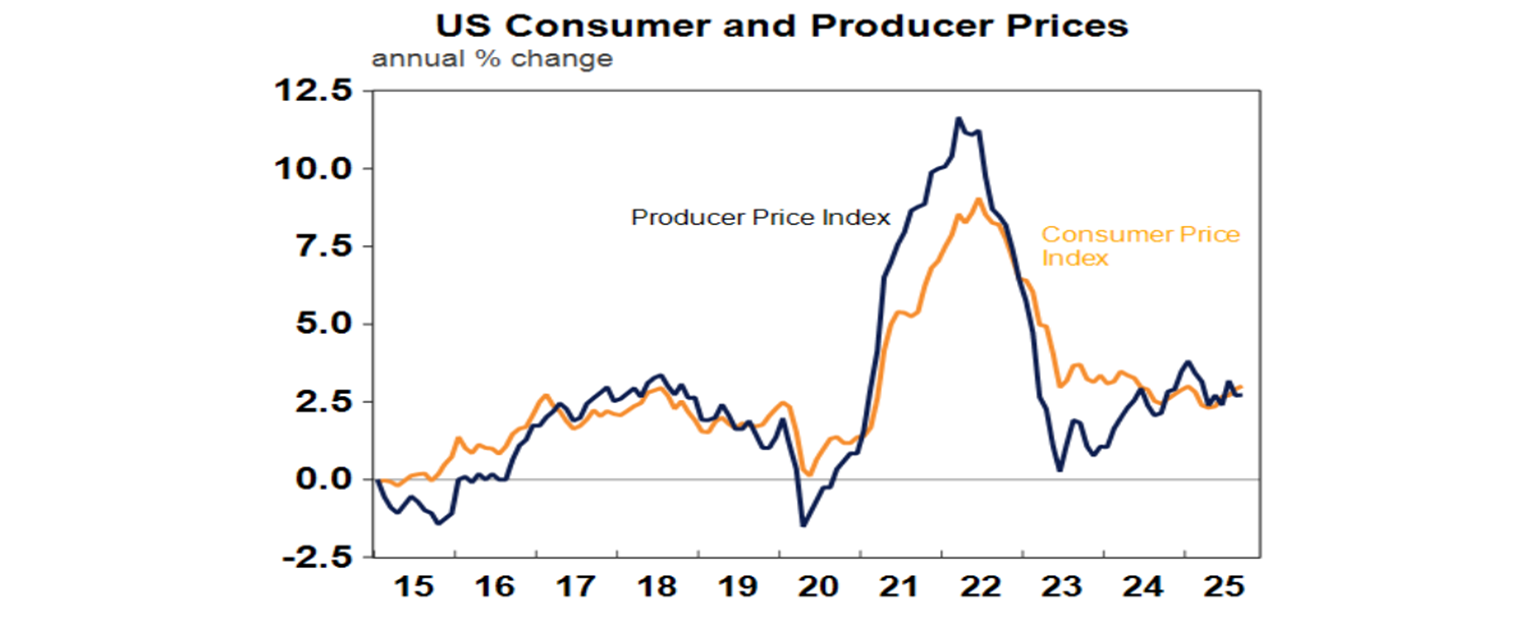
Meanwhile, US core producer price inflation came in weaker than expected for September - at least it’s not accelerating further.
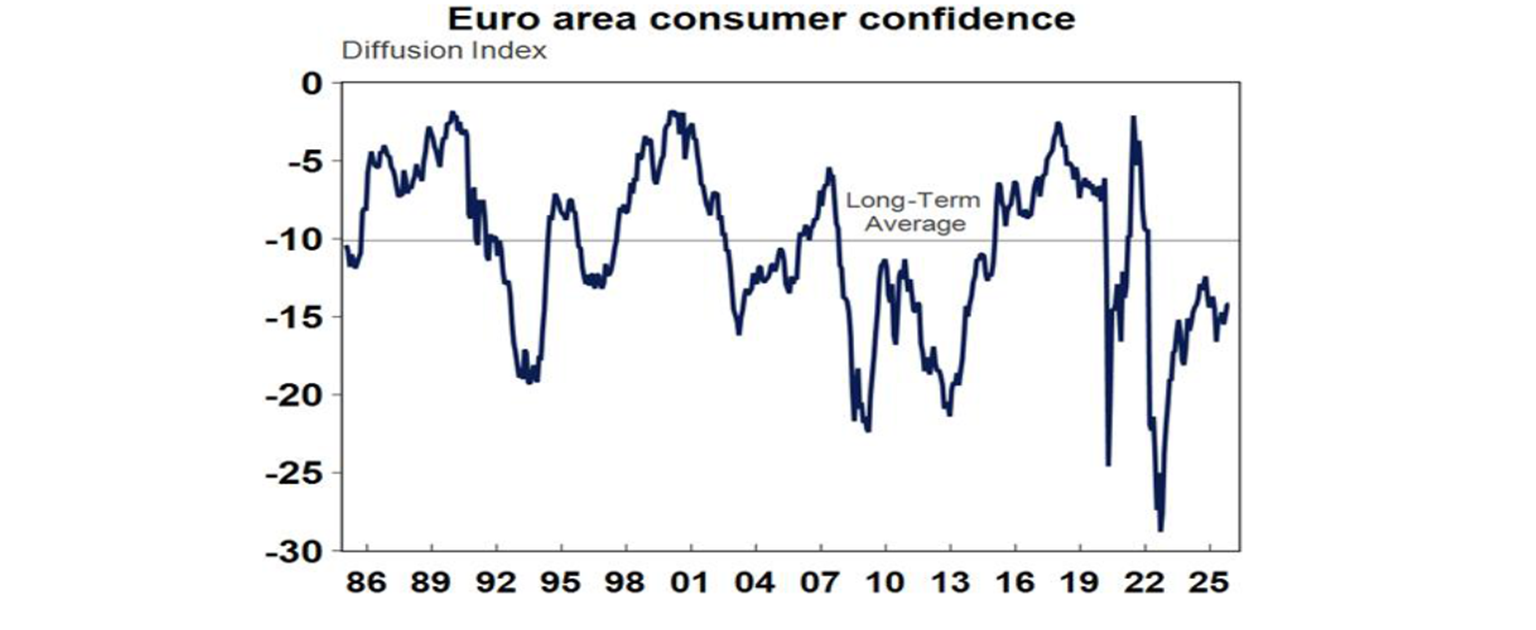
Eurozone economic confidence improved slightly but remains subdued as evident in consumer confidence.
The UK Government unveiled a budget with increased welfare spending and increased taxes (taking the tax take to a record 38% of GDP) which seemed to be supported by the bond market and left-wing Labour members. The problem is that the fiscal consolidation only occurs in a few years’ time closer to new elections which means it may never happen leaving public debt unsustainably high & the tax hikes will only further dent UK productivity and growth.
Japanese economic data showed unemployment still at 2.6%, stronger than expected retail sales & industrial production and core inflation in Tokyo unchanged at 1.6%yoy. The prior weeks fiscal stimulus and Yen weakness is boosting the probability that the Bank of Japan will hike rates again next month.
The Reserve Bank of New Zealand cuts its cash rate another 0.25% to 2.25%. Its projected cash rate profile and commentary was balanced, albeit with a minor easing bias, suggesting that it’s at or very near the bottom on rates.
Australian economic events and implications
Australian business investment surged a much stronger than expected 6.4%qoq in the September quarter. This will provide a boost to September quarter GDP growth.
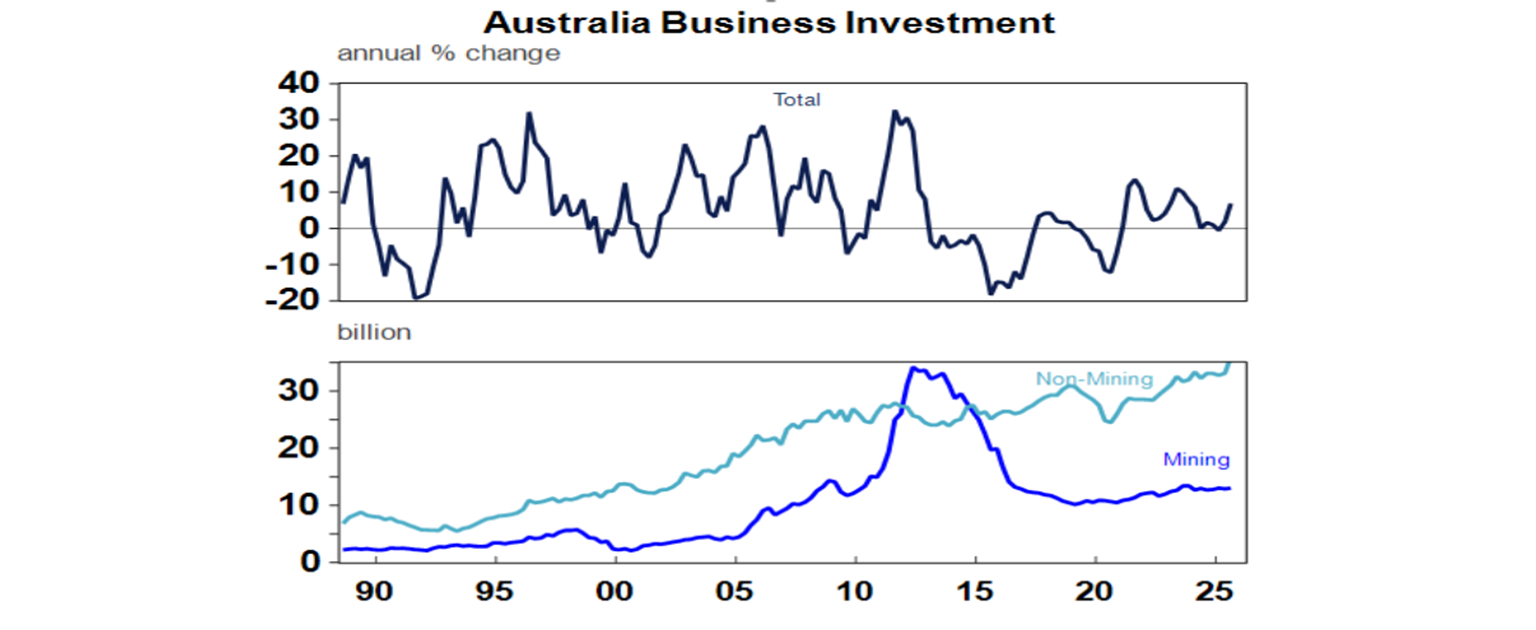
The surge was driven increased investment in data centres and new aircraft which drove non-mining investment up 10%qoq.
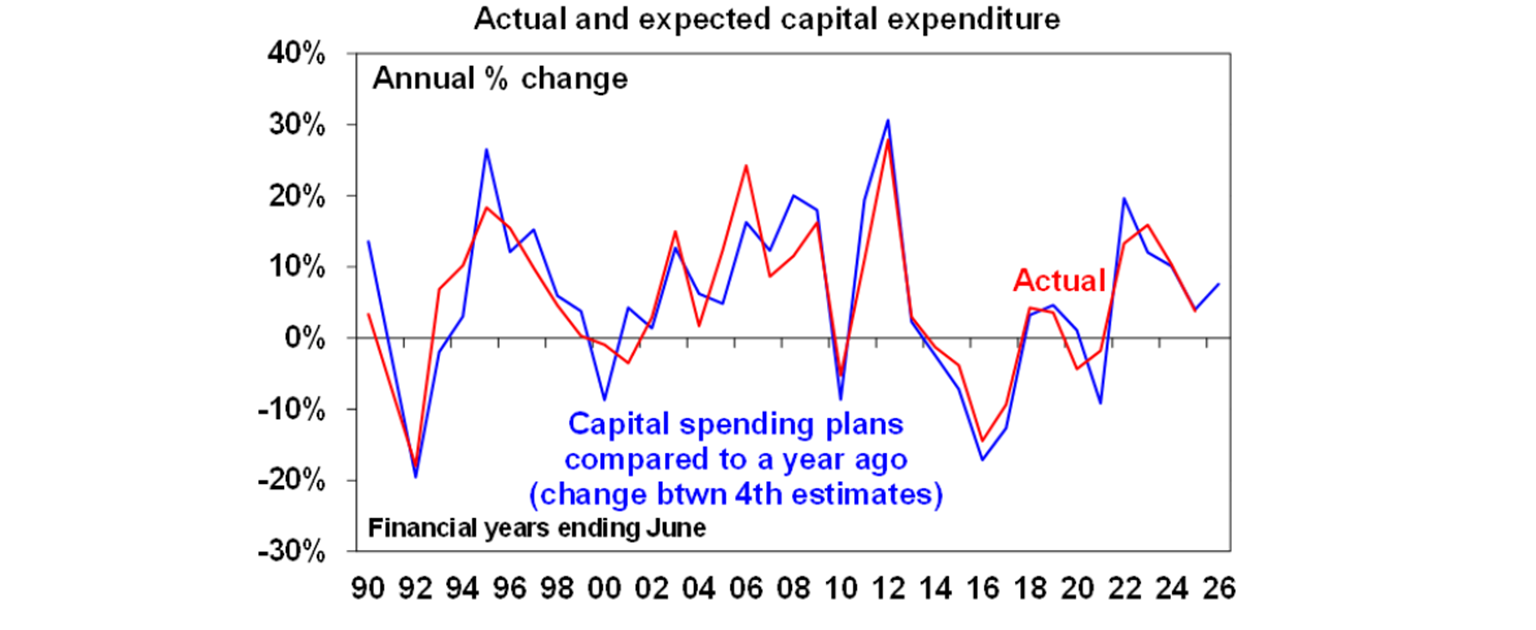
Capital spending plans for 2025-26 are now up 7.1%yoy on plans made a year ago for 2024-25, pointing to solid investment growth this financial year.
Stronger business investment after the malaise that set in last last decade is one positive sign for future productivity growth.
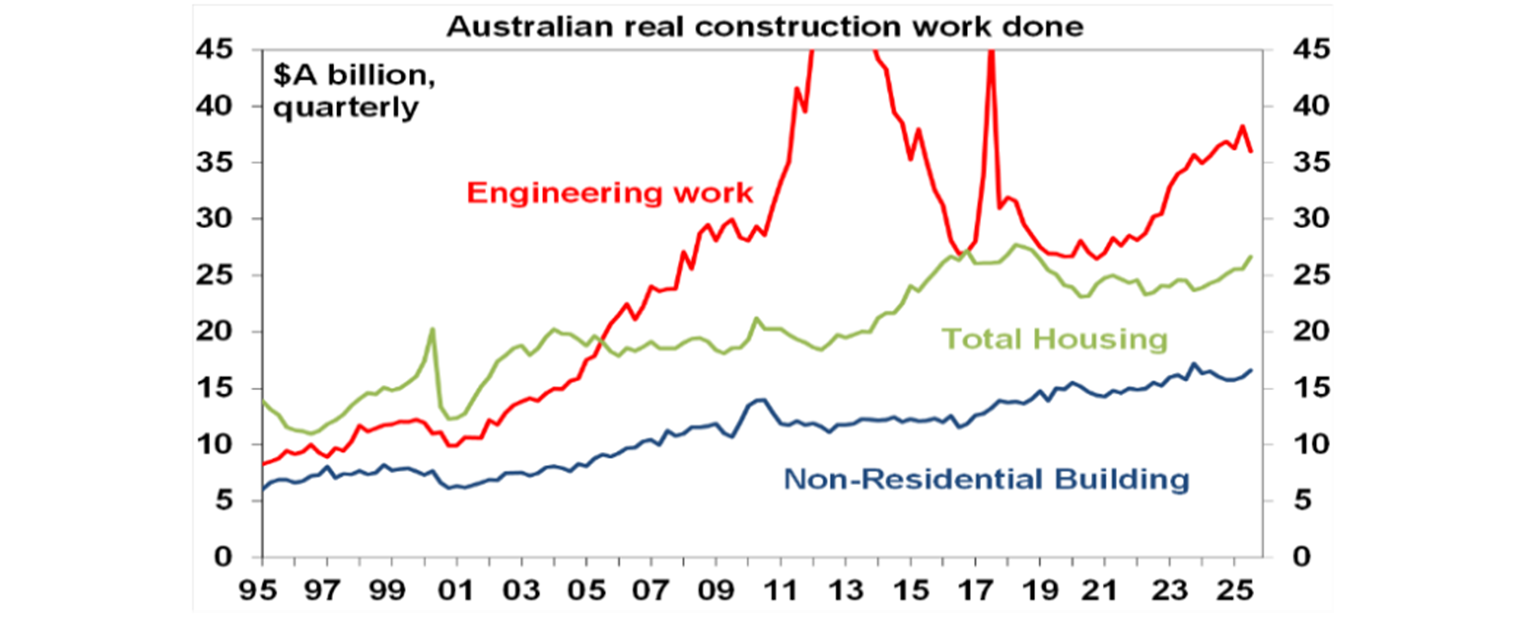
Construction activity fell in the September quarter though as engineering activity fell, but at least home building and non-residential construction rose by around 4%qoq each.
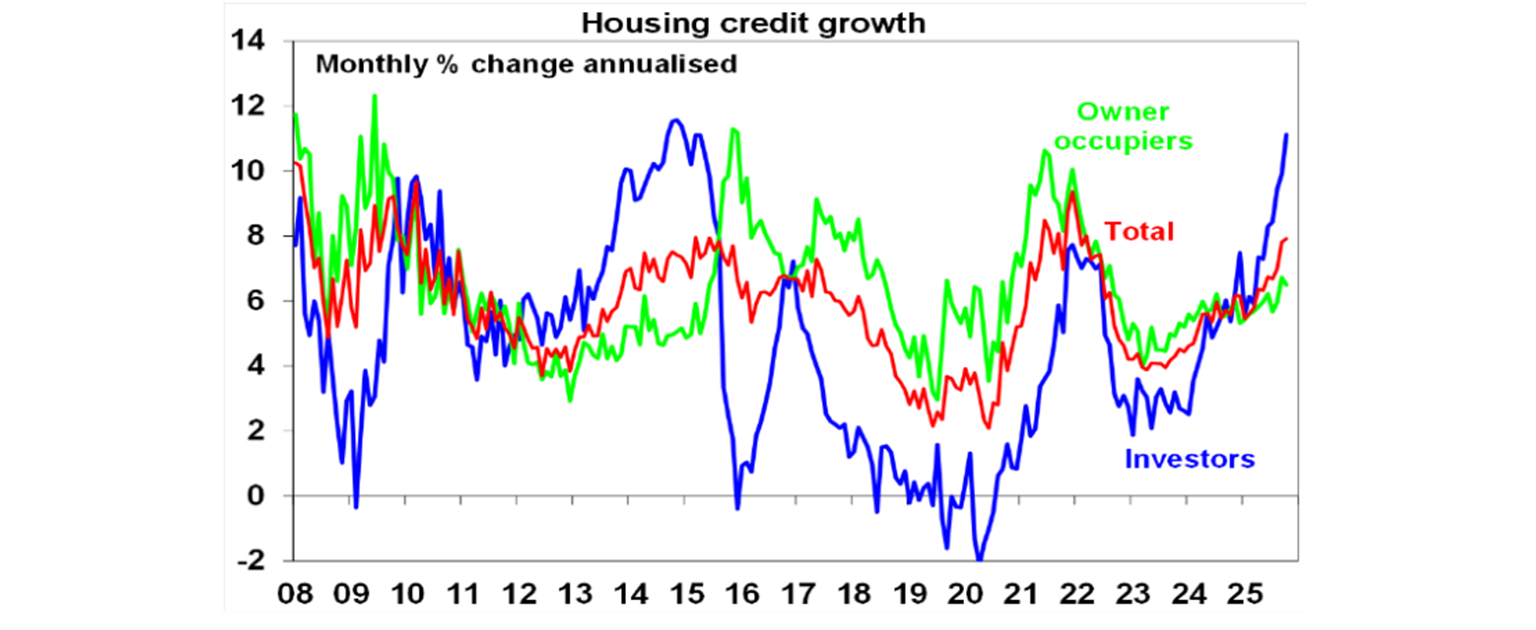
Private credit growth picked up again in October due to stronger business lending and housing investor lending is continuing to surge adding to the likelihood of more moves by APRA to slow it.
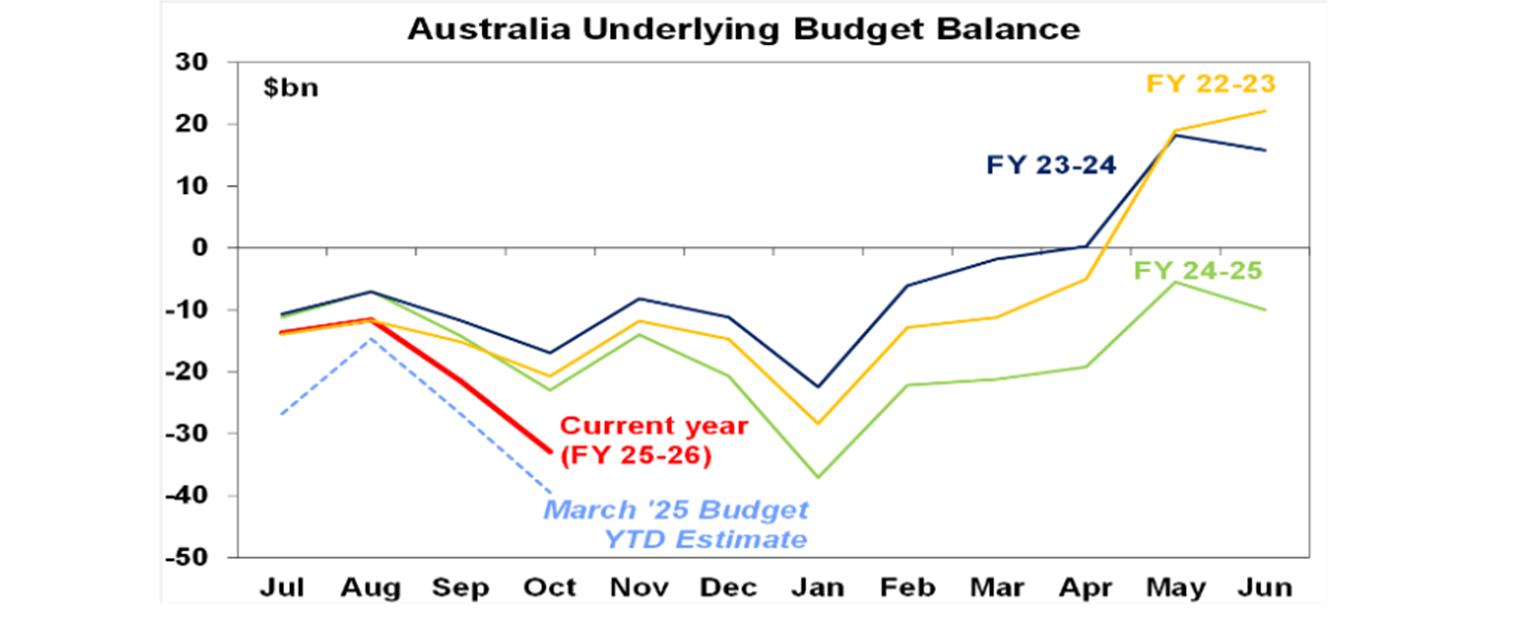
Finally, Federal budget data up to October shows the 2025-26 budget deficit running about $7bn better than expected which is good news. But its still showing a clear deterioration compared to previous years suggesting that while the budget deficit may end up smaller than the $42bn projected back in March its still going to be a sizeable deficit of maybe around $35bn or so. More broadly the renewed upwards pressure on inflation and the need to free up more resources for the more productive private sector in order to boost productivity growth highlights the need for the Government to bite the bullet and really slash growth in public spending (which is now at record levels as a share of the economy). The upcoming Mid-Year Economic and Fiscal Outlook is the ideal time to get this underway.
What to watch over the week ahead?
In the US, core private final consumption deflator inflation data for September (Friday) is likely to show a 0.2%mom rise with and annual increase of 2.8%. Personal spending data for September (also to be released Friday) is likely to be soft consistent with recent retail sales data. In other data the manufacturing conditions ISM for November (Monday) is likely to remain around 49 with the services conditions ISM (Wednesday) staying around 52.
Eurozone CPI data for November (Tuesday) is likely to show core inflation rising to 2.5%yoy. Unemployment for October (Tuesday) is likely to remain around 6.3%.
Chinese November conditions PMIs (Monday) are likely to stay around a relatively subdued reading of 50.
In Australia, September quarter GDP growth (Wednesday) is likely to show a further acceleration in growth to 0.7%qoq or 2.2%yoy after 1.8%yoy in the June quarter reflecting moderate growth in consumer spending, but strong growth in business investment, home building and public spending but a small detraction from trade. Cotality data for home prices in November (Monday) will likely show a further rise of 1%mom but with some slowing in Sydney and Melbourne and a further acceleration in Perth, Adelaide and Brisbane. In other data expect a 7% fall in October building approvals (Tuesday), the trade surplus for October to remain around $4bn and October household spending to show a 0.4%mom rise (both Thursday).
Outlook for investment markets
Share markets remain at risk of a further correction given stretched valuations, risks around US tariffs and the softening US jobs market. But with Trump pivoting towards more consumer friendly policies and the Fed still likely to cut rates further, shares are likely to provide reasonable gains on a 6-12 month horizon. A return to profit growth should also support further gains in the Australian share markets even though the RBA may have finished cutting rates.
Bonds are likely to provide returns around running yield or a bit more as central banks continue to cut rates.
Unlisted commercial property returns are likely to improve as the work from home damage to office prices is fading.
Australian home prices are in an upswing on the back of lower interest rates and more support for first home buyers. But it’s likely to be constrained next year by poor affordability, less rate cuts with the risk of rate hike and APRA’s move to ramp up macro prudential controls. We now expect national home price growth of 5% in 2026, down from our forecast of 8-10% a few months ago.
Cash and bank deposits are expected to provide returns of around 3.5%.
The $A is likely to be buffeted in the near term by the impact of global growth uncertainty but may break higher with the Fed looking like it will cut more than the RBA. Undervaluation should support it on a medium-term view with fair value around $US0.73.
You may also like
-

Oliver's insights - Why have Australian living standards “fallen” and how do we fix it? For the last few years there has been much talk of a “cost-of-living” crisis in Australia and of “falling living standards”. This has flared up again lately with the pickup in inflation resulting in a renewed fall in real wages. -

Weekly market update - 10-07-2026 Ceasefire over but markets are also over the war, Why oil prices can't go too low or too high, Is AI adding to inflation risk or taking it away, and Australia’s wage problem. -

How to protect yourself from phishing and impersonation scams Phishing scams can look like everyday messages – emails, texts or calls. Learn the signs and simple steps to protect your money and personal information.
Important information
Any advice and information is provided by AWM Services Pty Ltd ABN 15 139 353 496, AFSL No. 366121 (AWM Services) and is general in nature. It hasn’t taken your financial or personal circumstances into account. Taxation issues are complex. You should seek professional advice before deciding to act on any information in this article.
It’s important to consider your particular circumstances and read the relevant Product Disclosure Statement, Target Market Determination or Terms and Conditions, available from AMP at amp.com.au, or by calling 131 267, before deciding what’s right for you. The super coaching session is a super health check and is provided by AWM Services and is general advice only. It does not consider your personal circumstances.
You can read our Financial Services Guide online for information about our services, including the fees and other benefits that AMP companies and their representatives may receive in relation to products and services provided to you. You can also ask us for a hardcopy. All information on this website is subject to change without notice. AWM Services is part of the AMP group.