


What happens when the public sector spending party ends?
From mid-2026, public spending growth will slow, making a smaller contribution to GDP and employment growth, keeping the unemployment rate elevated in 2026 which should help to reduce inflation.
8 min read

Key points
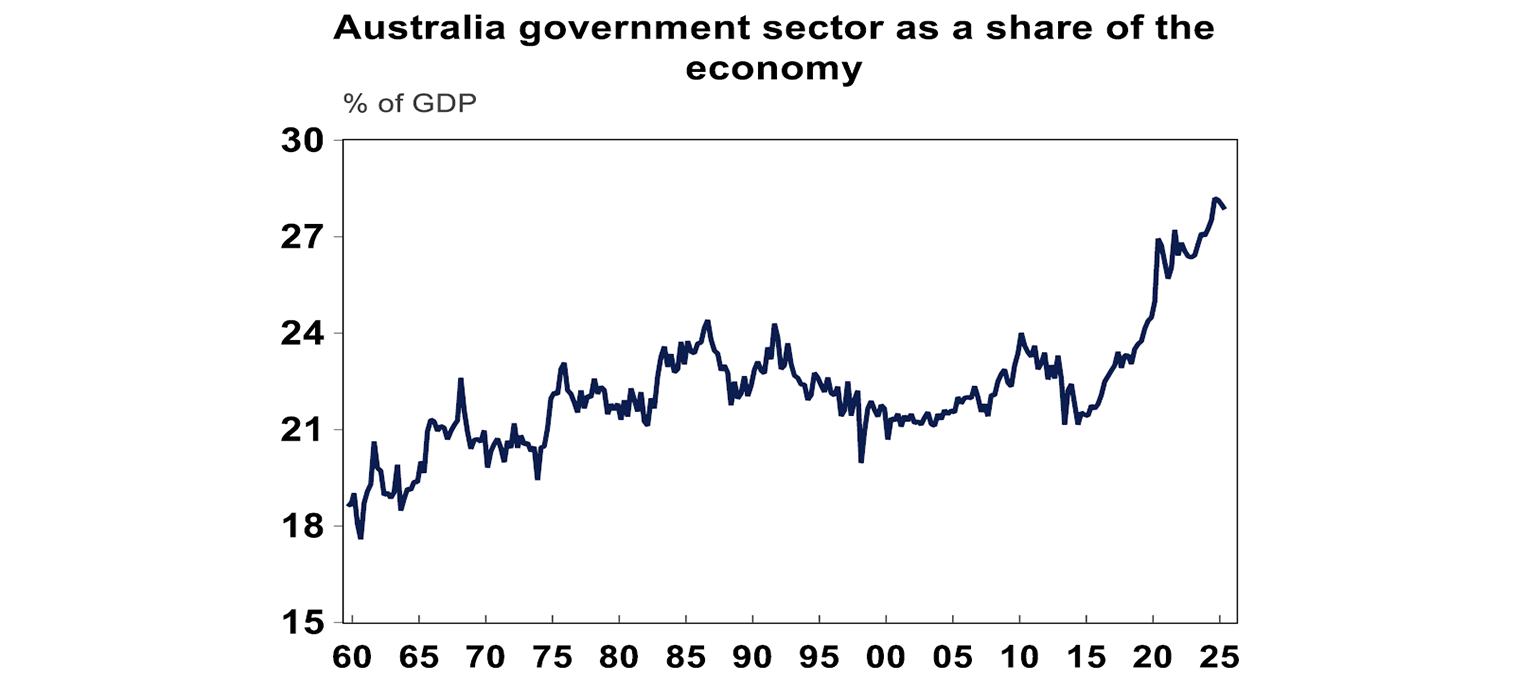
Public spending has reached a record share of the economy.
This led to a surge in non-market jobs growth and some crowding out in private construction. Administered inflation, which is heavily influenced by government and regulators has run well above headline inflation.
From mid-2026, public spending growth will slow, making a smaller contribution to GDP and employment growth, keeping the unemployment rate elevated in 2026 which should help to reduce inflation.
Introduction
Public sector spending in Australia surged during the pandemic as policy makers supported the economy through a period of uncertainty. But with the pandemic now well and truly over, public spending should have slowed. Yet, this slowdown hasn’t materialised. We look at the impact ofthe public sector on the Australian economy in this edition of Econosights.
Public demand in the economy
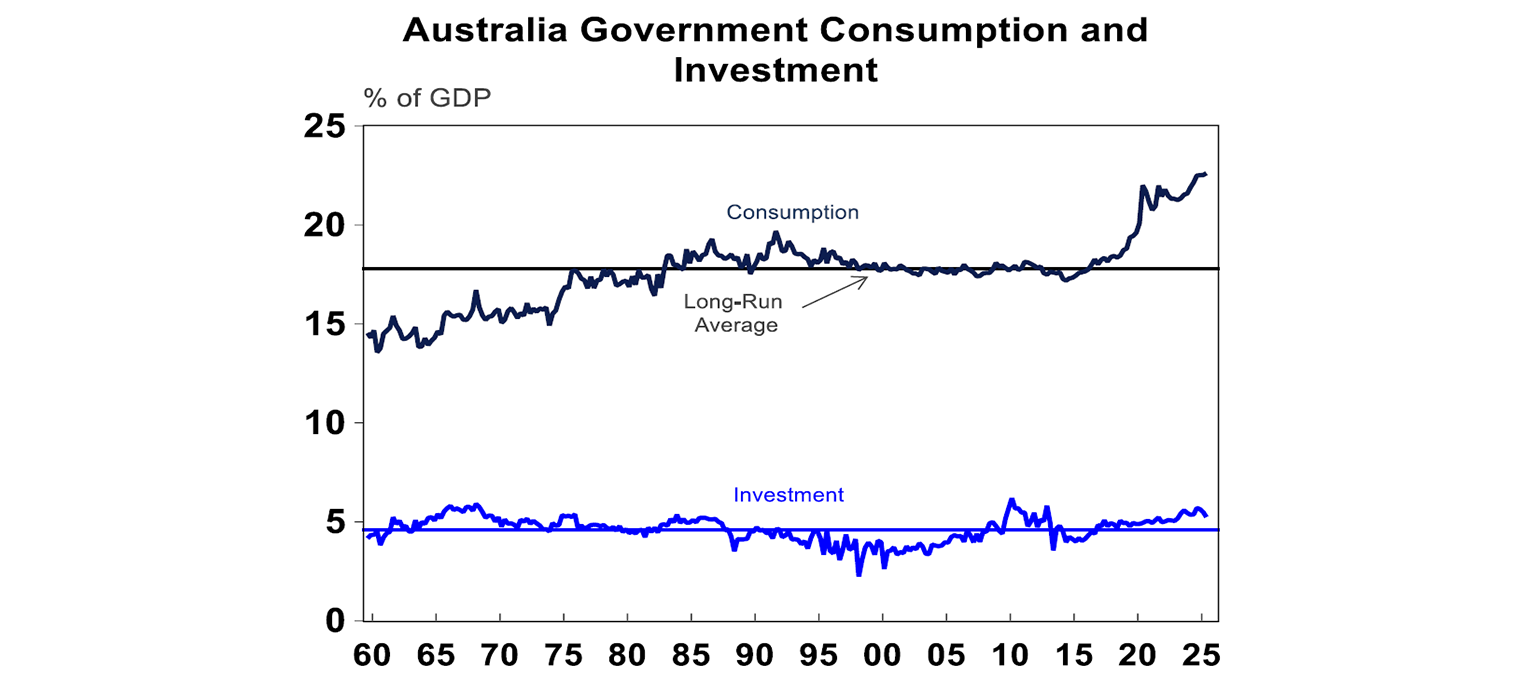
From a GDP perspective, government activity is measured through two components: public consumption and public investment. Public consumption captures all current government expenditure across its portfolios, with the largest items being pensions, unemployment benefits,welfare payments, and public sector wages. Public investment, by contrast, reflects the value of net new public assets and is much smaller because assets can be sold to the private sector. The rise in government spending over the past decade has been driven primarily by consumption, which is currently about 5 percentage points above its long-run average as a share of GDP. The COVID-19 pandemic triggered a sharp step-up in spending, while public investment has remained relatively stable at around 5% of GDP (see chart below), although it has gone up since 2015.
Total public spending is worth a record high of 28% of GDP (see the chart below).
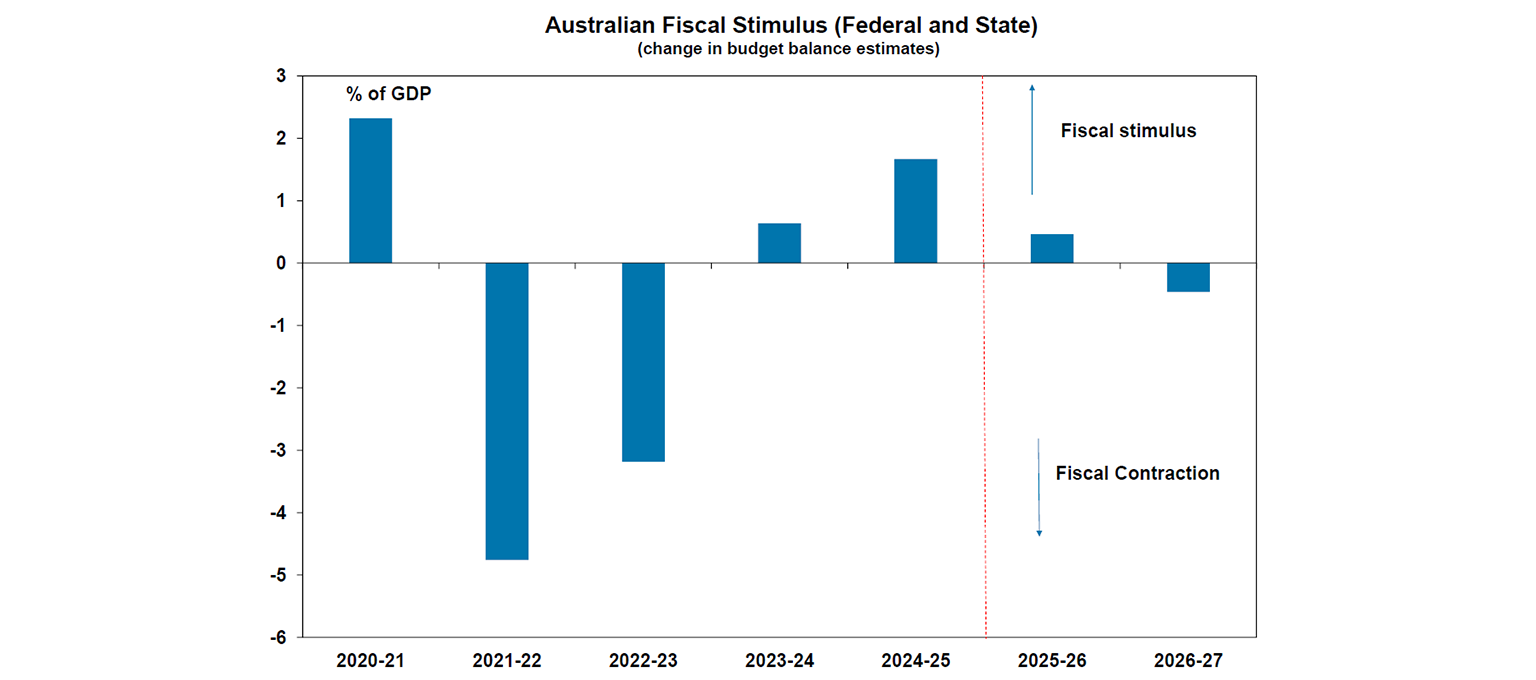
To gauge the public sector’s contribution to economic growth, we focus on the year-on-year change in government spending. This serves as an indicator of fiscal stance—whether policy is providing stimulus (adding to growth) or contraction (withdrawing more than it adds). Over the past two financial years, the fiscal impulse has been positive, and based on state and federal budgets, this is expected to continue through 2025/26 before easing in 2026/27 (see chart below). In other words, government spending will still be supporting economic growth in the current financial year.
The public sector and construction
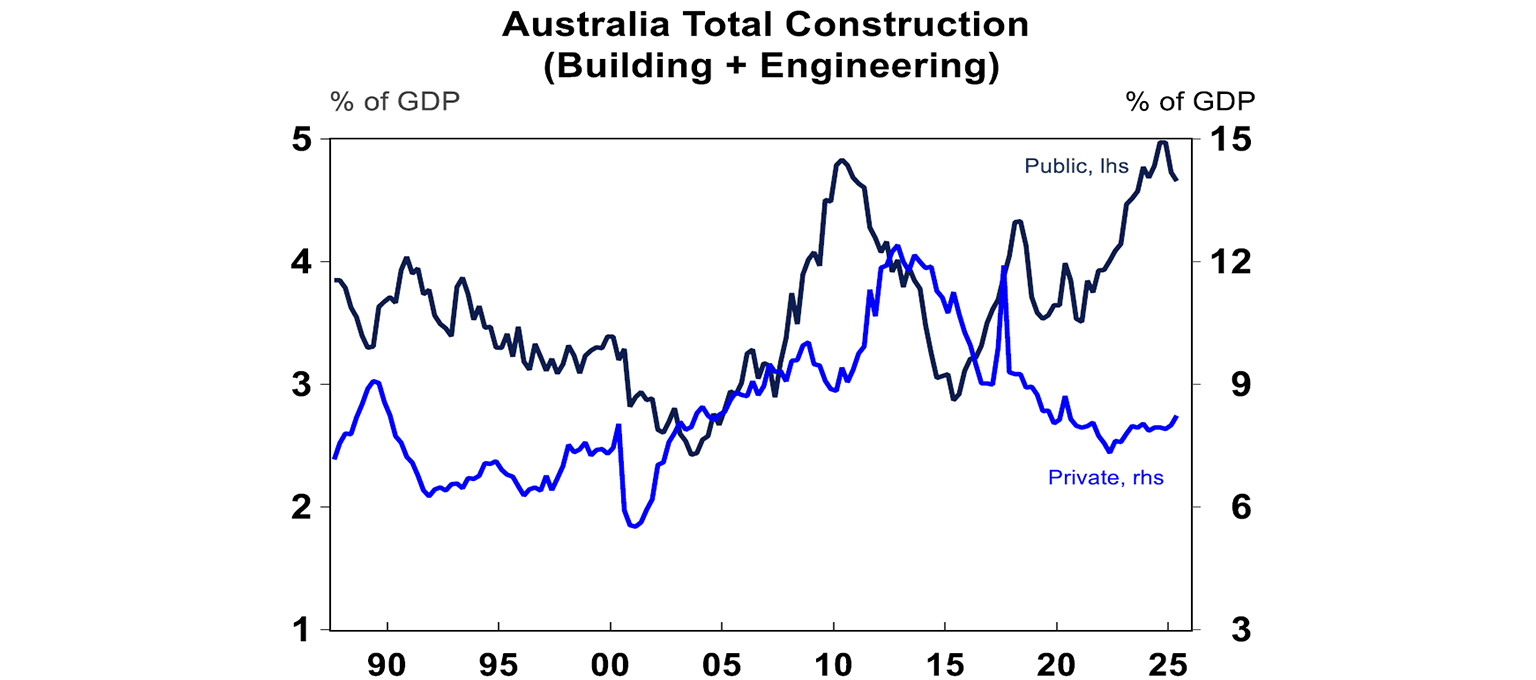
Public sector infrastructure spending has surged in recent years, driven by large-scale transport projects such as Sydney Metro and Sydney Light Rail, major road upgrades, and increased investment in social housing. As a result, public building and engineering construction activity has been trending higher since 2015, recently reaching a record level of around 5% of GDP. While private sector construction remains larger, it has been on a downward trend and has essentially flatlined since 2020 at about 8% of GDP. This shift reflects a classic case of “crowding out,” where growing public construction limits private activity due to resource constraints—particularly in materials and labour. Looking ahead, public infrastructure projects are expected to slow, creating space for private investment, especially in housing.
The public sector in the labour market
Around 18% of employees- about 2.6 million people - are directly employed by the public sector. However, this figure understates the broader influence of government on the economy. Many private industries are closely tied to public funding, such as healthcare and education, or depend on public projects, like infrastructure and professional services. Over the past year, the non-market sector (healthcare and social assistance, education, and public administration), which serves as a strong proxy for public sector employment, accounted for an extra ordinary 93% of total jobs growth. Non-market employment rose by 4.4% over the year, while market sector jobs barely grew, up just 0.2% (see chart below). Clearly, the non-market sector has been the main driver of labour market strength over the past two years.
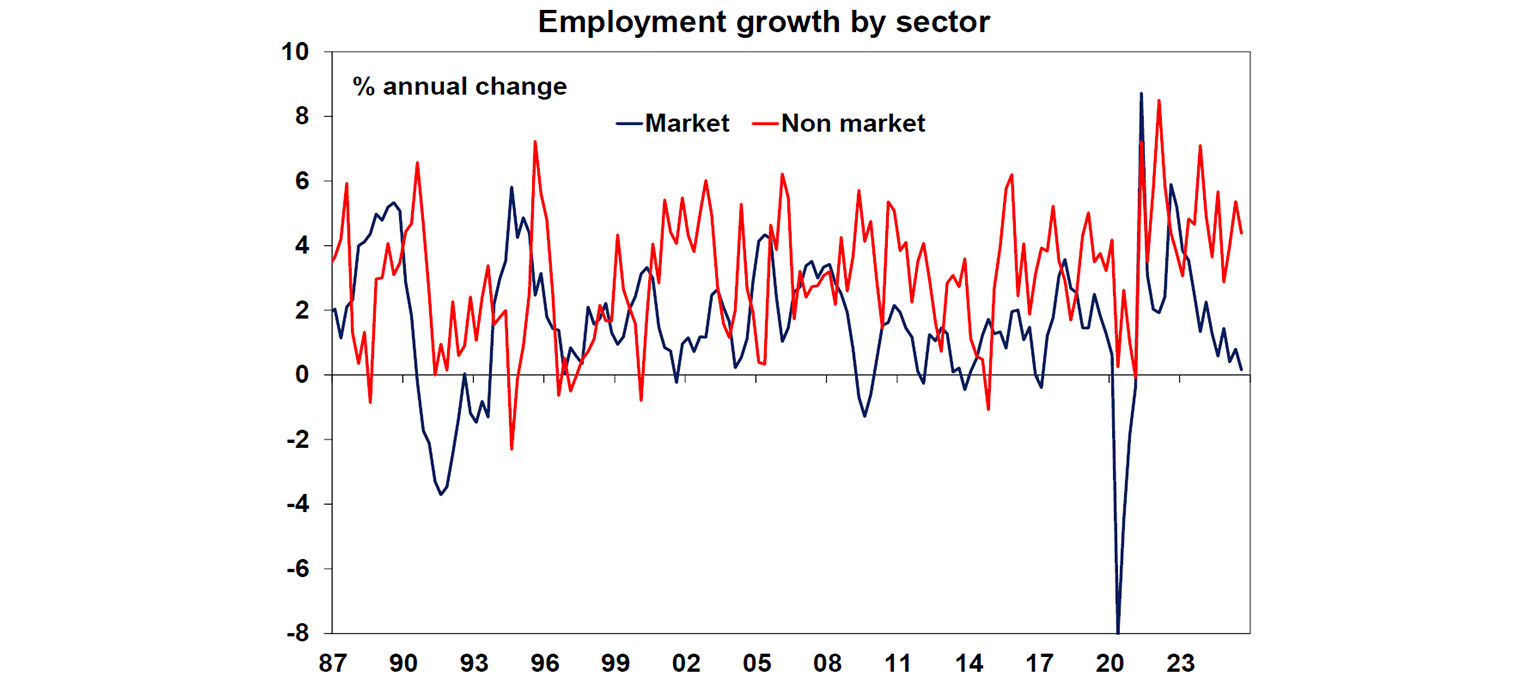
The same degree of growth in non-market jobs is unlikely from here, as the pace of stimulus from the public sector moderates (based on government budget projections), especially after the boom in healthcare spending and as growth in the NDIS is (hopefully) reigned in.
The public sector and inflation
The direct impact of the public sector on inflation is hard to measure. The best proxy for government-influenced prices would be to look at administered prices. These are items heavily influenced by the government or regulator, rather than through market forces (supply and demand) and often they are applied to essential services and include property rates and charges, water and sewerage, electricity and gas, childcare, education, pharmaceutical products, therapeutic appliances, medical and hospital services, dental services, other services for motor vehicles, urban transport fares and postal services. Indexed items are also under government regulation and are usually lifted with prior inflation rates and include alcohol and tobacco. Over the year to September, administered/indexed prices rose by 6.3% (nearly double the headline rate of 3.2%). Market prices on the other hand went up by just 2.1%, with higher inflation formarket goods (2.9%) versus market services (+1.5%) – see the chart below.
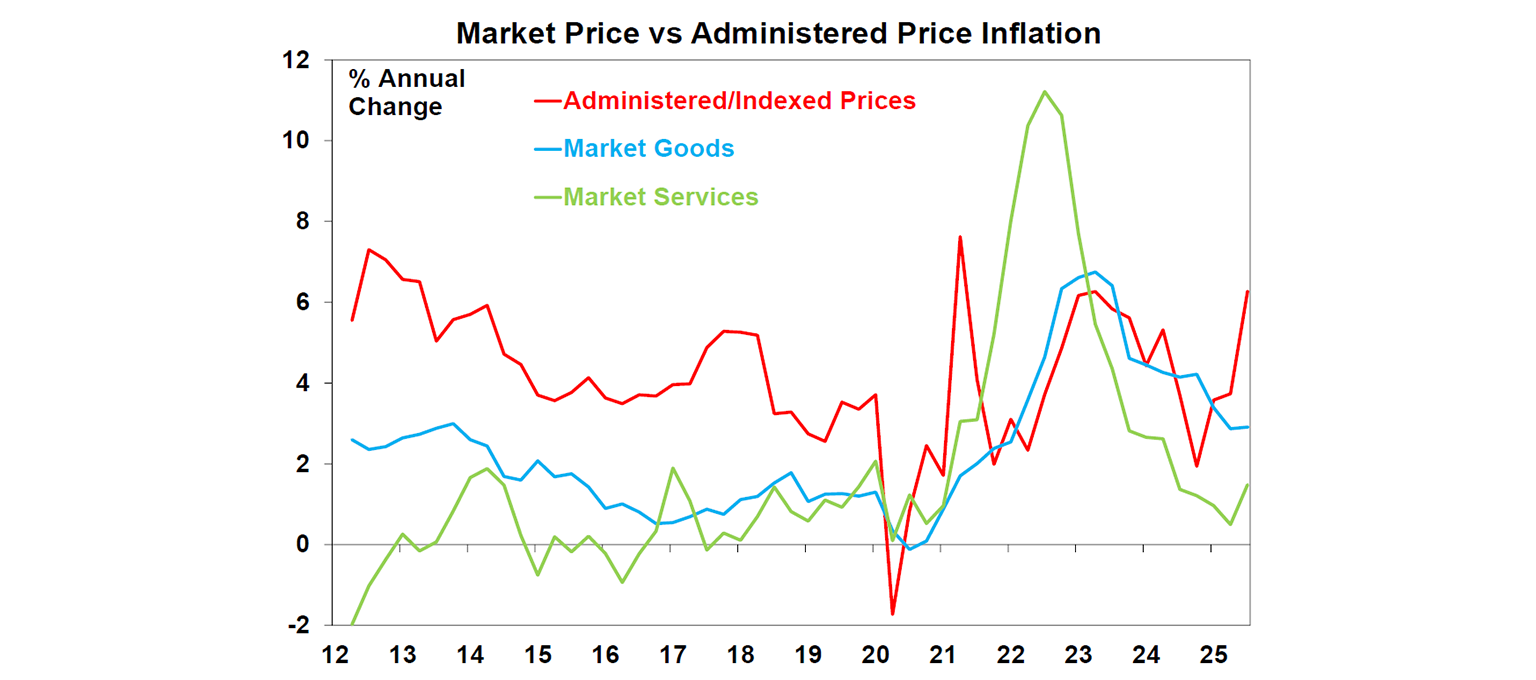
Administered price increases in recent years reflect a higher cost base across sectors for both materials, labour and structural changes in the economy (like aging population which lifts medical costs) in the higher inflationary environment post-pandemic. Never theless, the governmenthas influence over price settings in these industries, just like they had influence in electricity rebates for households. So it appears that directly, the government has been adding to inflation in recent years, as you would expect in an environment of public spending lifting to a record high.
The other factor to consider is how public sector wages have added to wages inflation (which translate into services inflation). There have be ennumerous high-profile public sector wage increases over recent years in the aged care, health, child care and public transport industries as well as state government planned wage increases. The September quarter wages data showed that public sector wages growth was running at 3.8% over the year, above the private sector at 3.3% - see the chart below.
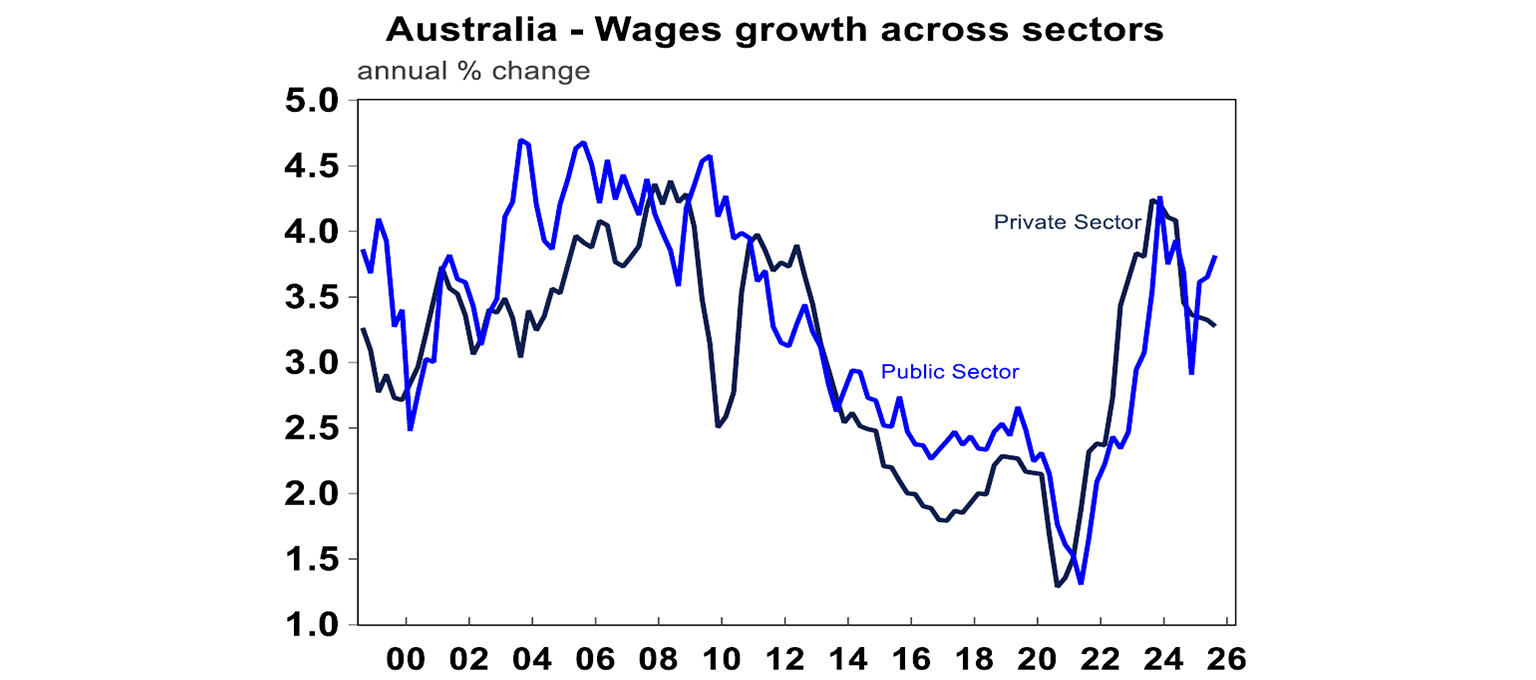
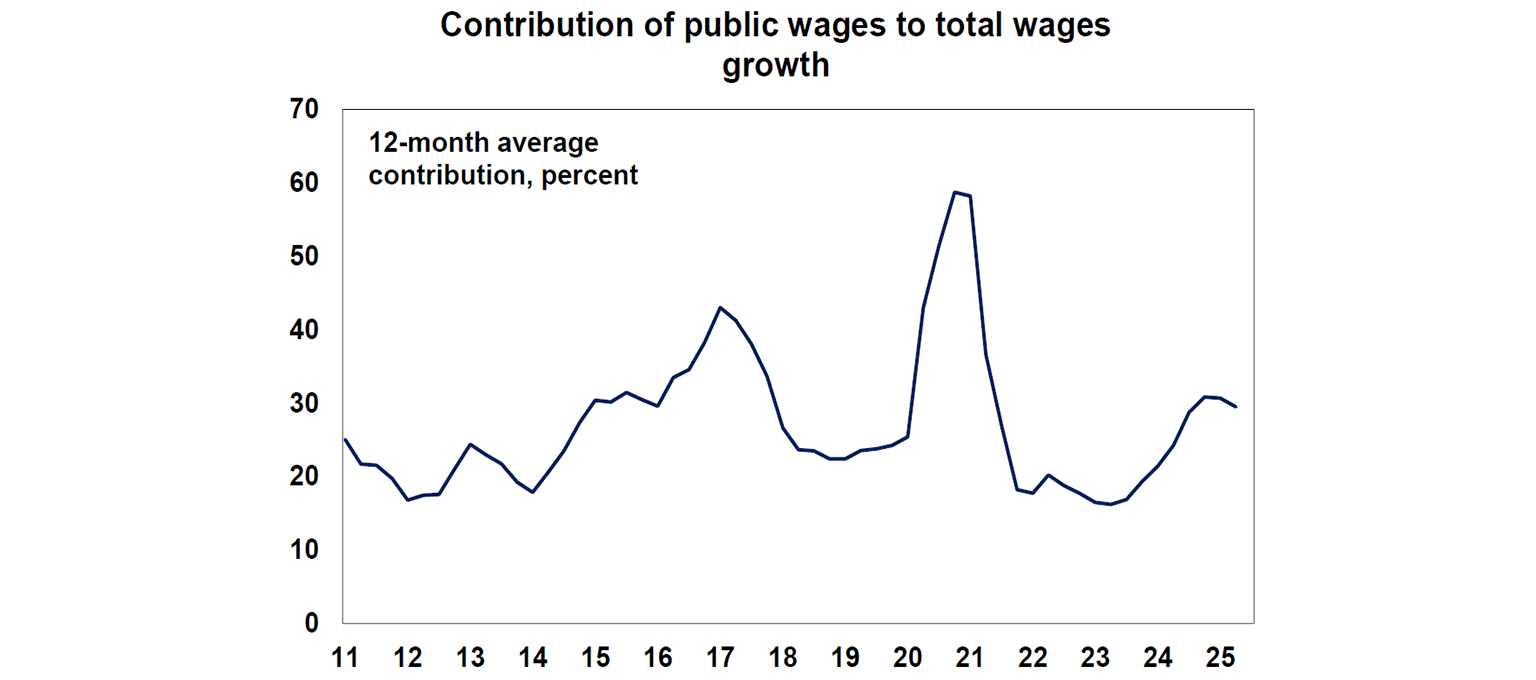
How does this translate into the contribution to wages growth? Despite higher wages growth, the public sector is a much smaller proportion of total employment (at 18%) which means that the contribution to total wages growth will usually be lower relative to the private sector. In the last 12 months, public wages growth has contributed around 30% to total wages growth (see the chart below), which is around the long-run average, although it was much higher during the pandemic. Stronger public wages growth is one reason behind higher total wage gains in recent years, but not the main factor. Broad-based wage growth has been under pinned by a tight labour market, which has given employees and job switchers greater bargaining power to secure pay increases.
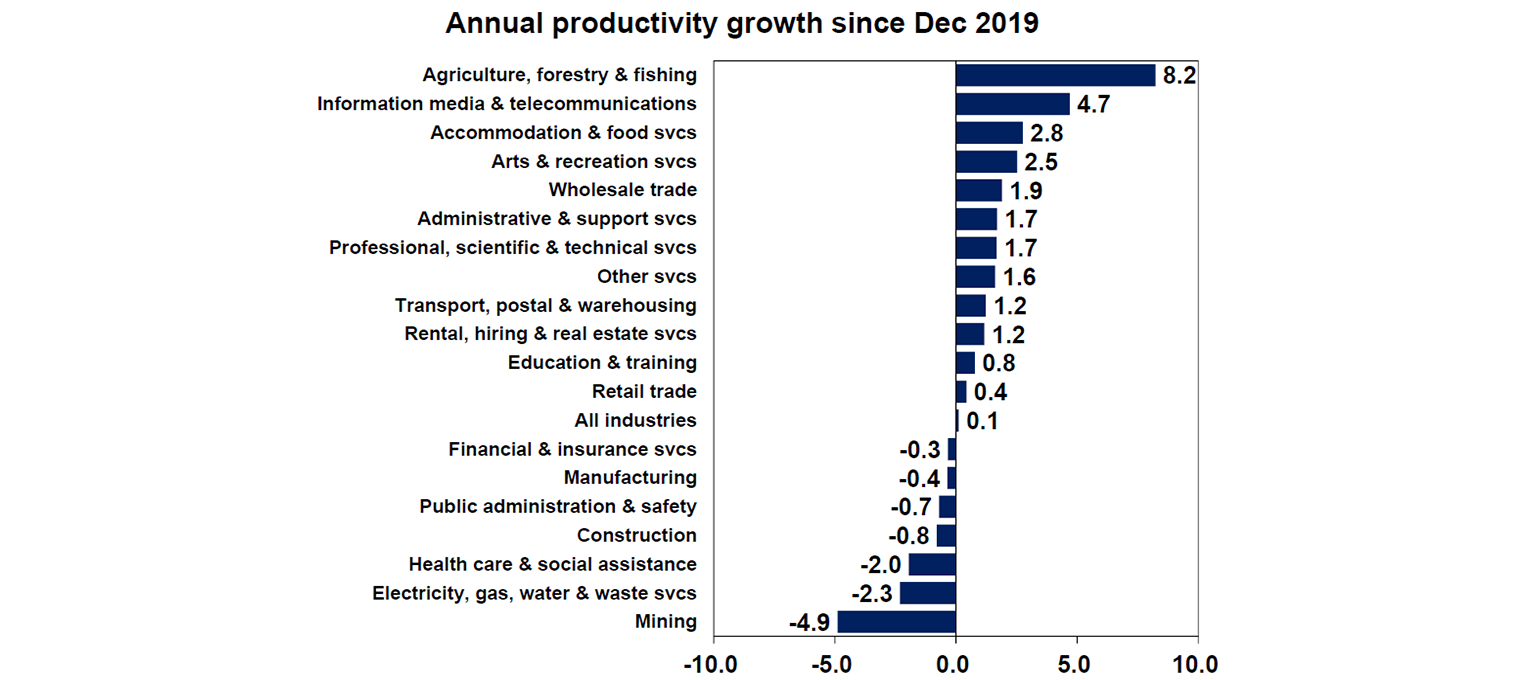
The public sector and productivity
The perception about an unproductive public sector has led to an idea that Australia’s poor productivity performance recently is tied to the growing public sector. Australia’s productivity growth was basically flat over the year to June and has barely budged since 2016. But this masks wide divergence across sectors – see the chart below. Since 2019, mining sector productivity has declined by an annual average of 5% and is the worst performer across sectors, although it tends to be quite cyclical. Productivity growth in the non-market sector has been negative while other market services has shown low but positive productivity growth and agriculture has been very strong, averaging 8% per annum since 2019.
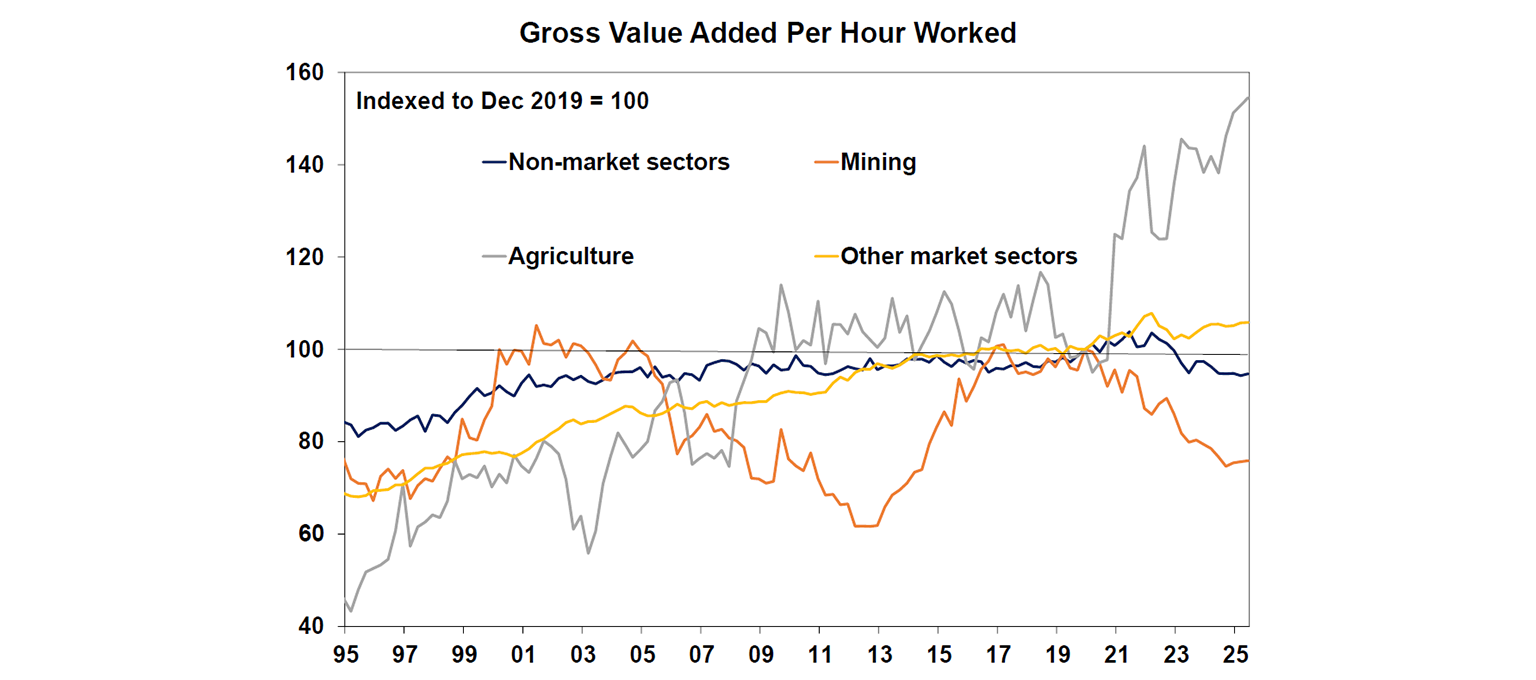
The current measurement of productivity (output per hour) also penalises labour-intensive areas, and in particular non-market sectors like healthcare and education because of the nature of measuring output. It is hard to increase “output” in these sectors. The Productivity Commission estimate that after accounting for quality improvements (rather than just output), healthcare productivity grew by 3% per annum between 2011-12 and 2017-18.
Implications for investors
Based on latest Federal and State budget estimates, the pace of growth in public spending is likely to slow from here. This is otherwise known as a fiscal contraction (taking more out of the economy than adding back in). This is evident in the government cutting back on consultants in recent budgets and announcing lower spending across agencies. As a result, public spending will make a smaller contribution to GDP growth from 2026,, hopefully at time that the private sector is improving from stronger consumer spending, residential construction and business investment. Softer public spending growth should help to ease some of the bottle neck pressures in construction which should allow residential construction to increase and help the labour market to be in better balance (we expect the unemployment rate to remain around 4.5-4.6% over the next 12 months). This should also alleviate inflation pressures both directly in administeredprices and indirectly through lower overall demand in the economy. The riskis that the “transition” of growth from the public to the private sector isslower than expected, which could keep economic growth low in 2026.
Diana Mousina
Deputy Chief Economist, AMP
You may also like
-

Weekly market update - 17-07-2026 Following the renewed escalation in the US/Iran conflict, the Strait of Hormuz is effectively closed again with Iran attacking ships and the US attacking Iran and blockading its ports. Both are now back to attacking energy infrastructure which is a signficant & concerning escalation. -

Oliver's insights - Why have Australian living standards “fallen” and how do we fix it? For the last few years there has been much talk of a “cost-of-living” crisis in Australia and of “falling living standards”. This has flared up again lately with the pickup in inflation resulting in a renewed fall in real wages. -

Weekly market update - 10-07-2026 Ceasefire over but markets are also over the war, Why oil prices can't go too low or too high, Is AI adding to inflation risk or taking it away, and Australia’s wage problem.
Important information
Any advice and information is provided by AWM Services Pty Ltd ABN 15 139 353 496, AFSL No. 366121 (AWM Services) and is general in nature. It hasn’t taken your financial or personal circumstances into account. Taxation issues are complex. You should seek professional advice before deciding to act on any information in this article.
It’s important to consider your particular circumstances and read the relevant Product Disclosure Statement, Target Market Determination or Terms and Conditions, available from AMP at amp.com.au, or by calling 131 267, before deciding what’s right for you. The super coaching session is a super health check and is provided by AWM Services and is general advice only. It does not consider your personal circumstances.
You can read our Financial Services Guide online for information about our services, including the fees and other benefits that AMP companies and their representatives may receive in relation to products and services provided to you. You can also ask us for a hardcopy. All information on this website is subject to change without notice. AWM Services is part of the AMP group.