


Weekly market update
Investment markets and key developments
Despite a bounce on Friday US shares fell 0.3% over the last week as expectations for Fed rate cuts were wound back, but Eurozone shares rose 0.5%, Japanese shares rose 0.7% and Chinese shares rose 1.1%. Australian shares also managed a small rise of 0.2% which was their first rise in three weeks, with a rebound in resources shares, but with most sectors down for the week including healthcare stocks as CSL was dragged down by uncertainty around the impact of Trump’s pharmaceutical tariffs.
12 min read

Despite a bounce on Friday US shares fell 0.3% over the last week as expectations for Fed rate cuts were wound back, but Eurozone shares rose 0.5%, Japanese shares rose 0.7% and Chinese shares rose 1.1%. Australian shares also managed a small rise of 0.2% which was their first rise in three weeks, with a rebound in resources shares, but with most sectors down for the week including healthcare stocks as CSL was dragged down by uncertainty around the impact of Trump’s pharmaceutical tariffs. 10-year bond yields rose including in Australia where expectations for RBA rate cuts were reduced after stronger than expected inflation data. Gold prices made another record high, metal prices rose and so did oil prices, but iron ore prices fell slightly. The $A fell as the $US rose on the back of reduced expectations for Fed rate cuts.
While shares are not far from record highs, correction risks remain high. Shares have generally come through the seasonally weak August/September period pretty well. Australian shares are down around 2% so far in September but that followed a rise to record highs in August and US shares are having another solid month despite a fall in the last week and appear to be taking comfort from expectations that even if the US labour market keeps softening it will be met by Fed rate cuts. Our 6-12 month view remains positive for shares as Trump continues to pivot towards more market friendly policies ahead of the mid terms next year, the Fed cuts rates further and other central banks including the RBA continue to cut, albeit to varying degrees. However, the risk of a correction remains high reflecting a combination of: stretched valuations; concerns about public debt sustainability in the US, France, UK and Japan; uncertainty around US tariffs with Trump just announcing another round and more still coming; geopolitical risks including around the possibility of escalating tensions between Russia and European countries; the risk of US secondary tariffs on countries importing Russian oil; and a high risk of a partial US government shutdown on 1st October if a budget funding bill is not passed.
After a period of calm on the tariff front Trump has announced another round of sectoral tariffs to start 1st October, with 25% on heavy trucks, 50% on kitchen cabinets and bathroom vanities and 30% on upholstered furniture and the long-awaited pharmaceutical tariff at 100% “on any branded or patented pharmaceutical product unless a company IS BUILDING their Pharmaceutical Manufacturing Plant in America.” Gauging the impact of the pharmaceutical tariffs is a bit hard as many big drug companies already have US facilities and have announced expansions. But the further tariffs (with more still to come on things like semi-conductors) highlight that the tariff threat has not gone away. Our rough estimate is that the latest announcements will take the average US tariff rate before any substitution to around 21%, well down from post Liberation Day highs but well up from 2.5% or so at the start of the year.
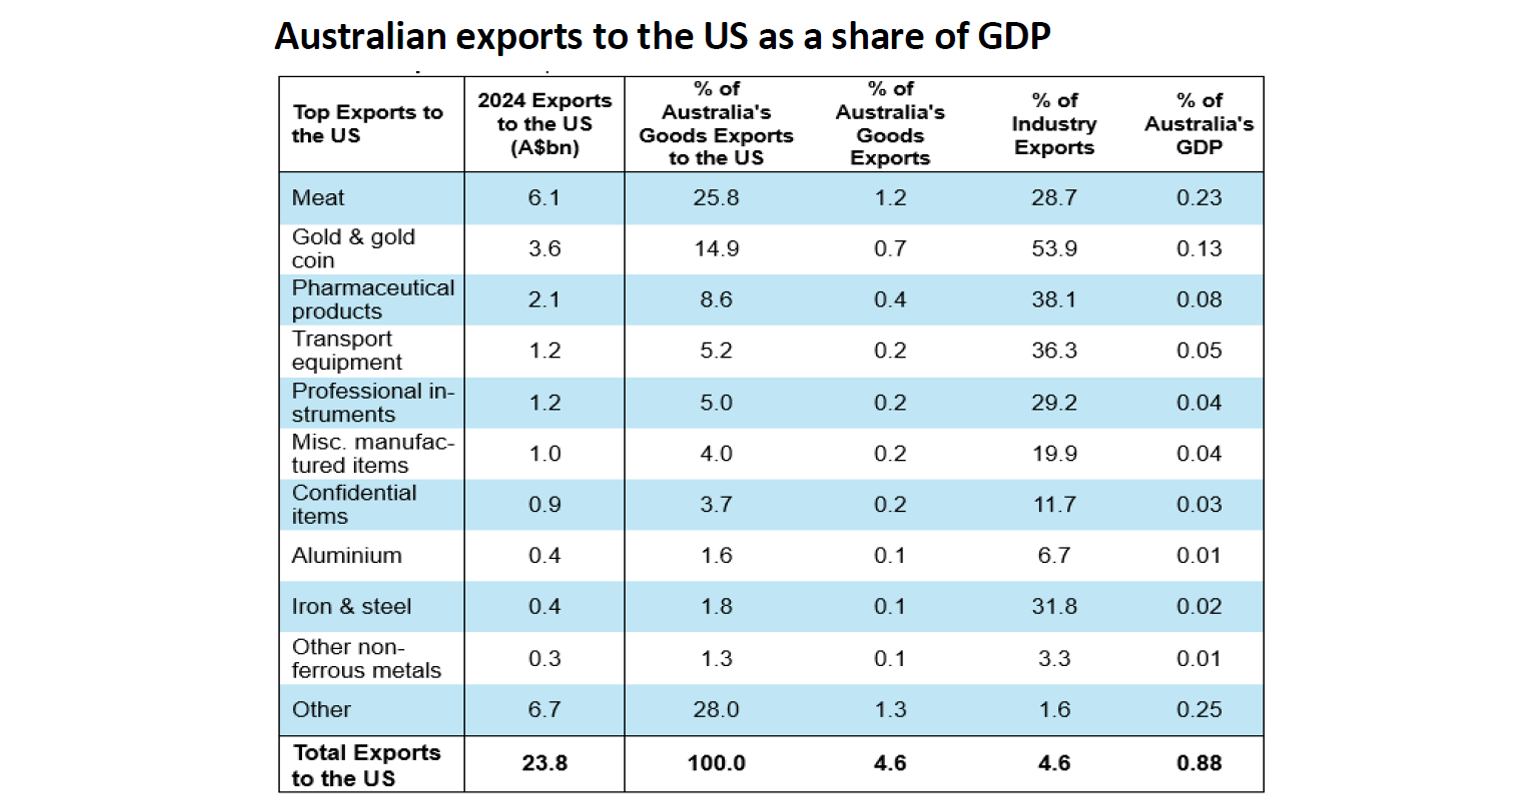
The impact of the pharmaceutical tariffs on Australia is unclear but is likely to be small. Last year Australia exported $2.1bn of pharmaceuticals to the US. Only 6% of this was medicines which is less than 0.01% of GDP. The bulk of it was blood products from CSL and its unclear how much of that would be branded or patented and CSL has indicated it does not expect to be impacted given its heavy US manufacturing presence. But even if all of our pharmaceutical exports are impacted the effect on the economy would be minor as last year they were less than 0.1% of GDP and much would be diverted to other markets.
A US government shutdown will create a lot of drama but is unlikely to have much economic or market impact. To pass a funding bill by 1st October the Republican’s need 6 Democrat Senators but the Democrats want expiring health care subsidies to be extended in return. Its possible they agree a stop gap funding measure until November because that will be closer to when the subsidies expire and then allow a shutdown in order to achieve maximum political advantage. Either way the impact of a shutdown is likely to be minor: since 1976 there has been 20 US government shutdowns with an average duration of 8 days; the last one was in 2018-19 and lasted 34 days; the impact on GDP has been minor as any disruption is made up for immediately after the shutdown ends; similarly the impact on share markets has tended to be minor although it can be associated with volatility. That said it could delay key jobs and inflation data releases. And it may be more of a risk now with high price to earnings valuations for shares.
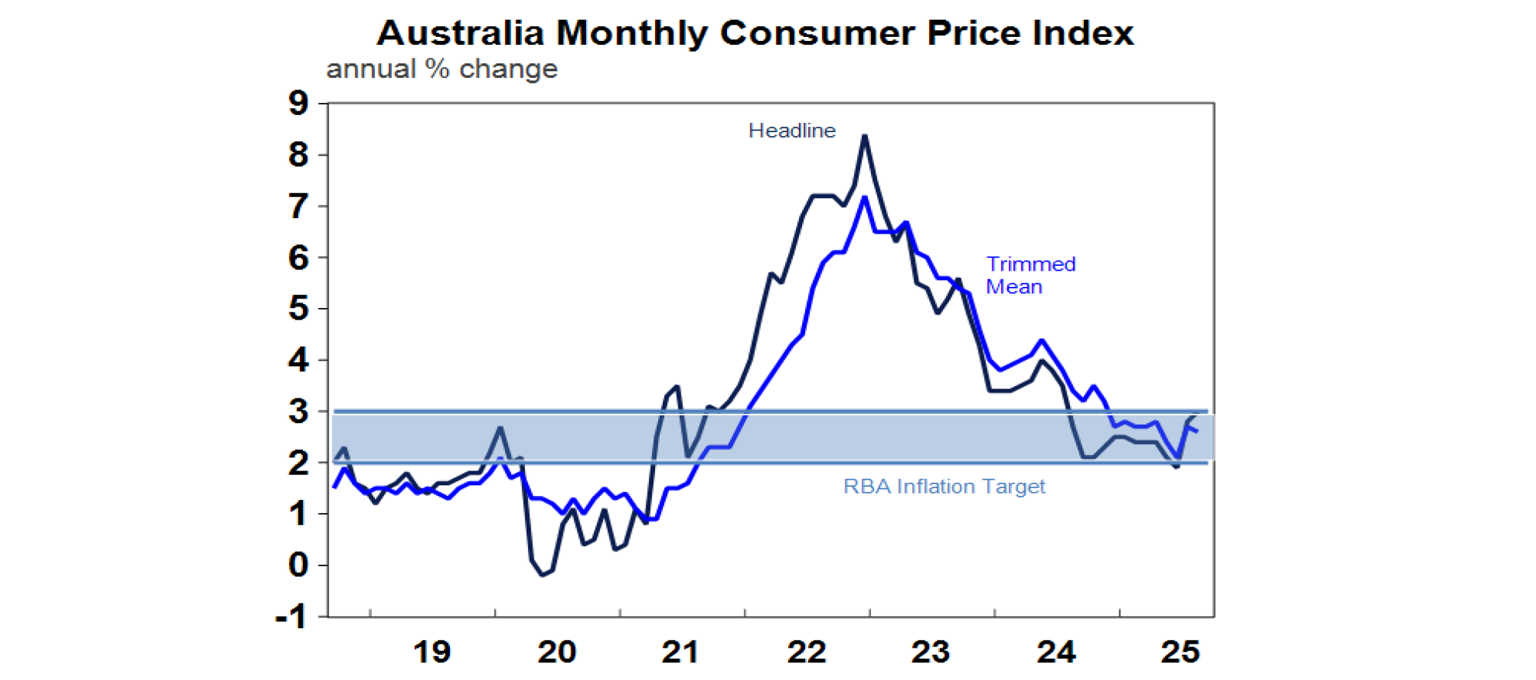
Australian inflation up again in August – does this mean limited scope for further RBA cuts? The August monthly CPI surprised again on the upside taking inflation to 3%yoy, its highest since July last year. This was largely due to a 24.6%yoy rise in electricity costs as various state rebates from a year ago dropped out. More concerningly though strong gains in a range of components including restaurant and takeaway meals, various services and stickiness or maybe even upwards pressure in new dwelling prices and rents raise the prospect that trimmed mean or underlying inflation for this quarter will come in around 0.8-0.9%qoq or so resulting in an annual rate of 2.7-2.8%yoy, which would be well above the RBA’s forecast for around 2.5%yoy. With inflation showing signs of stickiness above target this has led to concerns that the RBA may not be able to cut much more if at all.
Against this though there is a danger in reading too much into the monthly CPI to conclude that we may be at or near the bottom on rates:
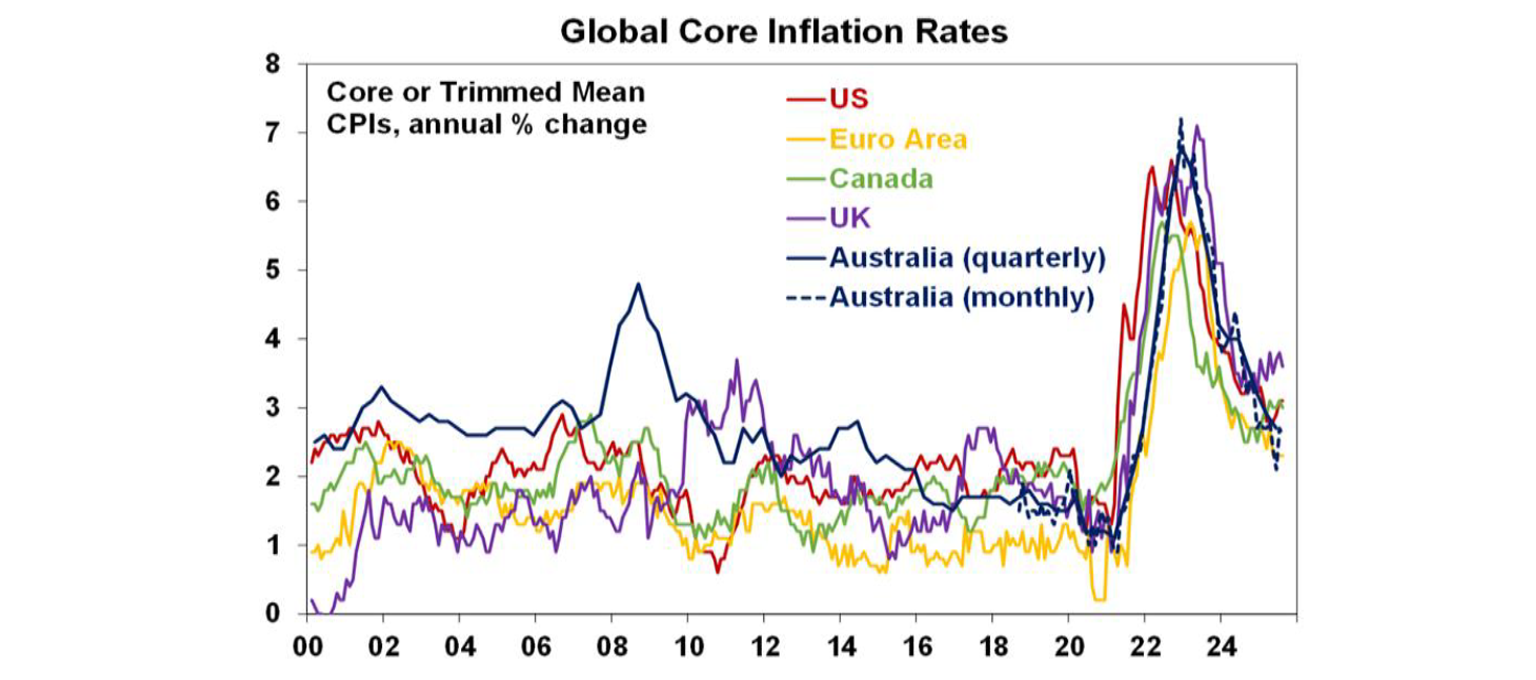
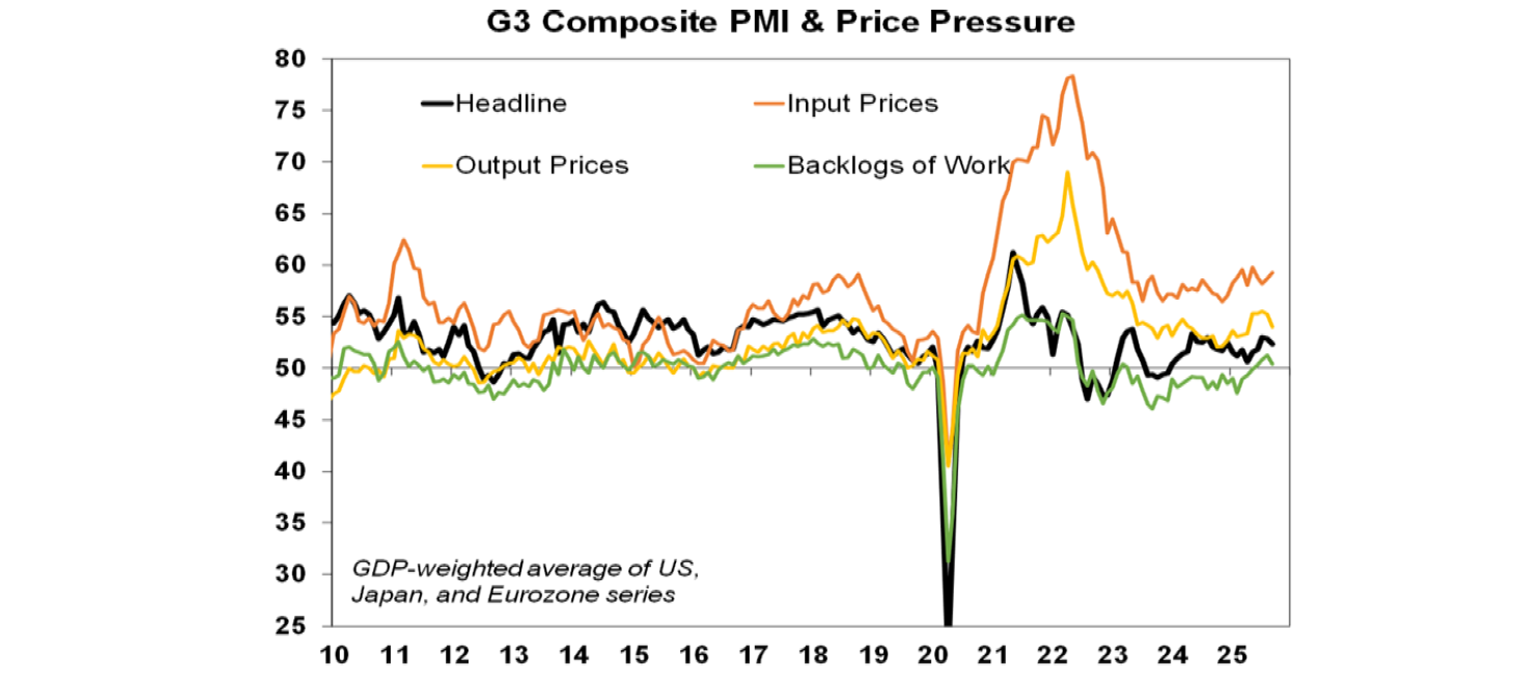
First, the monthly CPI is volatile and goes through hot & cold patches and as we have seen since 2022 and in other countries the fall back in inflation can be quite bumpy. In fact, compared to other similar countries we are doing pretty well. See the next chart.
Second, while its measured slightly differently to the quarterly measure the monthly trimmed mean was 2.6%yoy and has averaged that since the start of the year which is effectively at target.
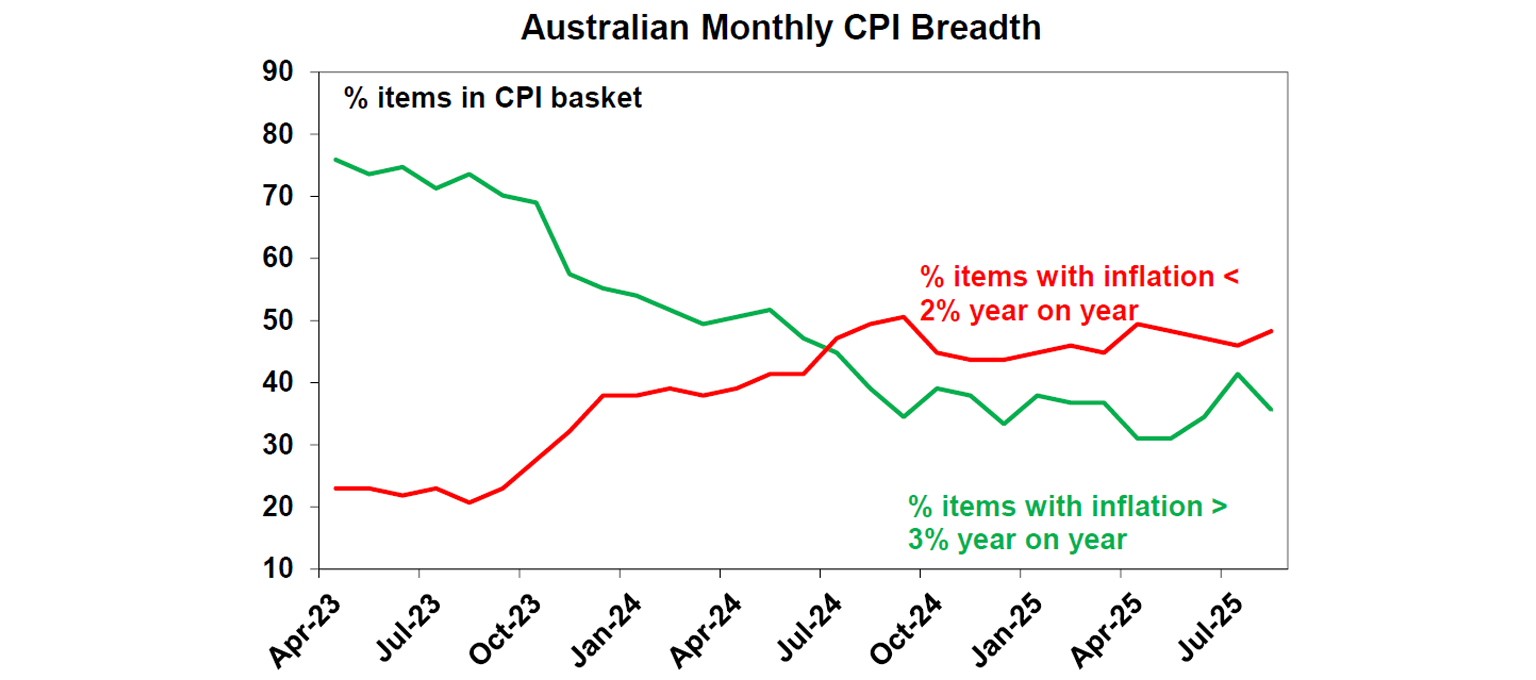
Third, more monthly CPI items are continuing to see inflation rates below 2%yoy than above 3%yoy.
Fourthly, economic growth remains fragile with the risks on the downside and similarly risks to the upside for unemployment given recent signs of softer jobs and uncertainty as to whether the private sector will take over from the public sector in driving employment.
Fifthly, the current level of the cash rate is still judged by the RBA to be restrictive, with its most recently available research showing a mid-point of estimates for the neutral cash rate of around 2.9%.
Sixthly, if the Fed continues to cut in line with market expectations and the RBA holds it will see the Fed Funds rate fall well below the RBA’s cash rate possibly putting substantial upwards pressure on the $A which will bear down on Australian growth and inflation putting pressure on the RBA to cut.
Finally, money market expectations for RBA rate cuts this year have bounced around a lot. Lately they have been wound back but the next shock may see them raised again.
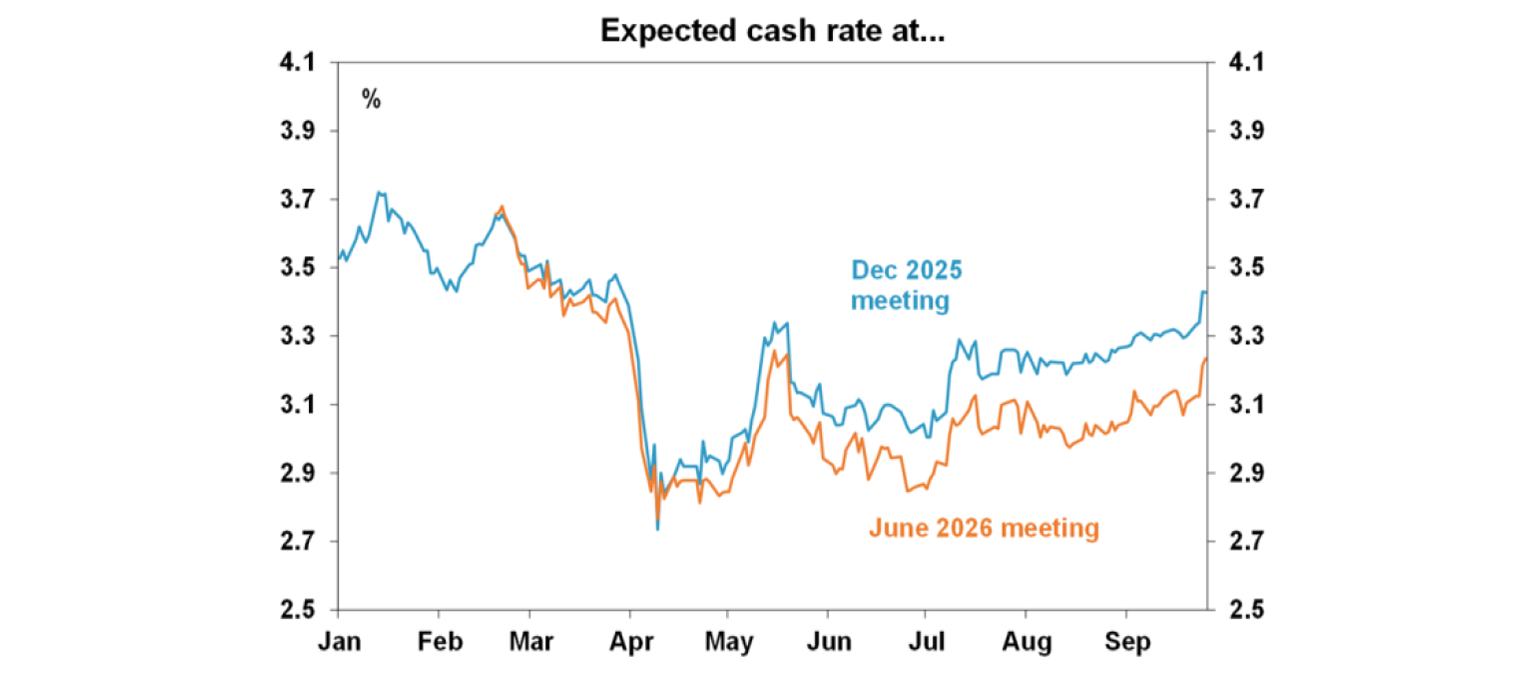
On balance we still expect the RBA to cut rates further but have wound our expectations back to two more cuts rather than three and now see the cash rate bottoming at 3.1% next year rather than 2.85%. At its meeting on Tuesday, we continue to expect the RBA to leave the cash rate on hold consistent with its “gradual” approach to easing the cash rate. But as we saw back in July its tone is likely to be a bit hawkish noting concerns that September quarter trimmed mean inflation will come in stronger than its forecasts for 2.5%yoy and that recent economic data has been in line with or slightly stronger than expected (as noted by Governor Bullock in parliamentary testimony in the last week). Governor Bullock, similar to what happened in July, will likely indicate that the Board will wait for the November meeting to make any decisions by which time it will have the September quarter inflation data, another round of jobs data and revised economic forecasts. Although it’s a close call we see September quarter trimmed mean inflation being close enough to RBA forecasts at 2.6-2.7%yoy to allow another rate cut in November but concede it’s a close call.
Why bother with the monthly CPI? The monthly CPI correlates very roughly with the quarterly when viewed on a graph but its value remain dubious. The RBA has indicated that it will continue to emphasise the quarterly CPI for the foreseeable future even when the full monthly commences for October. So, all it seems to do is give economists and media more to talk about and more for traders to trade on but just adds to the volatility, noise and soap opera around the RBA and interest rates with no benefit to the wider community. There is no hard evidence that not having a monthly hampered RBA policy making and now that we have a monthly its volatility just means we wait for the quarterly to confirm the trend anyway.
Major global economic events and implications
Aggregate business conditions PMIs in developed countries softened on average in September with falls in the US, UK, Japan and Australia. They point to continued moderate economic growth. Input prices rose a bit but output prices fell – but it’s the US keeping them relatively elevated.
The US composite PMI slowed a bit in September with input prices up and output prices down. Prices remain elevated thank to the tariffs.
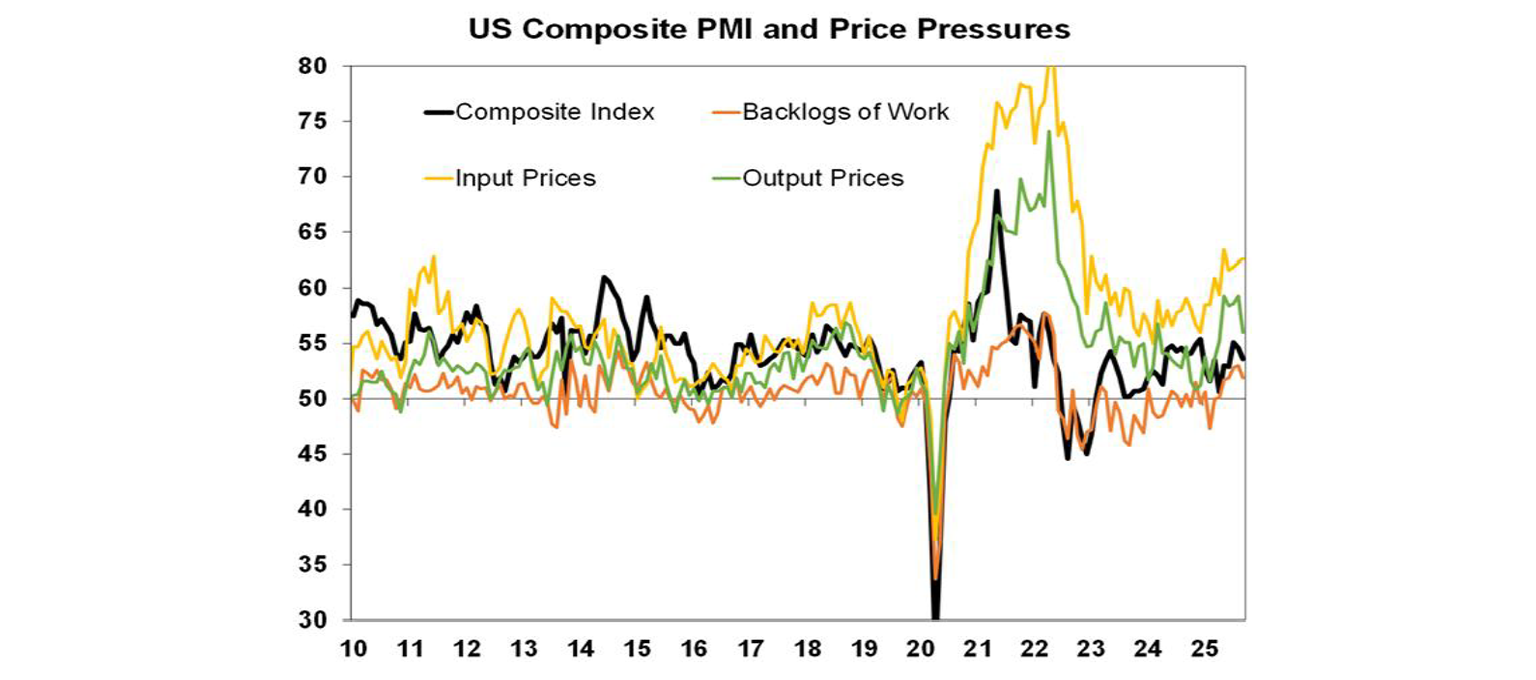
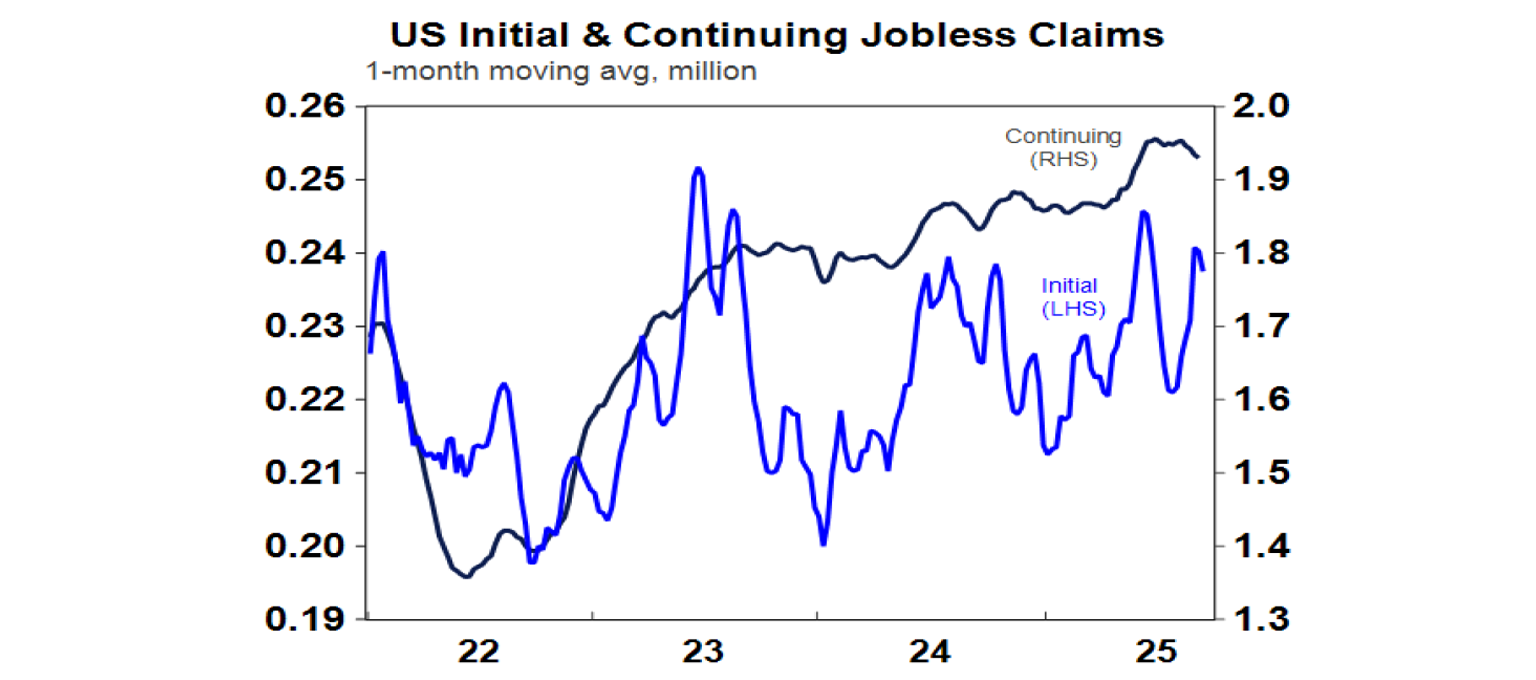
Other US economic data was mostly solid. June quarter GDP growth was revised up to 3.8% annualised mostly due to an upwards revision to growth in consumer spending from 1.7% to 2.5% and personal spending growth remained solid in August. Underlying capital goods orders rose solidly in August. Initial jobless claims fell and remain low, although continuing claims are well up from their lows. Existing home sales remain very weak but new home sales bounced 20% possibly suggesting a boost from lower mortgage rates. Meanwhile core private final consumption inflation of 0.2%mom or 2.9%yoy in August met expectations likely leaving the Fed on track to cut again in October.
Fed speakers were a mixed bag in terms of the outlook for US interest rates ranging from new Trump appointed Fed Governor Miran advocating for multiple cuts to others seeing higher inflation and limited room for rate cuts with Chair Powell in the middle reiterating the cautious dovish message he delivered after the last Fed meeting. The divergence between softer jobs data but still solid economic growth and inflation stuck around 3% means much uncertainty remains as to how much the Fed can cut rates with the outcome ultimately depending on what dominates – will weak jobs pull the economy down on strong growth pull jobs up? The stronger data in the last week though has seen the US money market wind back rate cut expectations into next year from five to four.
Eurozone business conditions PMIs were little changed in September and remain consistent with soft growth
The Swedish central banks surprised with a 0.25% rate cut to 1.75% with weak economic activity, but its guidance was for rates to remain on hold for a while. The Swiss central bank left rates on hold at zero.
Japanese business conditions PMIs slowed in September to levels consistent with soft growth.
Australian economic events and implications
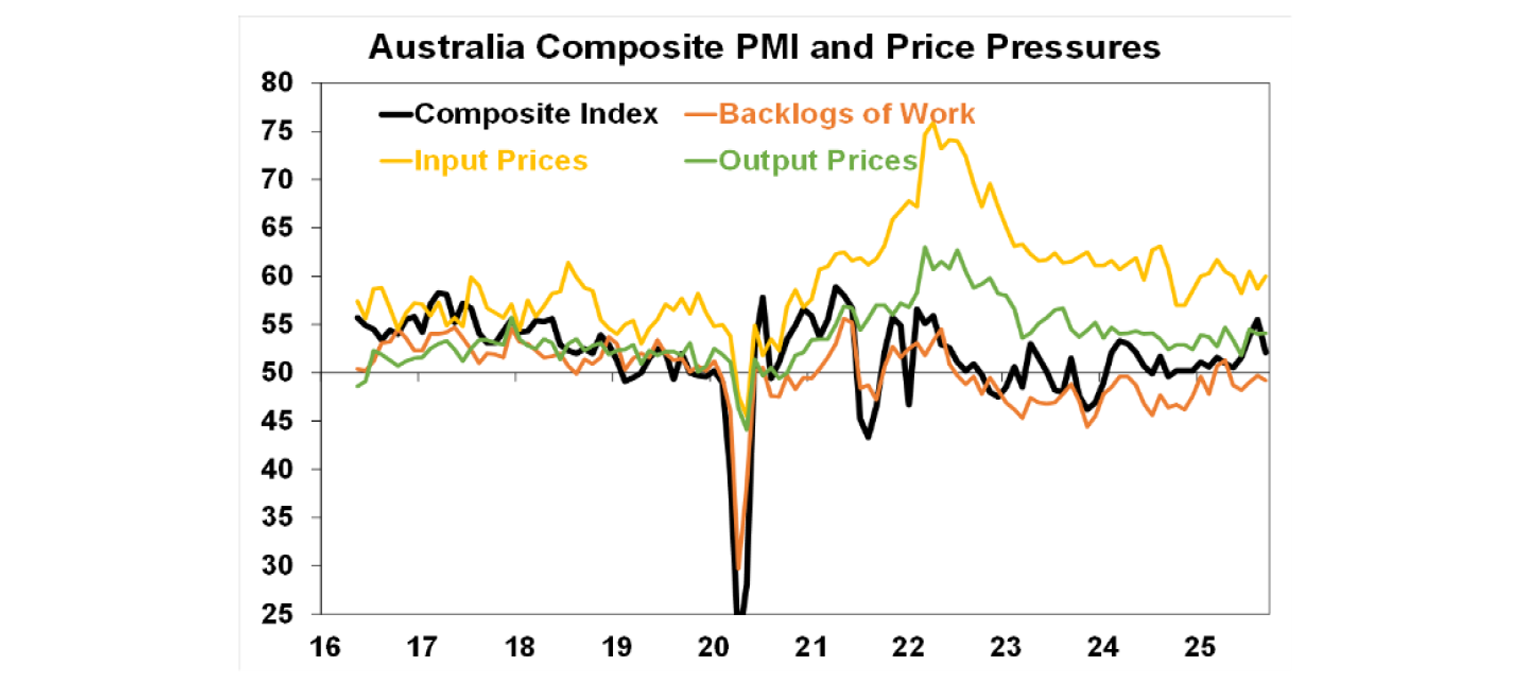
The Australian September composite PMI fell 1.4 points to 51.6 suggesting a more gradual pick up in economic growth. Employment and new orders also fell but remain up from their lows. Input price pressures rose but output price pressures were unchanged with both remaining in recent ranges, albeit a bit higher than in the NAB survey.
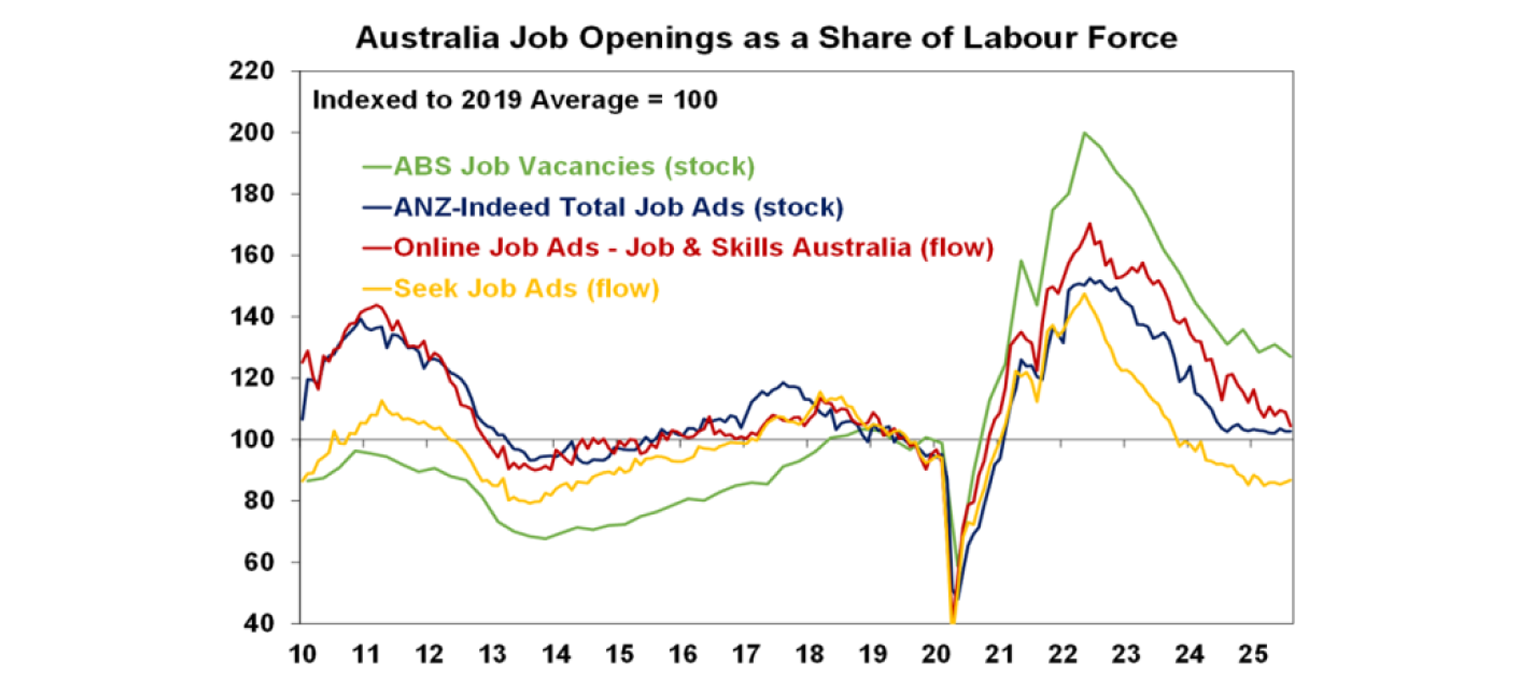
ABS job vacancies fell 2.7% over the three months to August, with a 3.4% fall in private sector vacancies offsetting a 2.2% rise in public vacancies. Vacancies were down in 11 out of 18 industries and the number of unemployed people per vacancy rose from 1.9 to 2. While the level of job vacancies as measured by the ABS remains high compared to the pre-covid norm, they are continuing to trend down suggesting a cooling jobs market with the ongoing decline in private sector vacancies a concern.
What to watch over the week ahead?
US jobs data for September (Friday) are expected to show an ongoing softening trend in jobs growth with payrolls likely to rise by 50,000 after the weak 22,000 gain in August, unemployment remaining at 4.3% and average hourly wages growth slowing to 3.6%yoy. In other data, expect a further slowing in job openings, consumer confidence and home price growth (all due Tuesday), a continuing sub par reading in the ISM manufacturing index (Wednesday) but an okay reading in the ISM services index (Friday).
Eurozone CPI inflation for September (Wednesday) is expected to rise to 2.2%yoy with core inflation remaining at 2.3%yoy. Unemployment for August (Thursday) is expected to stay at 6.2%.
The Japanese September quarter Tankan business survey (Wednesday) will likely show continuing okay economic conditions. Employment data will be released Friday.
Chinese business conditions PMIs for September (Tuesday) are likely to remain subdued.
In Australia, as noted above the RBA is expected to leave rates on hold with a hawkish tone indicating it will await more data and revised forecasts in order to make an assessment at its November meeting. On the data front in Australia, expect a 3% rise in building approvals (Tuesday), credit data (also Tuesday) to show a rise in housing credit growth, Cotality data for September (Wednesday) to show an acceleration in home price growth to 0.9%mom, household spending for August (Thursday) to slow to 0.1%mom or 5%yoy and the trade surplus (also Thursday) to slip to around $6bn.
Outlook for investment markets
Share markets remain at risk of a correction given stretched valuations, risks around US tariffs and the softening US jobs market. But with Trump pivoting towards more market friendly policies and central banks, including the Fed and RBA, likely to cut rates further, shares are likely to provide reasonable gains on a 6-12 month horizon.
Bonds are likely to provide returns around running yield as central banks cut rates.
Unlisted commercial property returns are likely to improve as office prices have already had sharp falls in response to working from home.
Australian home prices have started an upswing on the back of lower interest rates. But it’s likely to be modest initially with poor affordability and only gradual rate cuts constraining buyers. We see home prices rising around 7% this year, and 8-10% next year.
Cash and bank deposits are expected to provide returns of around 3.5%, but they are likely to slow.
The $A is likely to be buffeted in the near term by the impact of US tariffs but may be breaking higher now with the Fed looking like it will cut more than the RBA. Undervaluation should support it on a medium-term view with fair value around $US0.73.
You may also like
-

Oliver's insights - Why have Australian living standards “fallen” and how do we fix it? For the last few years there has been much talk of a “cost-of-living” crisis in Australia and of “falling living standards”. This has flared up again lately with the pickup in inflation resulting in a renewed fall in real wages. -

Weekly market update - 10-07-2026 Ceasefire over but markets are also over the war, Why oil prices can't go too low or too high, Is AI adding to inflation risk or taking it away, and Australia’s wage problem. -

How to protect yourself from phishing and impersonation scams Phishing scams can look like everyday messages – emails, texts or calls. Learn the signs and simple steps to protect your money and personal information.
Important information
Any advice and information is provided by AWM Services Pty Ltd ABN 15 139 353 496, AFSL No. 366121 (AWM Services) and is general in nature. It hasn’t taken your financial or personal circumstances into account. Taxation issues are complex. You should seek professional advice before deciding to act on any information in this article.
It’s important to consider your particular circumstances and read the relevant Product Disclosure Statement, Target Market Determination or Terms and Conditions, available from AMP at amp.com.au, or by calling 131 267, before deciding what’s right for you. The super coaching session is a super health check and is provided by AWM Services and is general advice only. It does not consider your personal circumstances.
You can read our Financial Services Guide online for information about our services, including the fees and other benefits that AMP companies and their representatives may receive in relation to products and services provided to you. You can also ask us for a hardcopy. All information on this website is subject to change without notice. AWM Services is part of the AMP group.