


Weekly market update
Investment markets and key developments
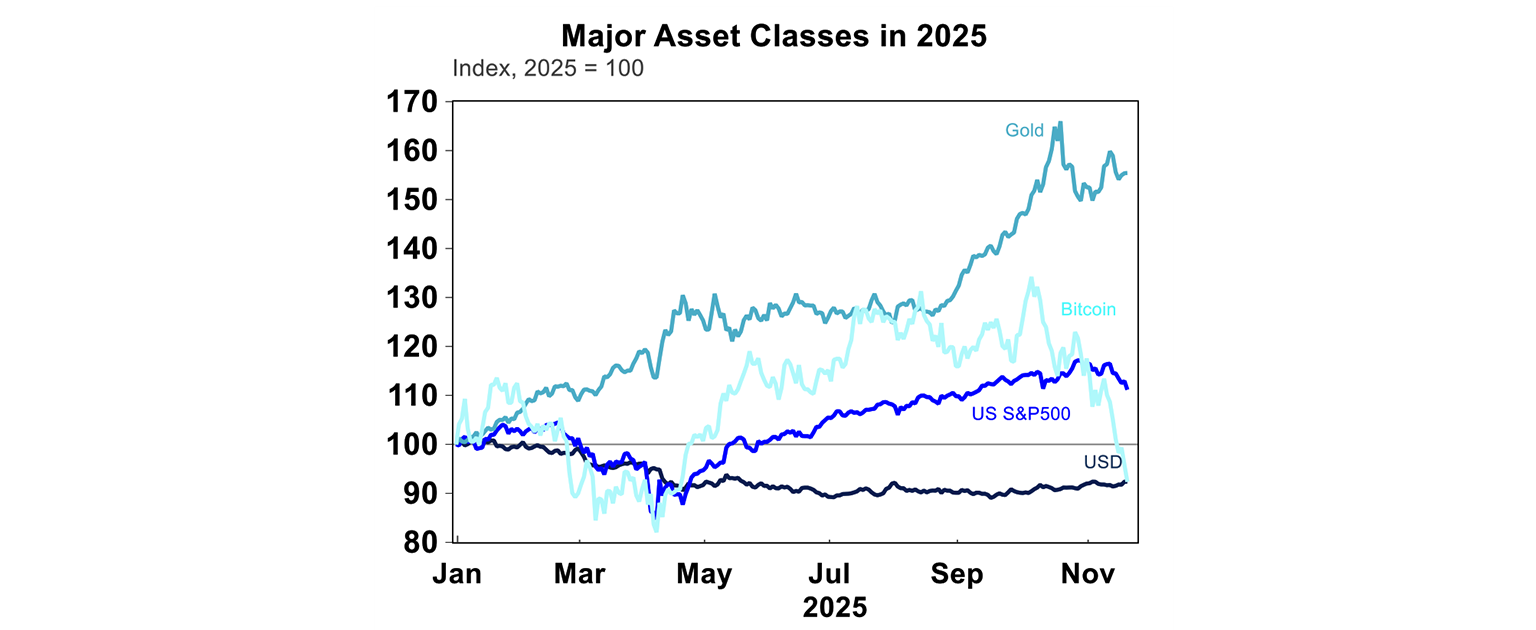
Bitcoin has been moving in the same direction as share markets lately (rather than against it) and had another steep fall this week, more than erasing its gains for the year, down to its lowest level since April last year at below $84,000.
10 min read

The risk averse backdrop that has been dominating investor sentiment continued into this week. Investors have been uneasy about the “overvalued” tech sector and signs of softer earnings growth, a December Fed rate cut looks less clear cut and the recent lack of US data following the government shutdown has created a “fog” for the central bank, making it harder to manage monetary policy. Solid earnings from tech darling Nvidia this week were not enough with US shares down 1.7% with tech battered but also weakness across consumer discretionary, financials, industrials, materials and energy. Australian shares were down by 2.5% over the week, with tech, materials and utilities the worst hit. Other major share markets were also all in the red. But since the peak, US shares are only down ~4% (since October).
Bitcoin has been moving in the same direction as share markets lately (rather than against it) and had another steep fall this week, more than erasing its gains for the year, down to its lowest level since April last year at below $84,000. But other parts of the “debasement” trade did better. Gold was up (although still down from its highs), iron ore also rose and oil prices remain around $60/barrel. The $US has been trending up and is near a six-month high, but is still down ~8% since the beginning of the year.
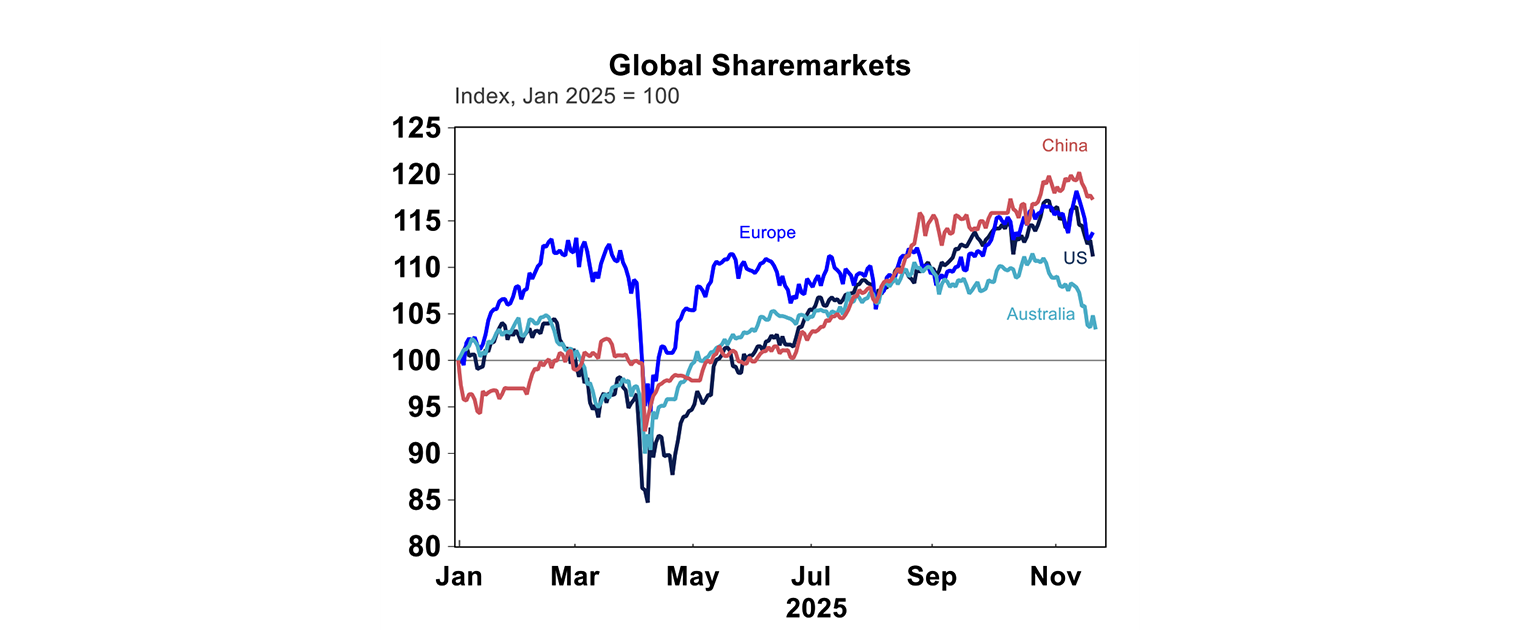
US shares are 11% higher year to date (see the chart below), which has outperformed Australia (+5%). Europe and China have done better this year.
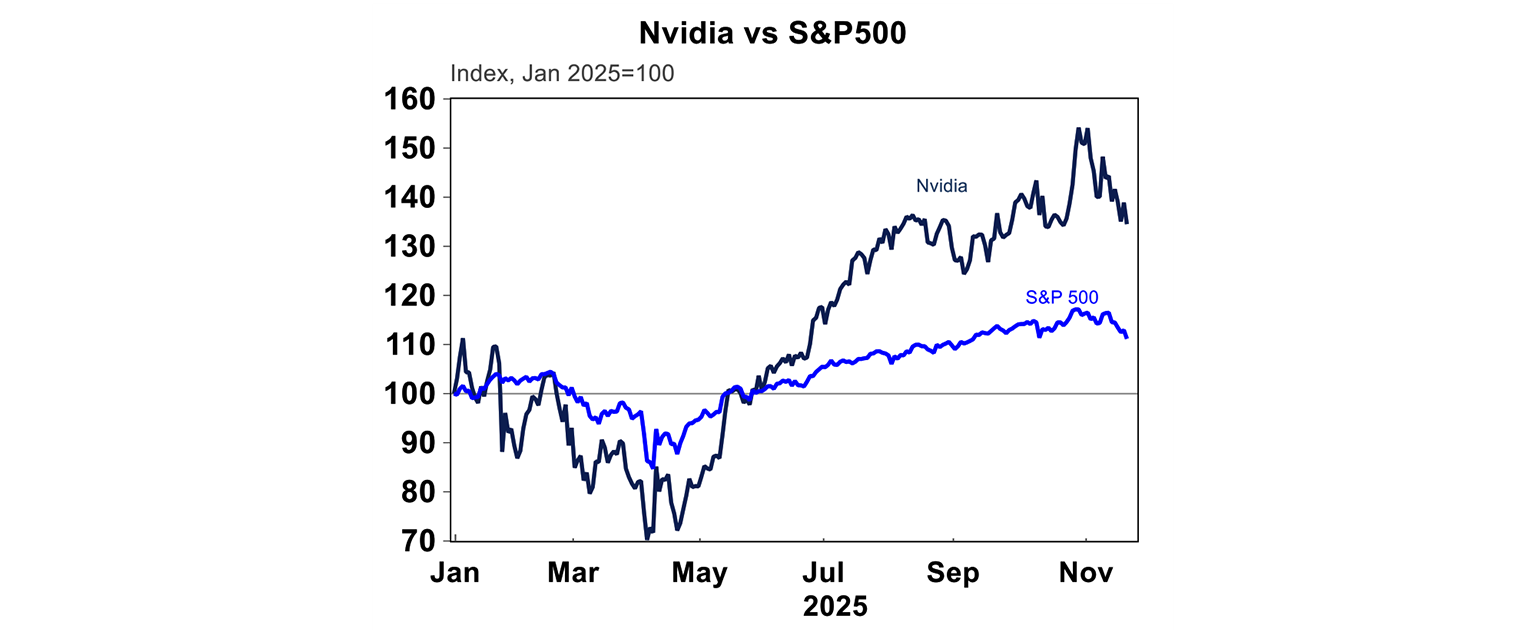
The concern around the AI bubble was tested this week with Nvidia, the world’s largest chipmaker, reporting third quarter earnings. The results from Nvidia were strong. Revenue beat expectations, Blackwell chip sales “off the charts” with CEO Jensen Huang indicating continued strong demand for their products as companies invest in AI, with lots of deals also going on between the major tech companies (between the chipmakers, data centre operators and other AI companies) which continue to fund revenue and sales. While these results were good and initially the Nvidia share price responded positively, other issues around expectations for rate cuts dragged the market down.
Nvidia has still managed to outperform the market year to date (see the chart below).
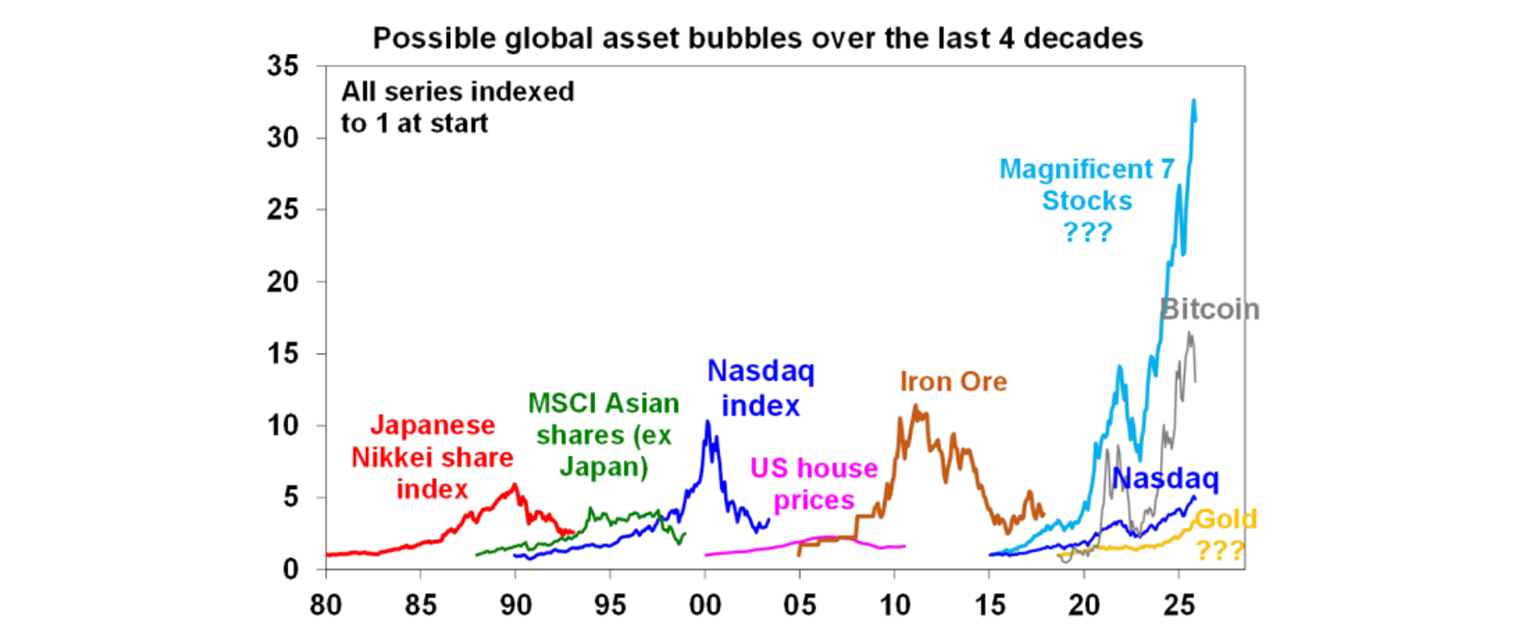
There is no doubt that the US tech sector has many “bubble like” characteristics – very high valuations, concentrated exposure and high interconnection between members of the system. Here is a chart of historical asset bubbles through time. Clearly the Mag 7 stocks have already outperformed any of these bubbles (even Bitcoin!).
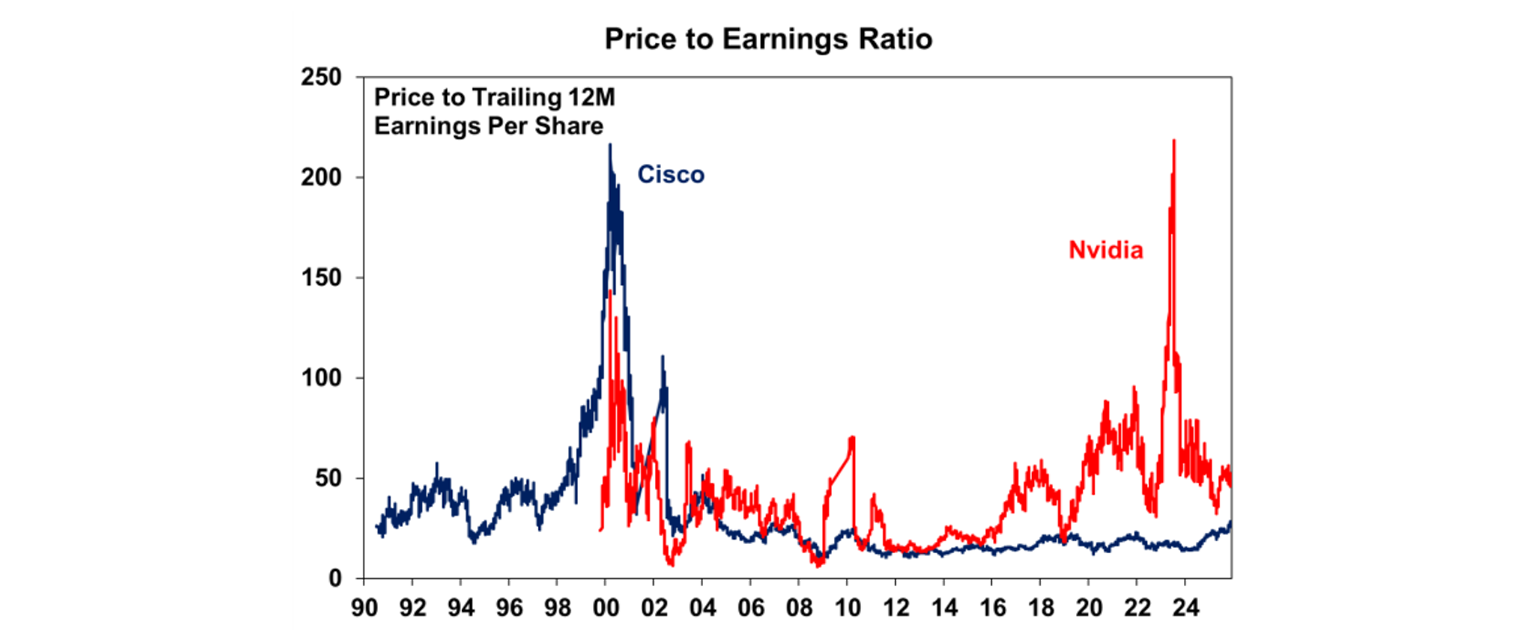
A typical measure used to look at company valuations is the price to earnings ratio (share price divided by earnings per share or P/E. This is used by analysts use to see how much investors are willing to pay for a company stock, for each dollar of a company’s earnings. A high P/E ratio means investors usually indicates investors expect high future earnings, so are willing to pay more at the current share price. A low P/E ratio could indicate that the stock is undervalued or that the company genuinely has low earnings growth prospects. Investors get nervous when P/E ratios get too high, because there is a higher risk that the stock price has moved beyond its fundamentals.
For Nvidia, the P/E ratio looks contained relative to tech company Cisco before it plunged in the early 2000’s dot-com crash.
In our view, there is still more upside for tech earnings as AI adoption is still in its early stages. The same pace of growth for US tech stocks is unsustainable, but this does not mean that prices have to “pop”. The bubble could just deflate a bit!
Investor concern about overvaluation, concentration risk in tech, moderate US economic growth alongside elevated inflation are not new risks. You could have used these factors to explain the state of markets in early 2025. Now that the government shutdown is over, Trump and his team are making more concessions and tariffs and US shares usually perform well in November (although it hasn’t happened this time round) and December due to seasonality, shares should have a better end to the year.
Major global economic events and implications
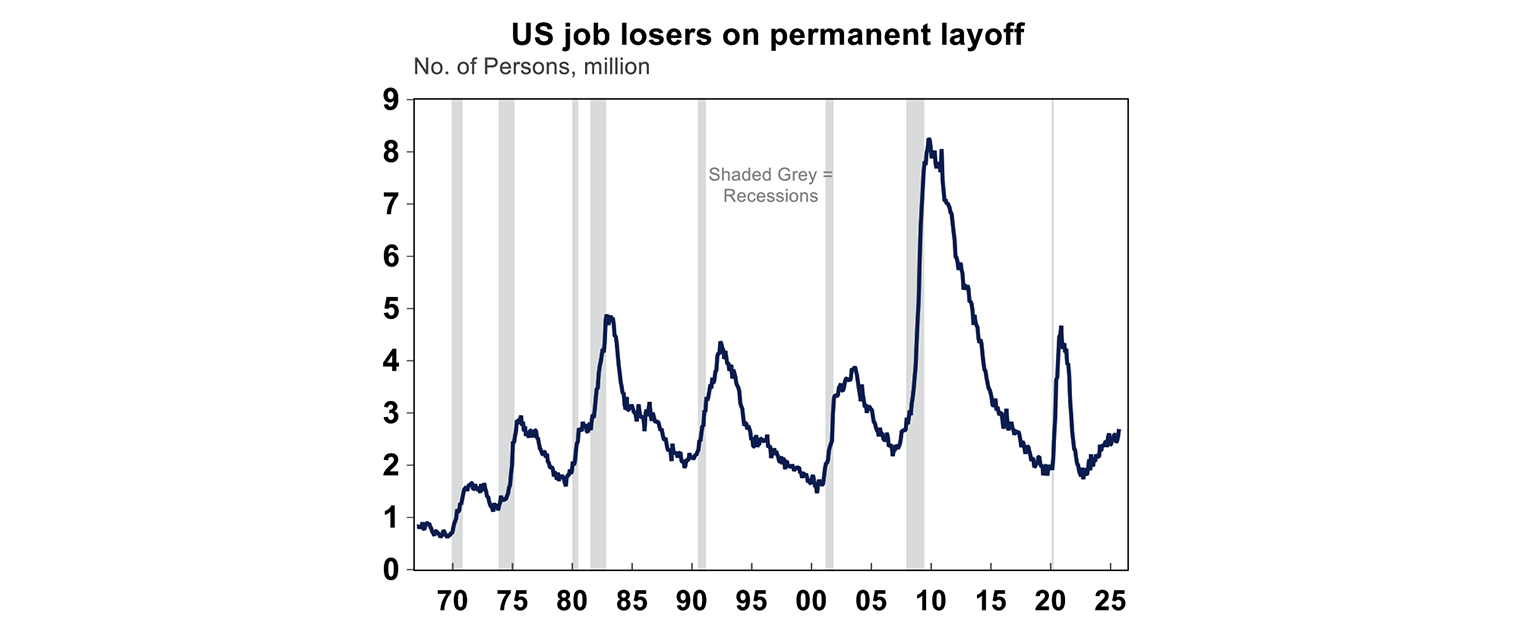
The end of the government shutdown has resulted in a data deluge this week. US non-farm payrolls for September showed solid jobs growth of 119K over the month (double the rate of expectations), but the unemployment rate ticked higher to 4.4%. There is also a clear trend up in the number of people who are permanently unemployed (rather than temporarily) – see the chart below. This indicates that the labour market continues to soften slightly.
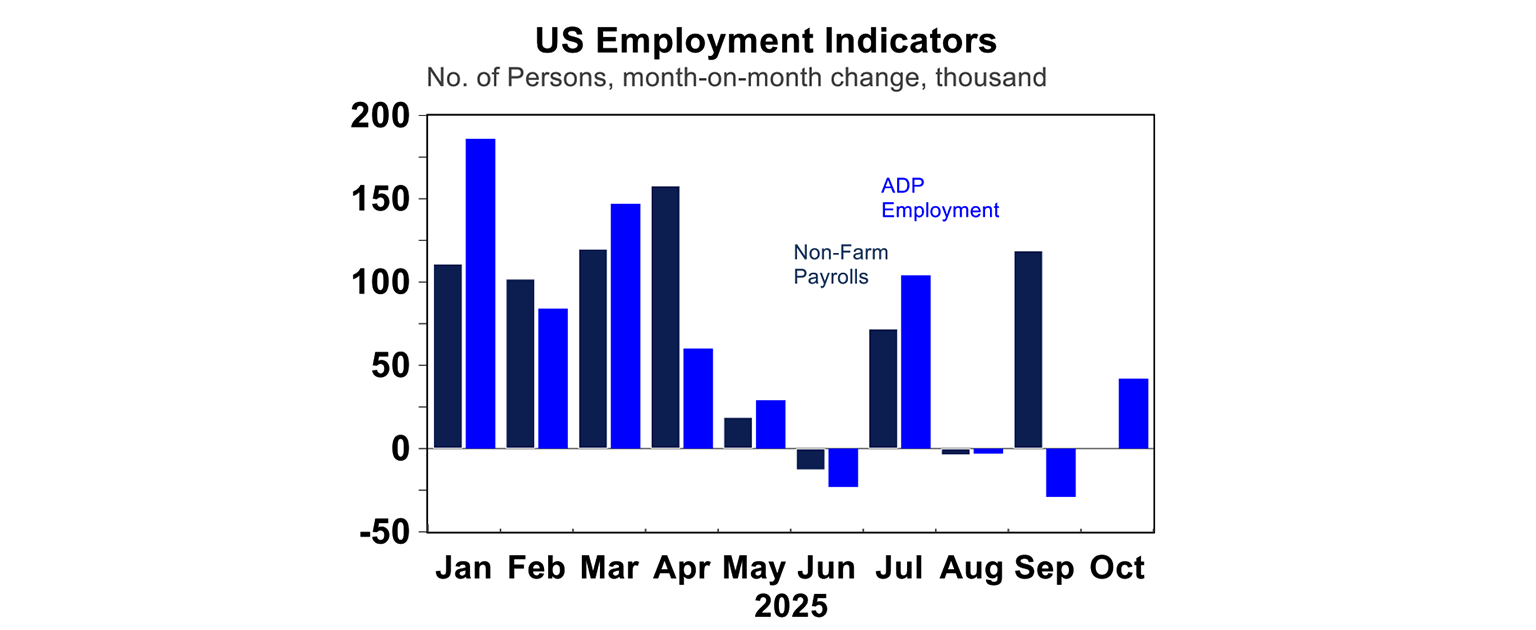
Unfortunately, there will be no October payrolls data until after the Fed December meeting. The private ADP employment numbers showed low jobs growth in October but have not been a complete reliable indicator compared to the official payroll figures (see the chart below).
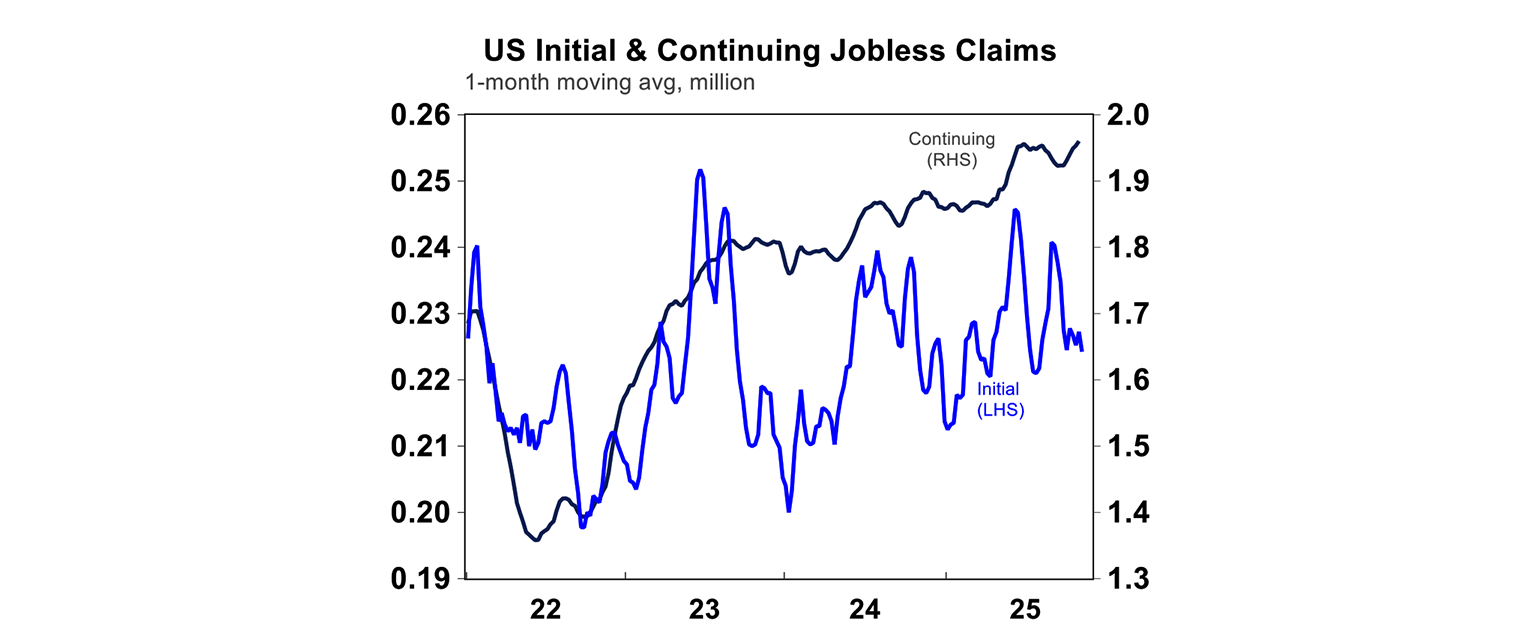
Other labour indicators including initial and continuing jobless claims are mixed. Continuing jobless claims are trending up, in line with permanent layoffs but initial jobless claims are still low. This suggests that while actual firing of staff is still contained, the labour market has weakened and its harder for people who are looking for work to find a new role. Given this mixed backdrop, its no surprise that Fed Board members are themselves divided in their opinions around what to do around monetary policy.
The October Fed meeting minutes showed the divergent range of views on the committee around future interest rate changes. As Evercore ISI have been calling it, it’s a “crisis of governance”. Around half of FOMC participants (voters and non-voters) were part of a hawkish “revolt” against a potential Dec rate cut. At the end of the week, NY Fed president Williams (one of Powell’s senior Fed members) spoke out in favour of a December rate cut saying “I see room for a further adjustment in the near term” which has lifted the probability of a December rate cut as he could be guiding the market and providing some clarity, after a week of very mixed views from Fed members. Financial markets are pricing in a 63% chance of a December rate cut which looks about right.
Global PMI’s (an indicator of business conditions) showed that in the US conditions were slightly worse in manufacturing but stronger in services, so the composite indicator actually went up. It was the same story in Europe, manufacturing fell (and was negative), but services was better.
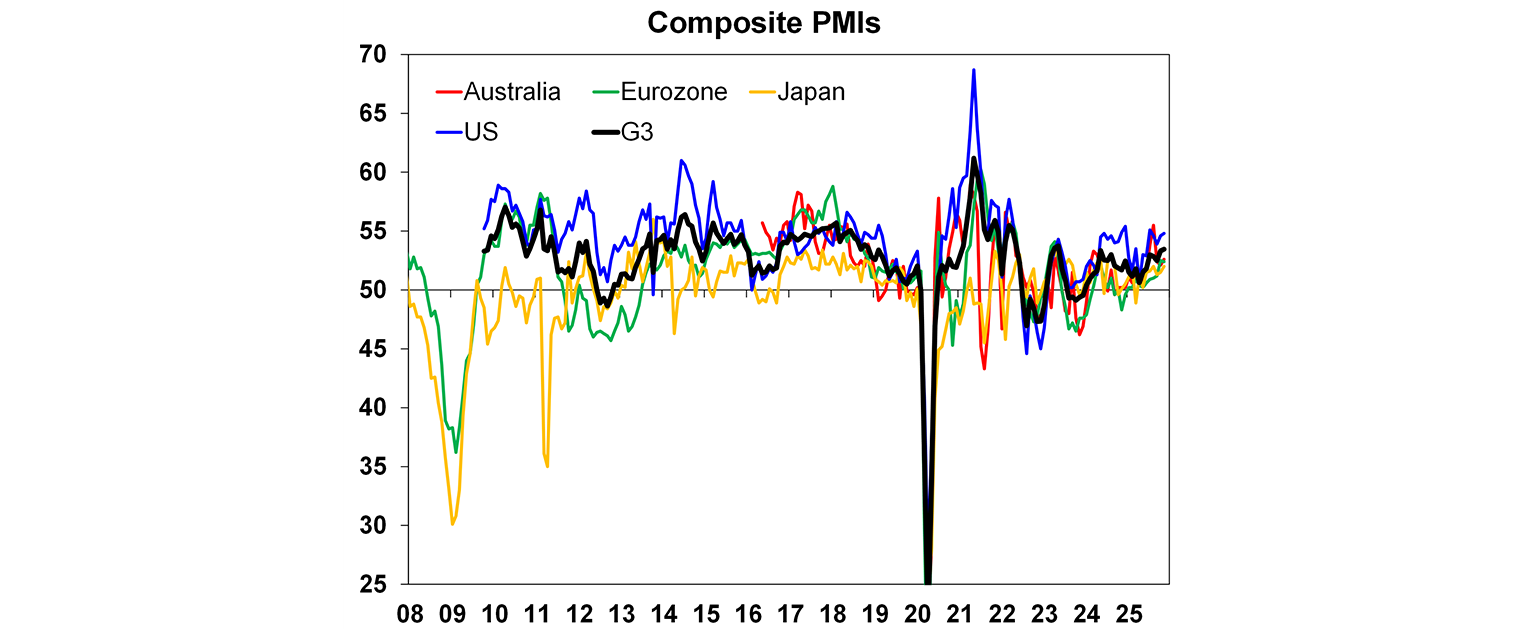
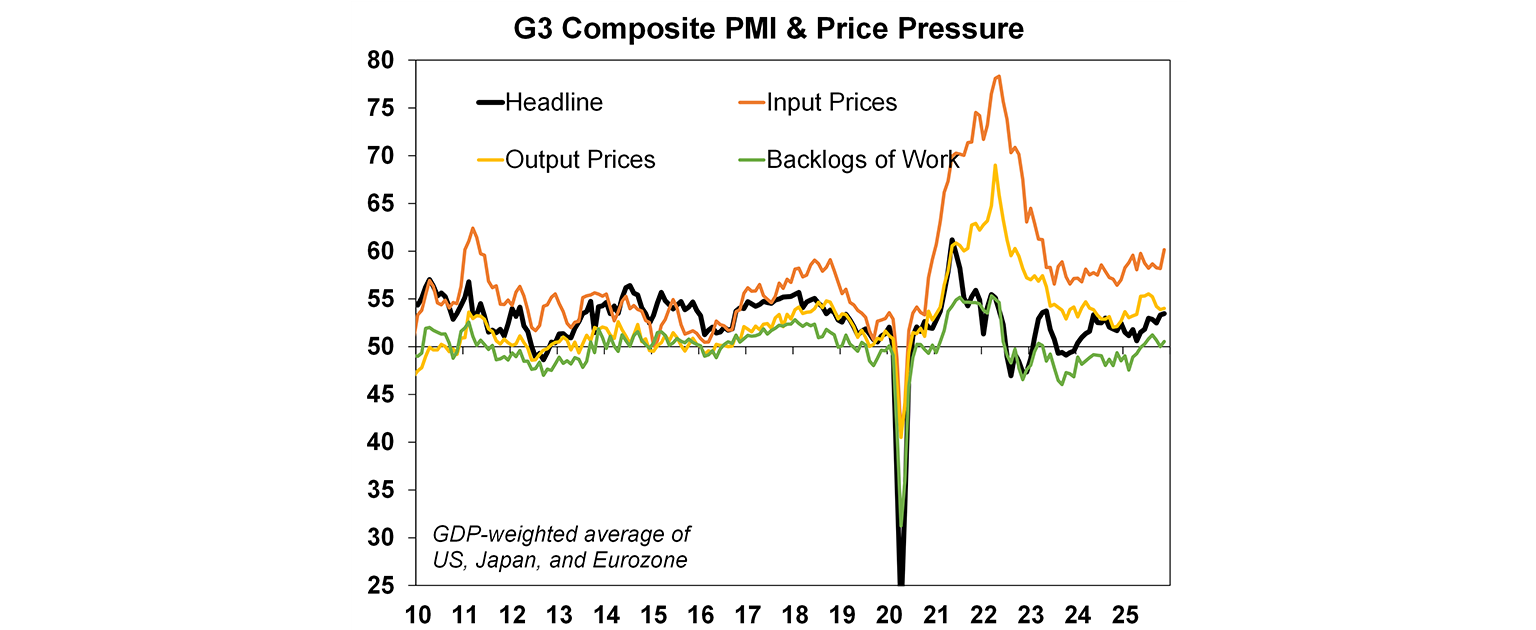
For the G3, overall business conditions remain positive. Input prices rose (not good news for inflation) but output prices moderated.
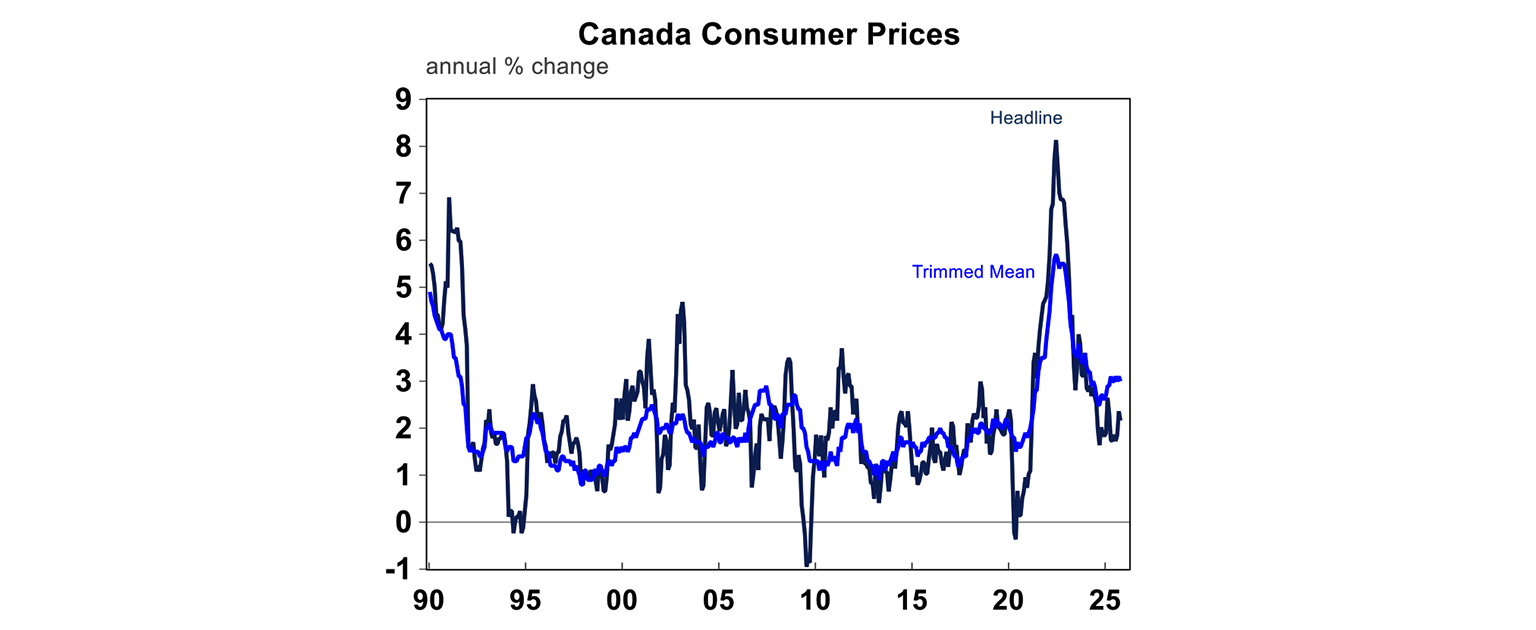
Canada’s inflation minutes showed headline inflation up by 2.2% over the year to October but core inflation was 2.7% over the year. But, given structural downside pressure in Canadian economy, inflation likely to slow from here.
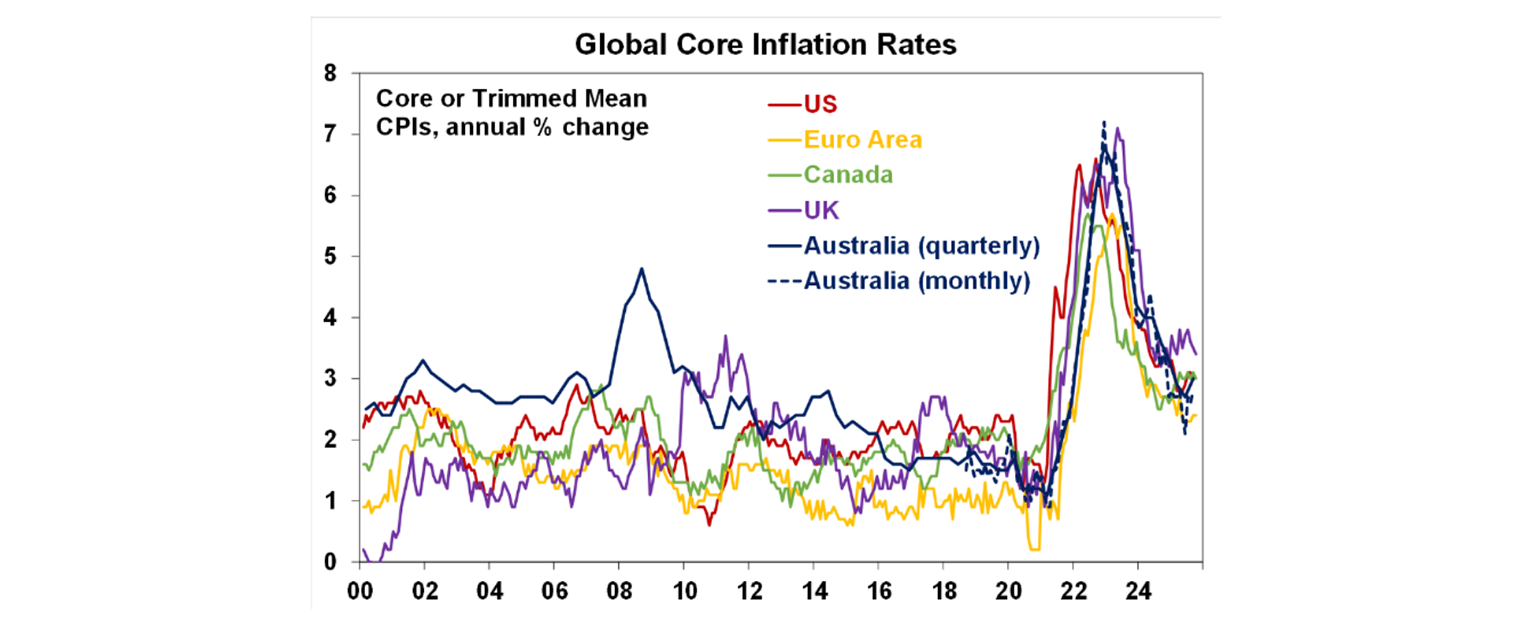
UK inflation rose by 3.6% over the year to October. Core CPI was 3.4%, same as last month but services inflation remains unsustainable at 4.5% over the year. Despite this high inflation, the Bank of England is still expected to cut interest rates again because of rising unemployment.

UK core inflation remains elevated compared to global peers (see the chart below). Most country inflation rates are running in the 3% range.
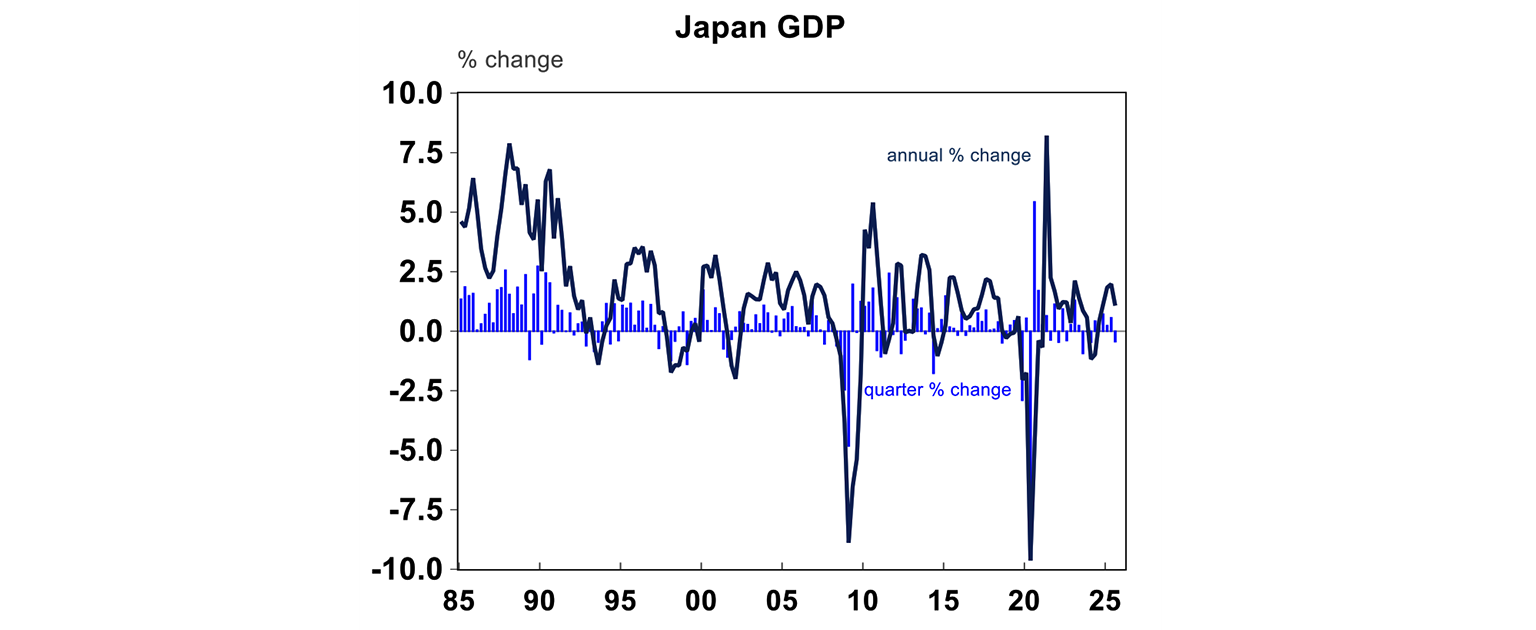
Japan’s September quarter GDP contracted by 0.4% over the quarter and is up by 1% over the year. The decline over the quarter was a reversal in net exports after front loading exports before tariffs hit. The weakness in growth could prove a hurdle for a Bank of Japan rate hike but probably provides new PM Takaichi to push through fiscal stimulus, which she did late on Friday. The new government unveiled plans for a Y21.3 trillion ($135bn) stimulus package, around 4% of GDP which is very sizeable. The fiscal package will include support for semiconductors, AI and shipbuilding. The government will increase tax thresholds, provide an additional child payment, subsidise electricity and gas bills, remove gasoline tax and increase transfers to local governments to finance rice vouchers. Japanese bond yields moved slightly higher on this news.
Australian economic events and implications
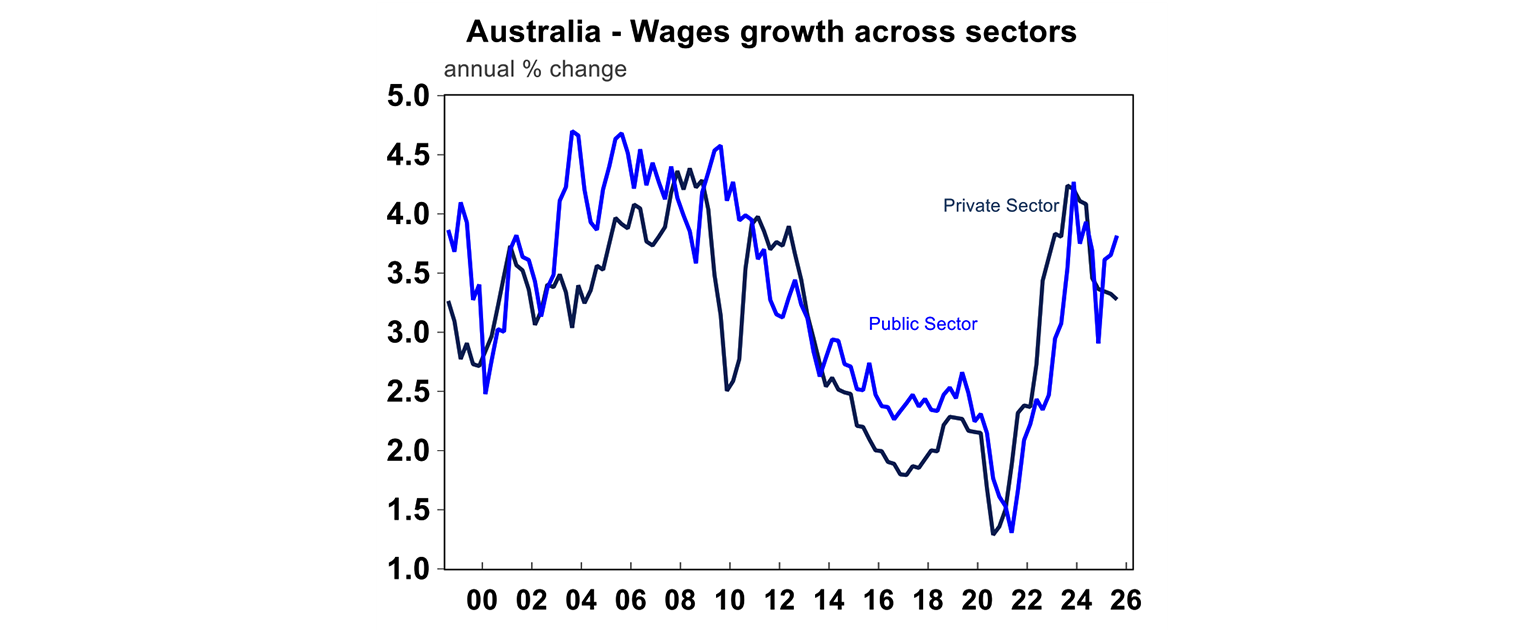
The September quarter wages data rose by 0.8% (as expected) and was up by 3.4% over the past year, slightly down on last quarters 3.5%. Private sector wages were a tad weaker than the headline, up 0.7% or 3.2% over the year and public wages were stronger, 0.9% higher or 3.8% over the year. Higher public wages reflects stronger public sector jobs growth and recent state government enterprise agreements.
Sectors that received the largest wage increase in the last 12 months have been in the non-market sector including public administration, utility services, healthcare and education. Finance and insurance continue to be at the bottom for wage rises across sectors.

Some of the components of the wages data looked weaker than the headline. The share of jobs with “large” wage increases (above 4%) declined to 24% (around the historical average) and the proportion of jobs with wage gains below 3% is increasing again (see the chart below).

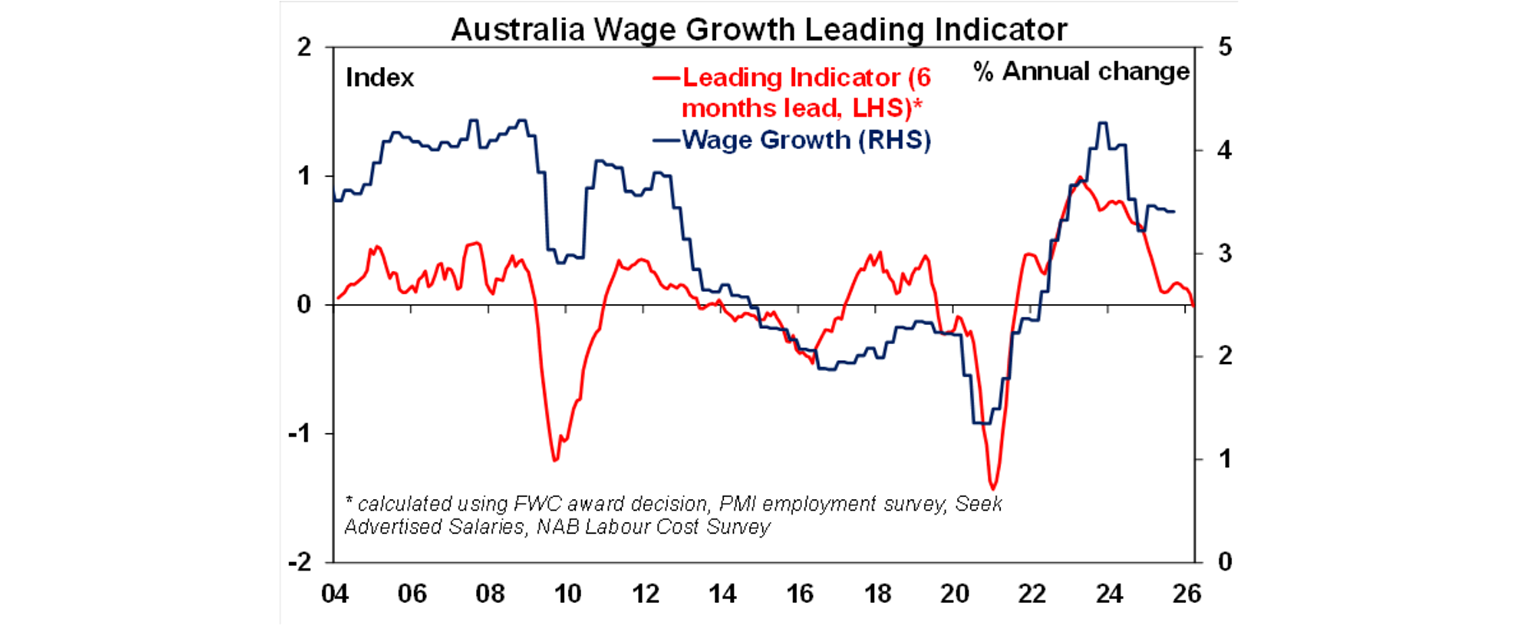
Our forward-looking jobs indicator suggests that wages growth is likely to slow from here as the labour market moves more into balance and the unemployment rate inches higher.
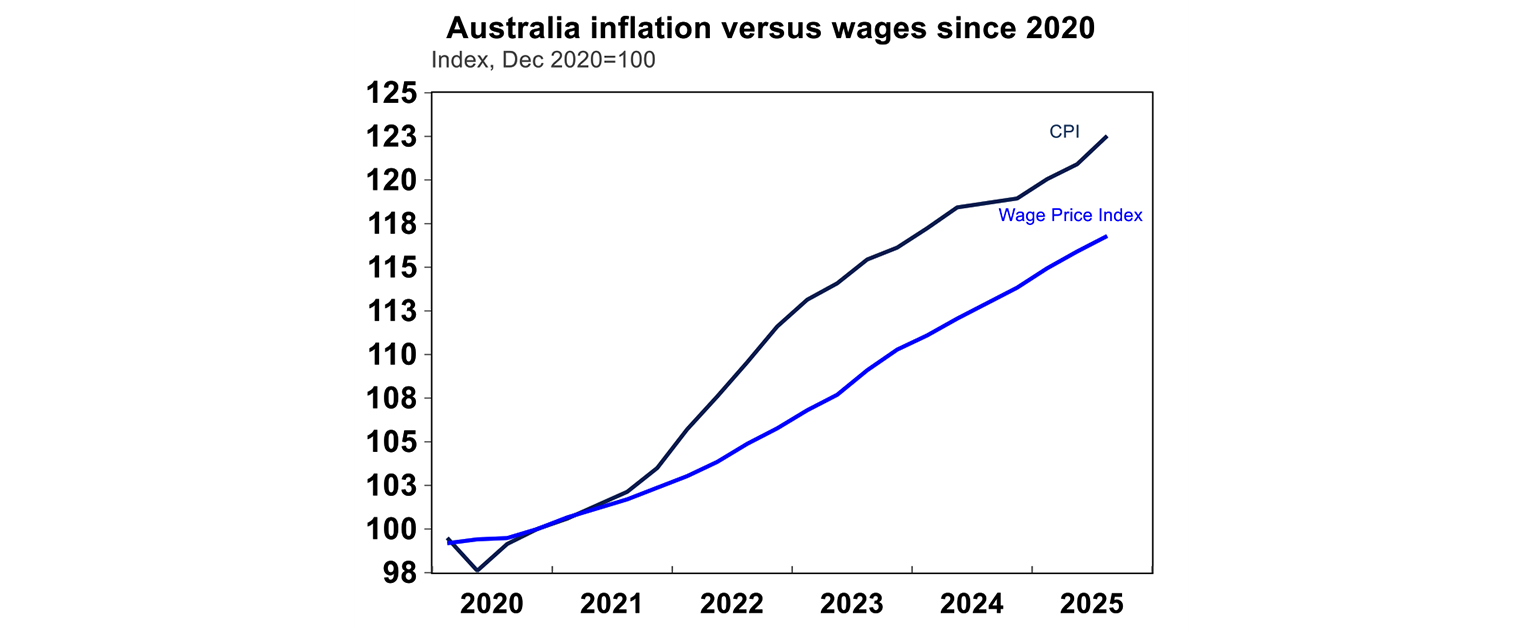
The good news for consumers is that now inflation (at 3.2% over the year to September) is running below wages growth (at 3.4%) which means that consumers are getting real wage increases. However, there is still a gap between the high inflation rates over the past 5 years (prices have increased by 23%) and lower wages growth (up by 17%) which is households are still feeling the cost-of-living issues, although the gap is narrowing.
RBA Assistant Governor Sarah Hunter spoke at the Australian Industry Group lunch about 3 key questions the RBA is currently investigating. These include 1/ inflation dynamics more specifically how firms are making pricing decisions 2/ the economy’s supply capacity (specifically in the labour market looking at the trend up in older workers and women in the labour force, whether some people have left the workforce as cost-of-living has improved and the matching of skills to jobs) as recently highlighted by Deputy Governor Hauser and 3/ the transmission of monetary policy and whether it has changed.
The RBA minutes for the November meeting (at which the central bank left rates on hold) reiterated the detail in the Statement on Monetary Policy around the upward revisions to inflation and updated considerations for the output gap (which reflected Deputy Governor Andrew Hauser’s recent speech). The overall tone from the minutes was one of a mild easing bias, but with no clear rush to cut rates.
RBA Board external Board member Fry-McKibbin wrote in the AFR opinion that “equal consideration” of the price stability and full employment mandate does not mean equal weight. This is the first time an external RBA Board member has spoken publicly, but this will probably become more normal as part of the review into the RBA.
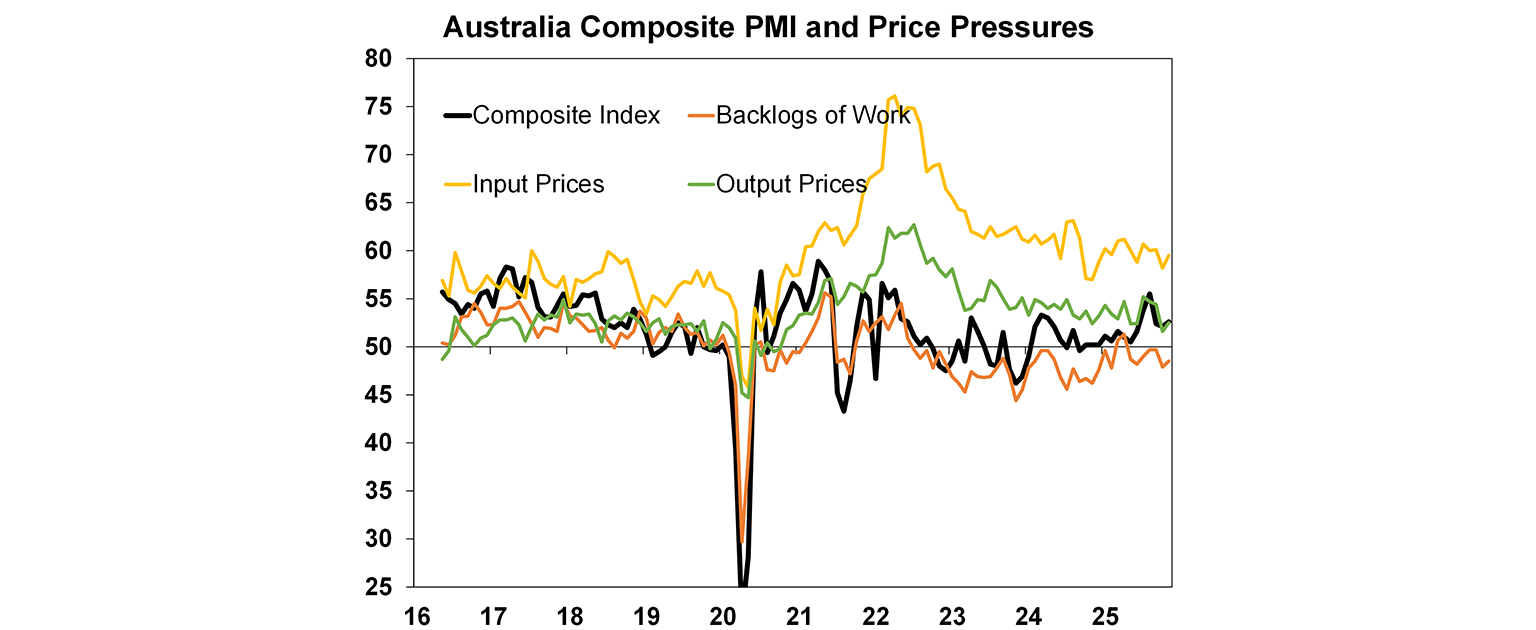
The Australian PMI (an indicator for business activity) improved in manufacturing and services. The components showed that price indicators are flat-lining (although it would be nice to see them slowing) but business conditions are still okay.
What to watch over the next week?
In Australia we get the first “full” monthly consumer price index for October. Since September 2022, Australia has had a CPI “indicator”. It has been a “full” CPI because not every category was surveyed every month. This is now changing with the full monthly CPI which (in theory) should give timelier readings about inflation, although in the short-term there will still be some volatility to work through as economists navigate the usual monthly patterns in seasonal price changes. So, it may still be a while before the RBA can fully rely on the monthly CPI to give it a complete accurate read of inflation pressures, relative to the reliable quarterly data. We expect a monthly increase of 3.6% over the year and 2.8% for the trimmed mean. Prices for dwelling construction and rents are likely to be up, food and goods prices are likely to be slightly higher while electricity and petrol will be down.
We also receive some components or what economists call “partials” that are an input into GDP. September quarter construction work done is expected to fall slightly with residential construction higher but a large fall in engineering construction due to a finished project last quarter which elevated the figures. The September quarter capital expenditure figures are expected to be up by 0.8%, with some positive signs in business investment (especially related to data centres and tech). The October credit data looks at growth in the stock of housing, personal and business credit and we expect a solid lift of 0.6%, with a lot of growth coming from housing-related investors.
Data releases in the US are still settling after the shutdown and next week. Next week there is September retail sales (which could slow with poor consumer confidence and the shutdown), September home prices, Conference Board consumer confidence (likely to be down) and September producer prices (expected to be higher from tariff impacts).
In New Zealand, the Reserve Bank of New Zealand meet and are expected to cut the overnight cash rate to 2.25%, from 2.50% last month.
Outlook for investment markets
Recent sharemarket falls reflect stretched valuations, risks around US tariffs and the softening US jobs market. But with Trump pivoting towards more market and consumer friendly policies and central banks, including the Fed and RBA, still likely to cut rates further, shares are likely to provide reasonable gains on a 6-12 month horizon.
Bonds are likely to provide returns around running yield or a bit more as central banks continue to cut rates.
Unlisted commercial property returns are likely to improve as office prices have already had sharp falls in response to working from home.
Australian home prices are in an upswing on the back of lower interest rates and more support for first home buyers. But it’s likely to be constrained a bit by poor affordability and indications that the RBA may be at or close to the low on rates.
Cash and bank deposits are expected to provide returns of around 3.5%, but they are likely to slow.
The $A is likely to be buffeted in the near term by the impact of US tariffs but may break higher with the Fed looking like it will cut more than the RBA. Undervaluation should support it on a medium-term view with fair value around $US0.73.
You may also like
-

Weekly market update - 17-07-2026 Following the renewed escalation in the US/Iran conflict, the Strait of Hormuz is effectively closed again with Iran attacking ships and the US attacking Iran and blockading its ports. Both are now back to attacking energy infrastructure which is a signficant & concerning escalation. -

Oliver's insights - Why have Australian living standards “fallen” and how do we fix it? For the last few years there has been much talk of a “cost-of-living” crisis in Australia and of “falling living standards”. This has flared up again lately with the pickup in inflation resulting in a renewed fall in real wages. -

Weekly market update - 10-07-2026 Ceasefire over but markets are also over the war, Why oil prices can't go too low or too high, Is AI adding to inflation risk or taking it away, and Australia’s wage problem.
Important information
Any advice and information is provided by AWM Services Pty Ltd ABN 15 139 353 496, AFSL No. 366121 (AWM Services) and is general in nature. It hasn’t taken your financial or personal circumstances into account. Taxation issues are complex. You should seek professional advice before deciding to act on any information in this article.
It’s important to consider your particular circumstances and read the relevant Product Disclosure Statement, Target Market Determination or Terms and Conditions, available from AMP at amp.com.au, or by calling 131 267, before deciding what’s right for you. The super coaching session is a super health check and is provided by AWM Services and is general advice only. It does not consider your personal circumstances.
You can read our Financial Services Guide online for information about our services, including the fees and other benefits that AMP companies and their representatives may receive in relation to products and services provided to you. You can also ask us for a hardcopy. All information on this website is subject to change without notice. AWM Services is part of the AMP group.