


Weekly market update
Investment markets and key developments
Global shares were mixed over the last week. US shares rose to a new record high as soft jobs data added to expectations for Fed rate cuts and Japanese shares also rose. But Eurozone shares fell slightly not helped by worries about public debt and Chinese shares also fell after a 10% surge in August.
15 min read

Global shares were mixed over the last week. US shares rose to a new record high as soft jobs data added to expectations for Fed rate cuts and despite a dip on Friday rose 0.3% for the week and Japanese shares rose 0.7%. But Eurozone shares fell 0.3% not helped by worries about public debt and Chinese shares also fell 0.8% after a 10% surge in August. The Australian share market fell 1.1% after profit taking kicked in after strong gains in August not helped by a reduction in expected RBA rate cuts following stronger than expected GDP data. Global 10-year bond yields fell in response to weaker US jobs data, despite upwards pressure on very long-term yields for example in the UK. Australian 10 year bond yields rose slightly in response to reduced rate cut expectations. Oil prices fell on reports that OPEC will consider a new boost to production and in response to weak US jobs data. Gold prices rose to a new record high (partly on rising public debt worries) and iron ore prices also rose but metal prices fell slightly. The $A edged up slightly and Bitcoin rose, with the $US flat.
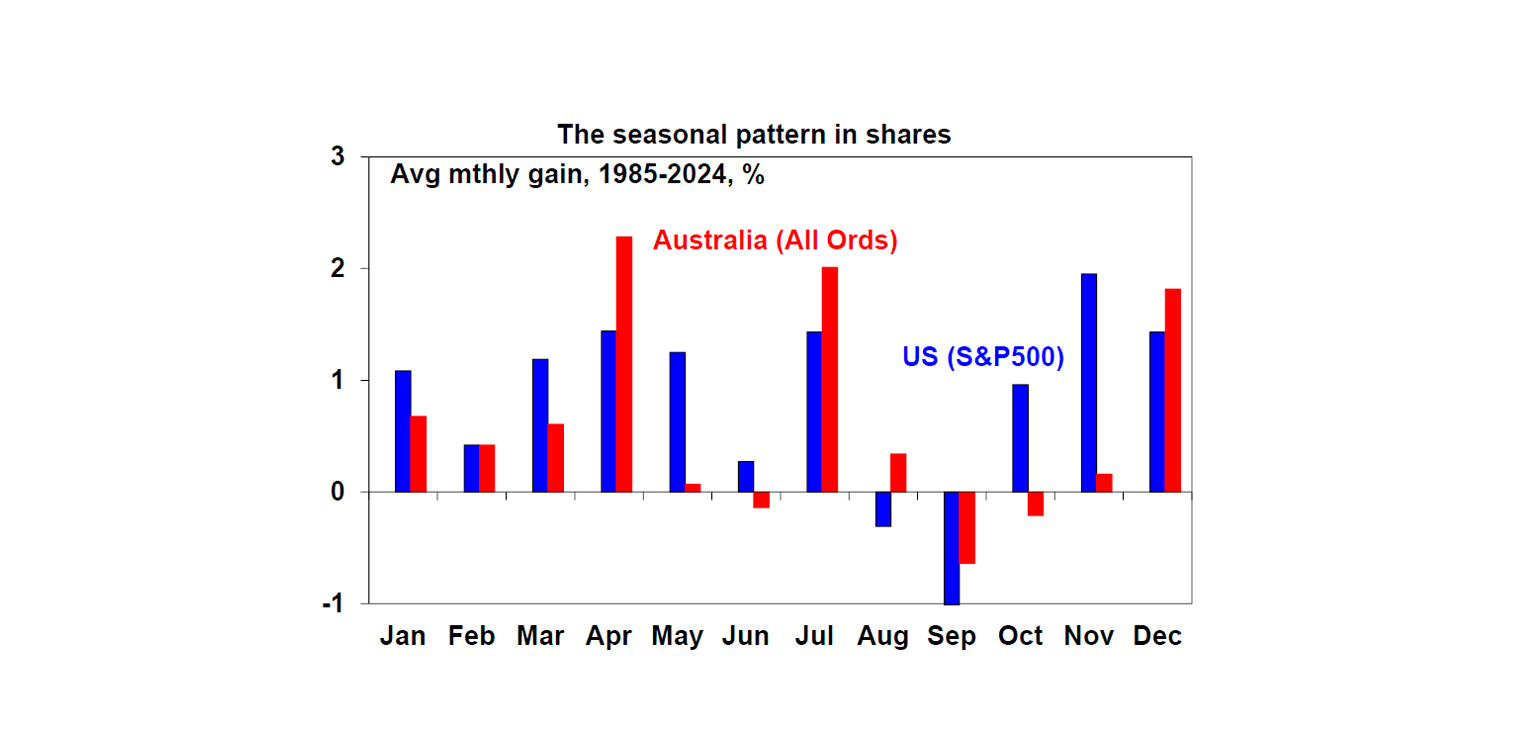
While shares saw another month of strong returns in August helped by okay economic data, prospects for rate cuts and supportive profit results, the near term risk of a correction remains high as: valuations are stretched; rising bond yields and public debt sustainability concerns could put pressure on stretched share market valuations; the tariffs may be starting to show up in weaker US economic data as highlighted by another weak payroll report in the US and higher US inflation giving rise to worries of stagflation; uncertainties remain over the Russia/Ukraine war; there is a high risk of a US Government shutdown in September; and September is on average a seasonally weak month for shares . Beyond the uncertain near-term outlook though, shares should benefit on a 6–12 month view as Trump continues to pivot towards more market friendly policies, the Fed starts cutting rates again and other central banks including the RBA continue to cut.
A new public debt crisis? Concerns about excessive public debt were a big issue in the 2010-2015 period in the aftermath of the GFC and were associated with the Eurozone crisis. Fortunately, that eventually settled down and the Euro survived. However, concerns about unsustainable budget deficit and public debt levels have been resurfacing and putting renewed pressure on global bond yields lately. This is particularly the case in: the UK with the 30 year gilt yield reaching its highest since 1998 with nervousness ahead of the upcoming budget; France where political uncertainty ahead of a confidence vote in the government is adding to fears that its budget deficit will remain unsustainable at around 5.5% of GDP; in Germany where debt is low but fiscal stimulus is on the way; and in Japan where public debt is very high. These concerns may settle down again but run the risk that higher bond yields will force austerity particularly in the UK and France. And in the interim rising bond yields can be a headwind for share markets. The back up in global bond yields is putting some pressure on Australian bond yields but its relatively modest as Australia’s budget deficit is trivial by global standards and our gross level of public debt relative to GDP is less than half the average of comparable countries.
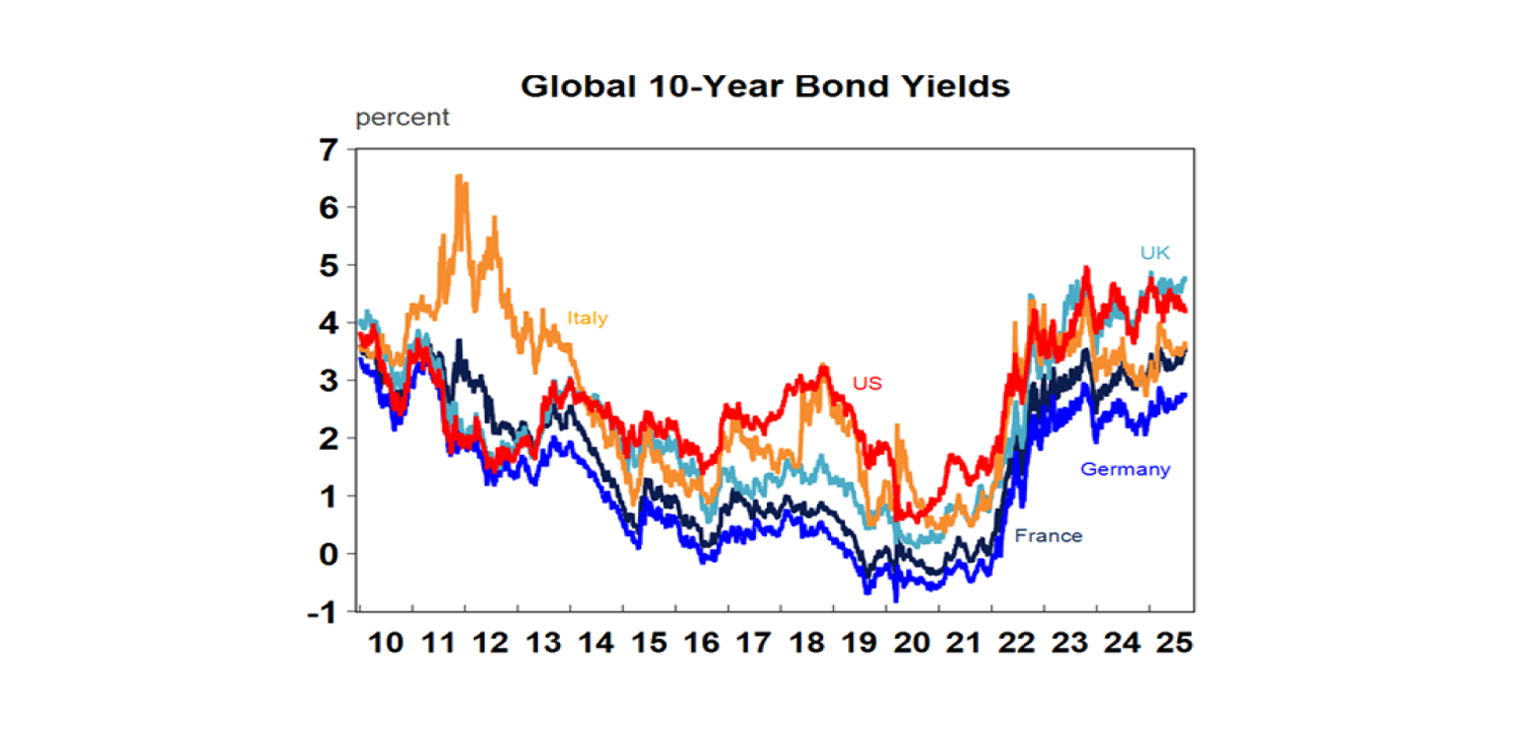
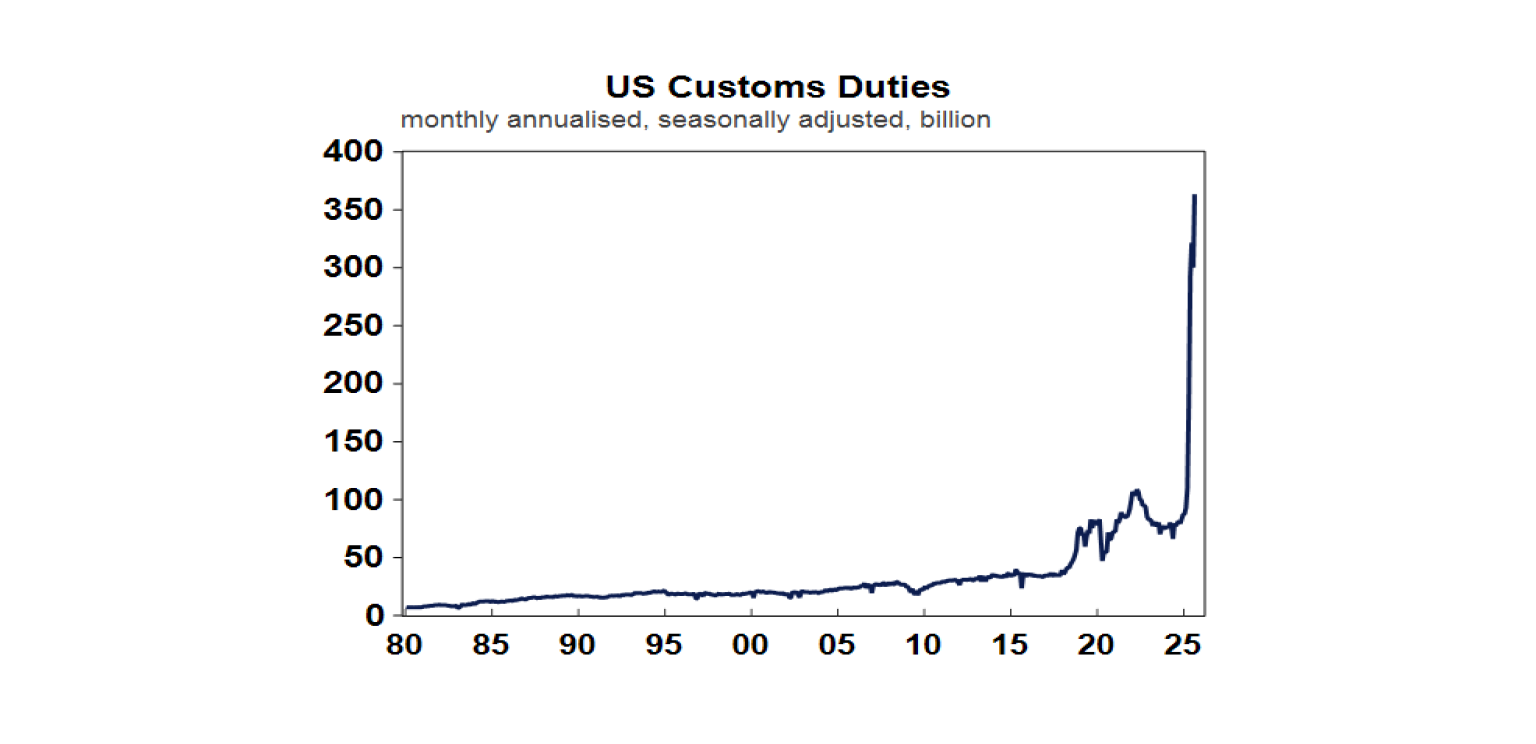
So far, US bond yields have been relatively stable, and actually falling lately on the back of weaker jobs data, but may not be immune to public debt concerns given: the already high level of US public debt; the likely boost to the US budget deficit flowing from tax cuts under the One Big Beautiful Bill particularly if the Supreme Court agrees that the reciprocal tariffs are illegal (as tariff revenue is now running at more than $350bn annualised – see the next chart); increasing threats to Fed independence; ongoing erratic and uncertain policy making; and increasingly whimsical presidential interference in the workings of the US economy (from taking a 10% stake in failing chip maker Intel to sacking the head of Bureau of Labor Statistics). The Trump Administration’s attacks on the free market, US innovation and US institutions along with its addition to public debt is not so far having much short-term impact but poses a longer-term threat to US growth and dynamism and risks showing up in higher US bond yields.
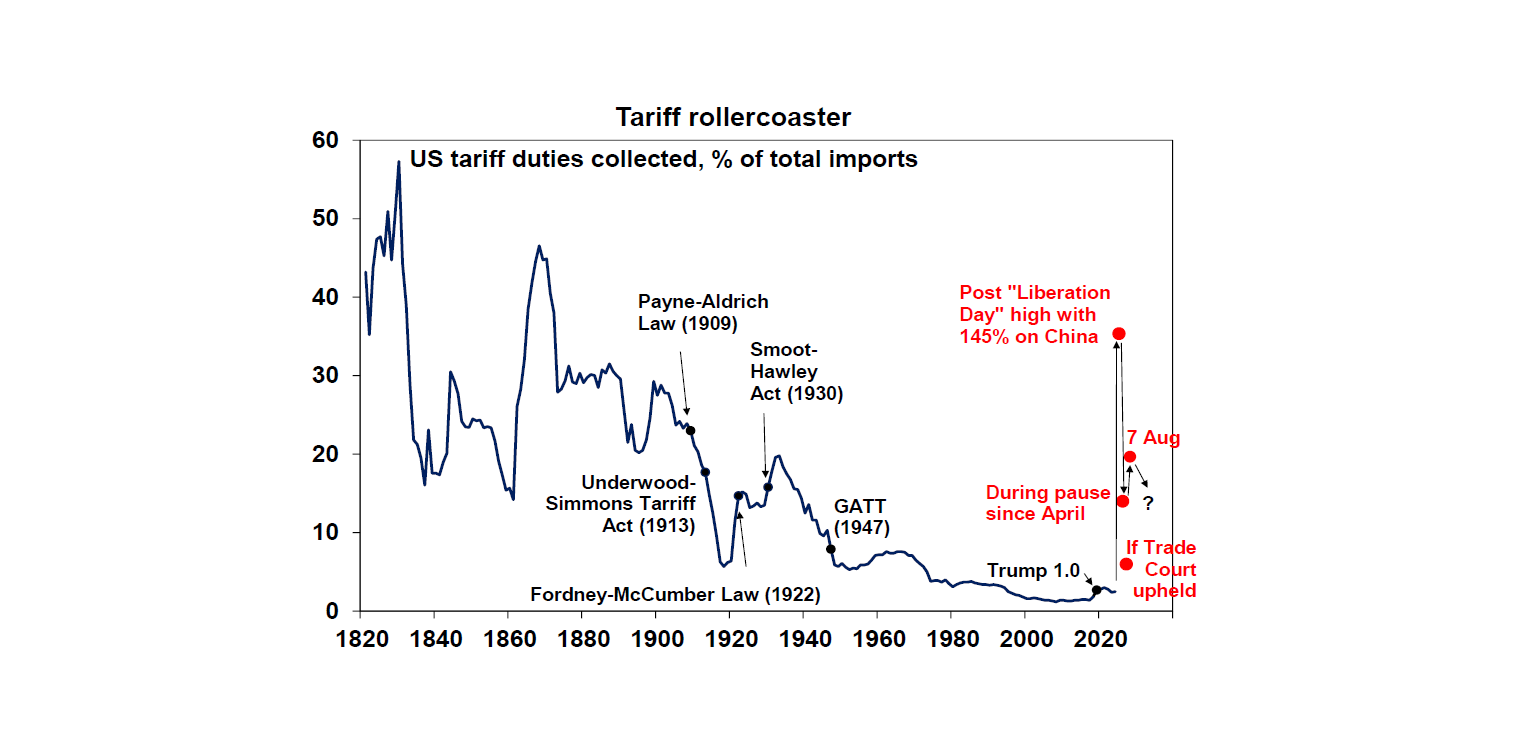
In terms of the tariffs the decision by the US Appeals Court to uphold the Trade Court’s ruling that the reciprocal and fentanyl tariffs were illegal has added to uncertainty over US trade policy again. If the tariffs are struck down then the average US tariff rate will fall back from around 20% now to around 6%, implying good news for US consumers and companies but a big hit to US tax revenue. For now, the tariffs will stay in place pending a decision by the Supreme Court which may not come till early next year. The Supreme Court may choose to side with Trump (as 4 of the 11 Appeals Court judges did) but if they do rule that the tariffs are illegal the Trump Administration can rely on other powers such as Section 122 of the Balance of Payments Act which allows up to a 15% tariff for 150 days before moving to use of the same authority as those used for the sectoral tariffs (Section 232) and the pre-existing tariffs on China (Section 301 of the Trade Act (1974)) which allows tariffs to respond to unfair trade. All of which will have challenges (eg a 10% baseline tariff on countries with which the US has a trade surplus like Australia may be hard to justify legally) and will take time and so lead to more uncertainties, but mean that ultimately the tariffs will likely largely remain. And of course more tariffs might be announced in the week ahead with Trump saying “fairly substantial” chip tariffs will be announced “very shortly”. There are reports that Australian beef could soon face a 36% tariff into the US, but this appears to reflect existing free trade agreement rules that allow for an additional 26% (on top of the 10% baseline) on Australian beef exports to the US once they exceed 499,000 tonnes a year, which is possible as Australian beef has been benefitting relative to beef from other countries as Australia has a lower baseline tariff.
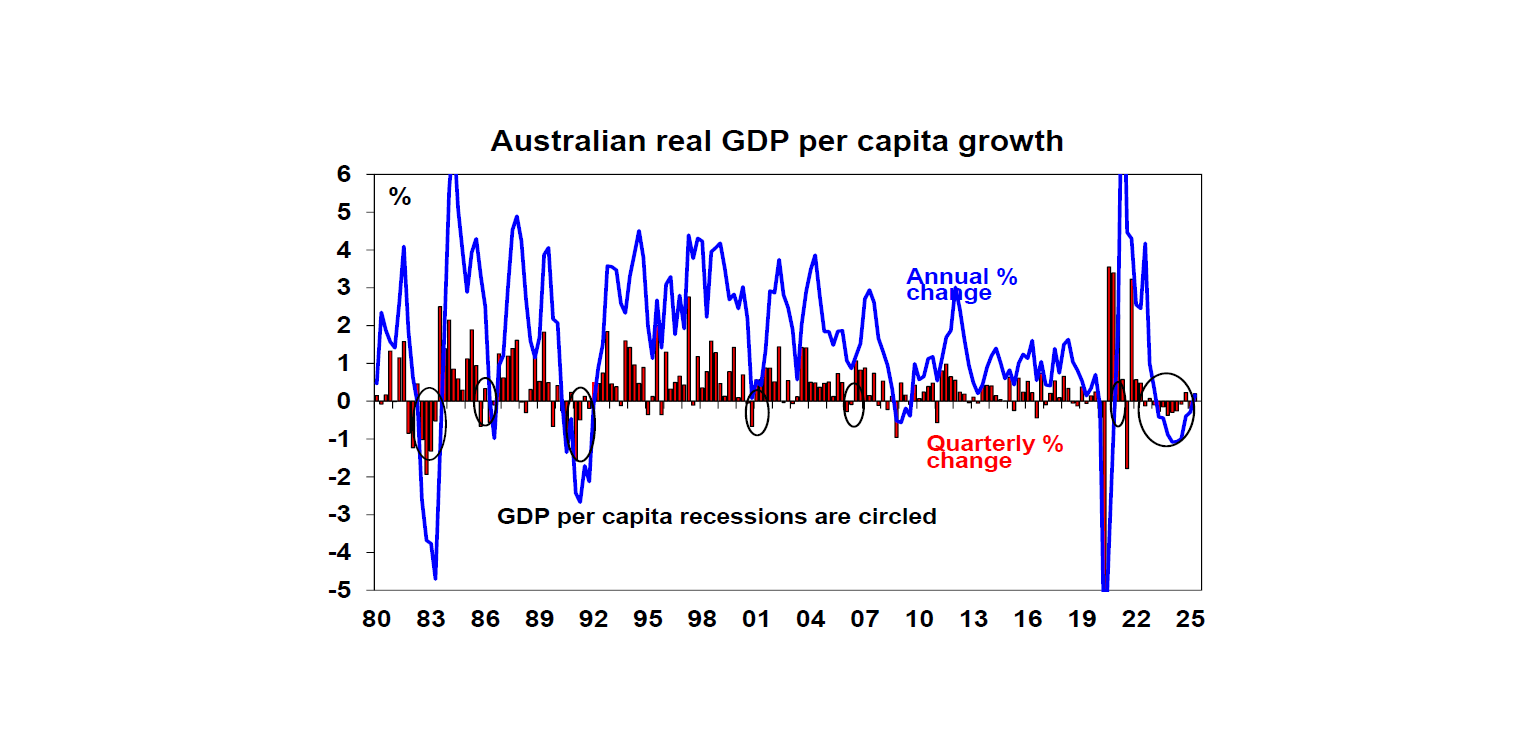
The Australian economy was stronger than expected in the June quarter, but is it really as good as it looks? The good news was that GDP growth came in slightly stronger than expected at 0.6%qoq or 1.8%yoy, consumer spending rose solidly, per capita GDP rose, productivity rose and trade contributed positively to growth. Annual growth is now up from a low of 0.8%yoy in the September quarter and at 1.8%yoy is its fastest since September 2023. This is great news and suggests that rate cuts and tax cuts and some easing in cost-of-living pressures are enabling the economy to begin recovering from a lengthy per capita recession.
However, there are several reasons not to get too excited just yet. First, growth was concentrated in consumer spending which was boosted by the close Easter and ANZAC holidays, EOFY sales, recovery spending after Cyclone Alfred, medical spending relating to a strong flu season and Nintendo Switch. Similarly public consumption was boosted by big defence exercises. So both consumer and public consumption is likely to be softer this quarter. Secondly, investment was weak with capex plans remaining subdued. Third, while growth beat it was only 0.1% stronger than expected on the day of release and was bang in line with what economists were expecting just a few days before.
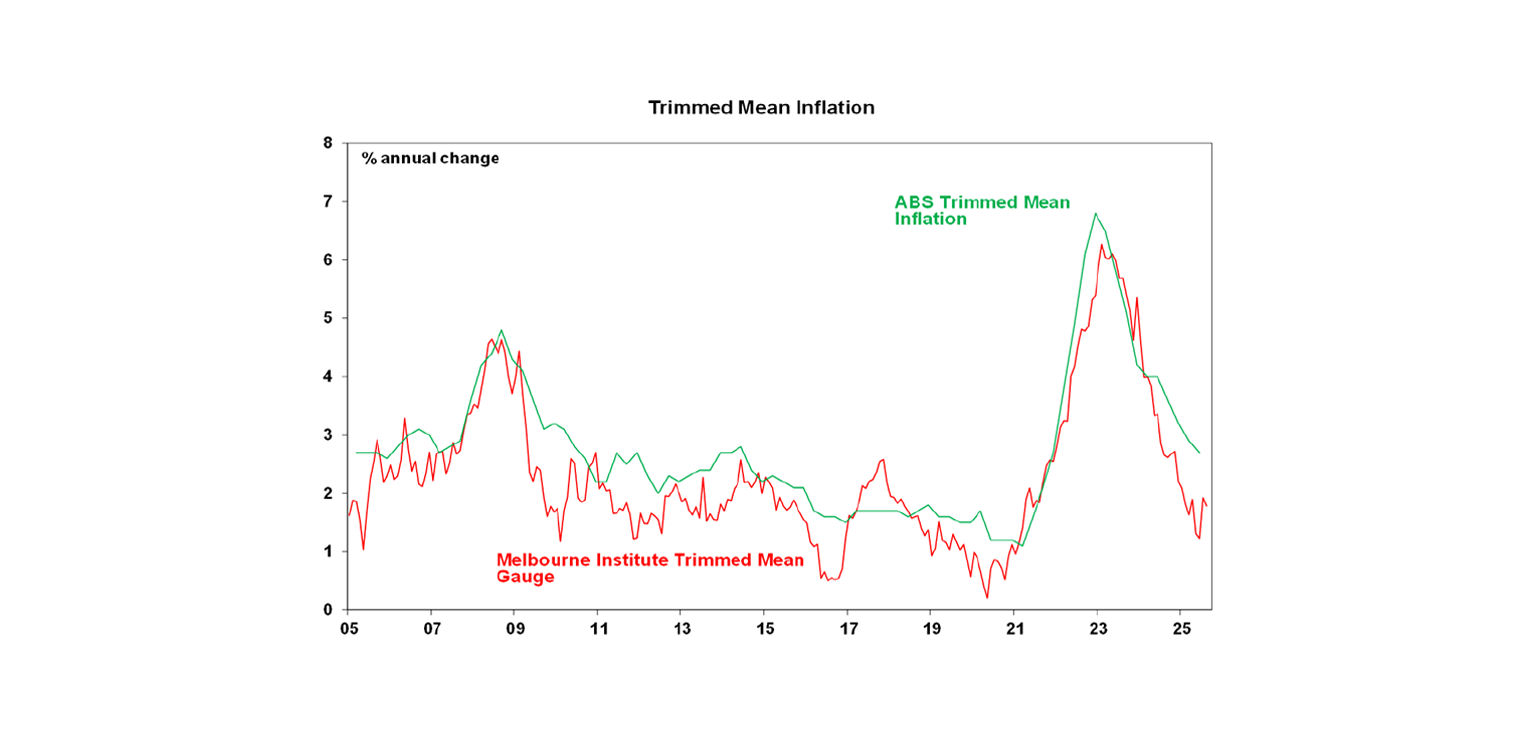
We continue to see several more rate cuts ahead. I would agree with RBA Governor Bullock’s comment in reaction to the GDP and consumer spending beat that “if it keeps going, then there may not be many interest rate declines yet to come”. But it’s likely that consumer spending growth won’t keep going at this pace but will settle back a notch leaving a subdued recovery in place. So while a September rate cut – which we weren’t expecting anyway – is now even less likely we continue see the RBA cutting rates at a quarterly pace with the next cut coming in November and being supported by monetary policy remaining restrictive, growth likely to remain subdued and inflation likely to run around the mid-point of the RBA’s target. In terms of the latter its worth noting that the Melbourne Institute’s Inflation Gauge is continuing to point to a further fall in underlying inflation.
One of the benefits of being on a long flight is you get time to find music performances you otherwise might not come across. And then I get a new tune which drowns out any worries. For some reason I had missed the video of Rod Stewart’s Albert Hall concert where a highlight is his duet with Amy Belle on “I Don’t Want to Talk About It”, who just a few weeks before was busking. Her amazement at where she then found herself is clearly evident.
Major global economic events and implications
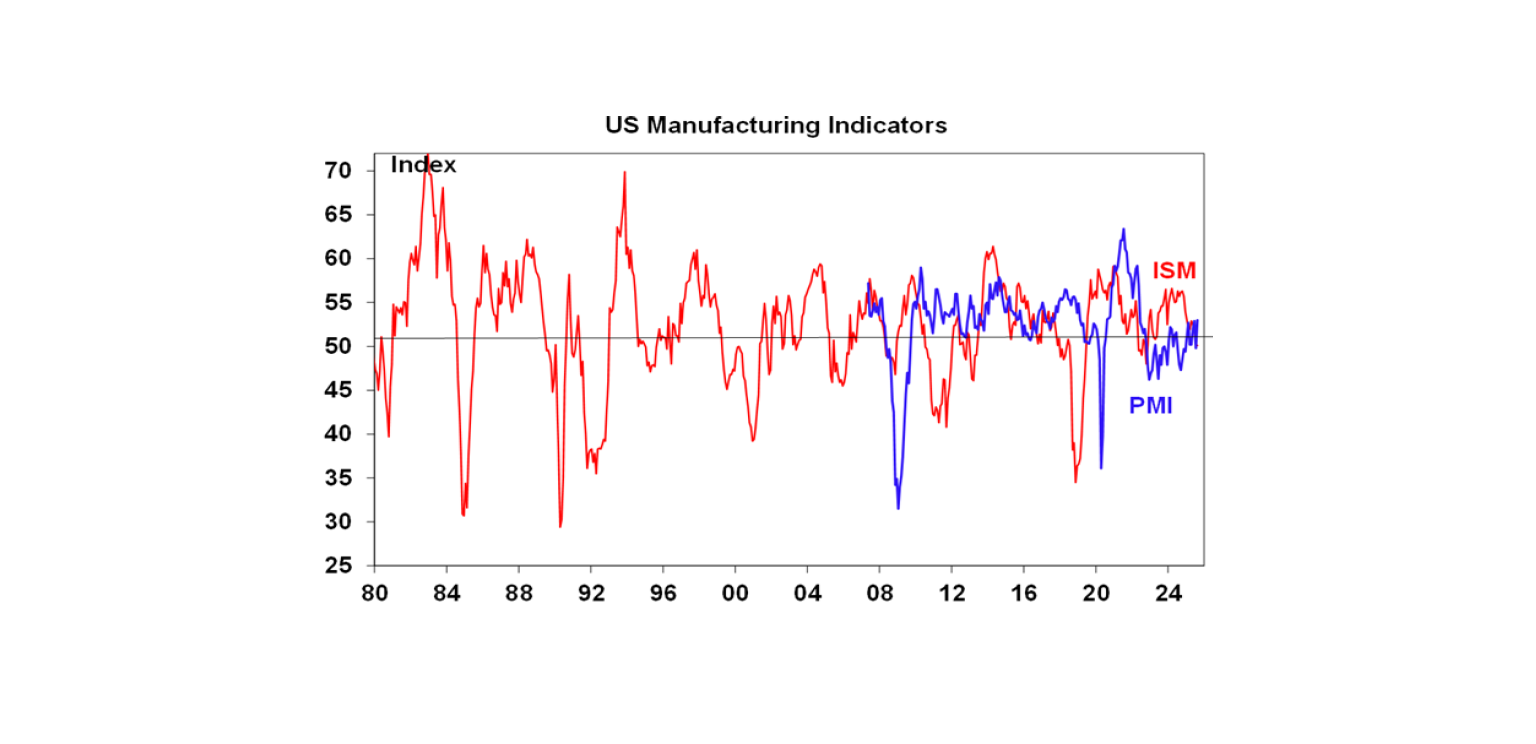
US business conditions indicators were mixed in August with the ISM manufacturing index remaining soft at 48.7 but the services index rising to 52, but with both seeing improved orders but weak employment and high price pressures. The Fed’s Beige book also painted a soft picture with most districts reporting little or no change in economic activity and moderate or modest price growth.
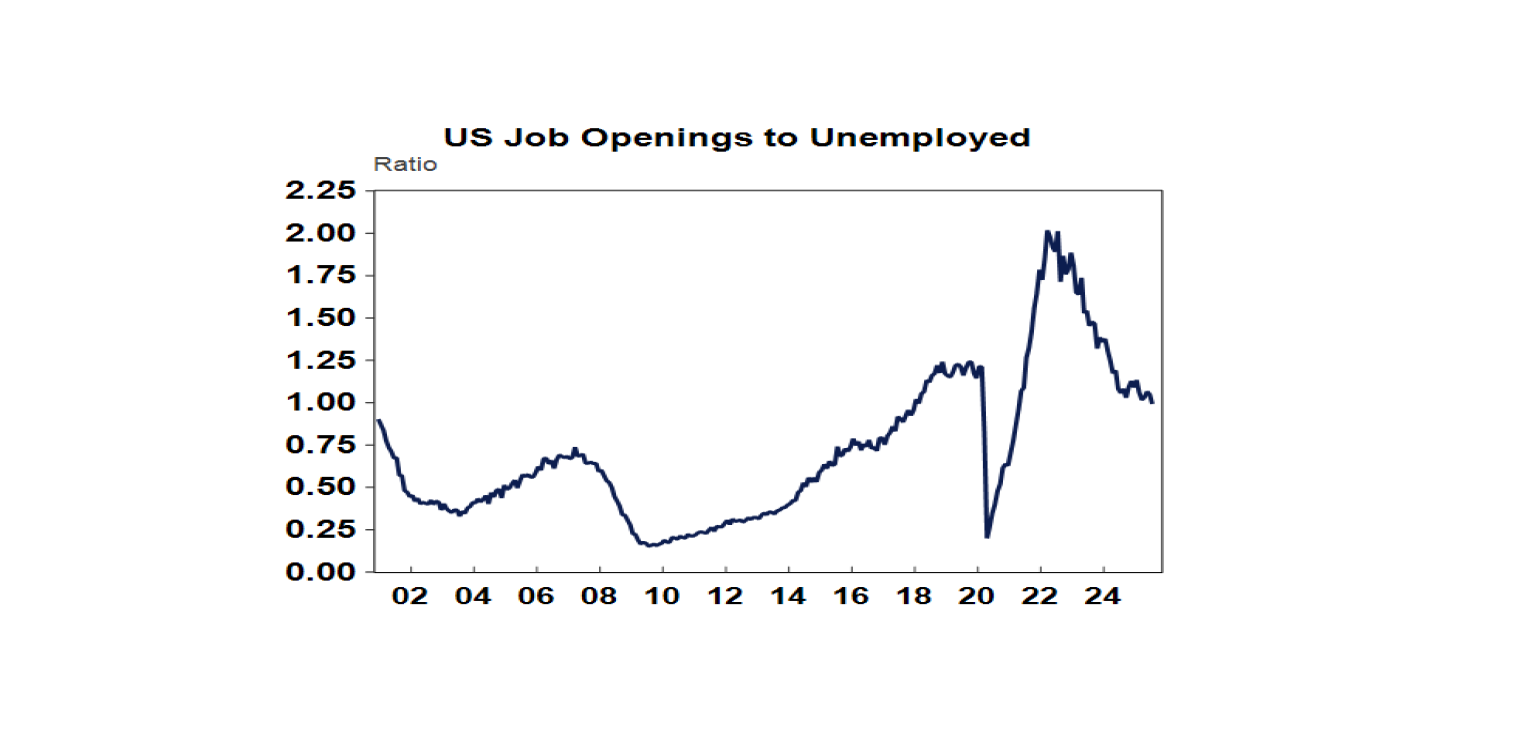
Soft US jobs data has made a September Fed rate cut almost certain. Job openings fell again in July with quits and hiring remaining low. Initial jobless claims rose slightly but continuing claims continue to trace out a rising trend. And the weakness in the labour market was confirmed by yet another weak payroll report for August with only 22,000 new payrolls and a further downwards revision to prior months with unemployment rising to 4.3%. The disruption caused by Trump’s tariffs is now clearly starting to show up in a weaker jobs data, although Trump will of course blame the Fed and everybody else.
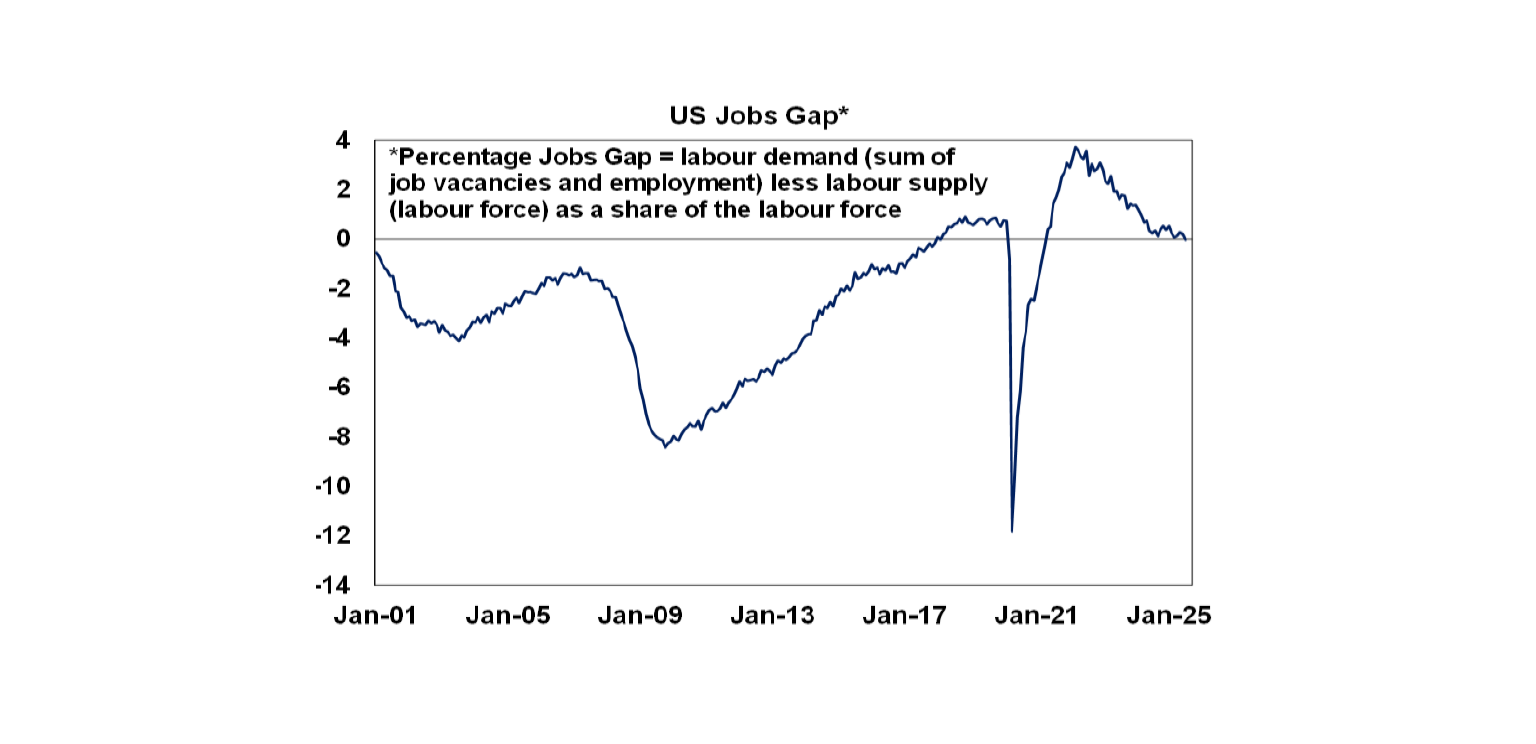
The US labour market has come back into balance, but is now at high risk of going beyond that into much higher unemployment. The fall in job openings and slowing employment growth has bought labour demand back into line with supply (based on the labour force) implying that the labour market is now back in balance after seeing a positive jobs gap (ie a very tight labour market) since 2022. With job openings continuing to fall the risk is that this flips over into a negative jobs gap or weak labour market with rising unemployment. This in turn highlights the risks have shifted to the full employment side of the Fed’s mandate, particularly if the tariffs have just a temporary impact on inflation. So it supports the case for a 0.25% rate cut this month, which the US money market is now fully pricing in with some chance of a 0.5% cut, with another four of five 0.25% cuts over the next year.
Canadian employment also fell sharply in August with unemployment rising to 7.1%. The money market is now pricing in a 90% chance of another BoC rate cut this month.
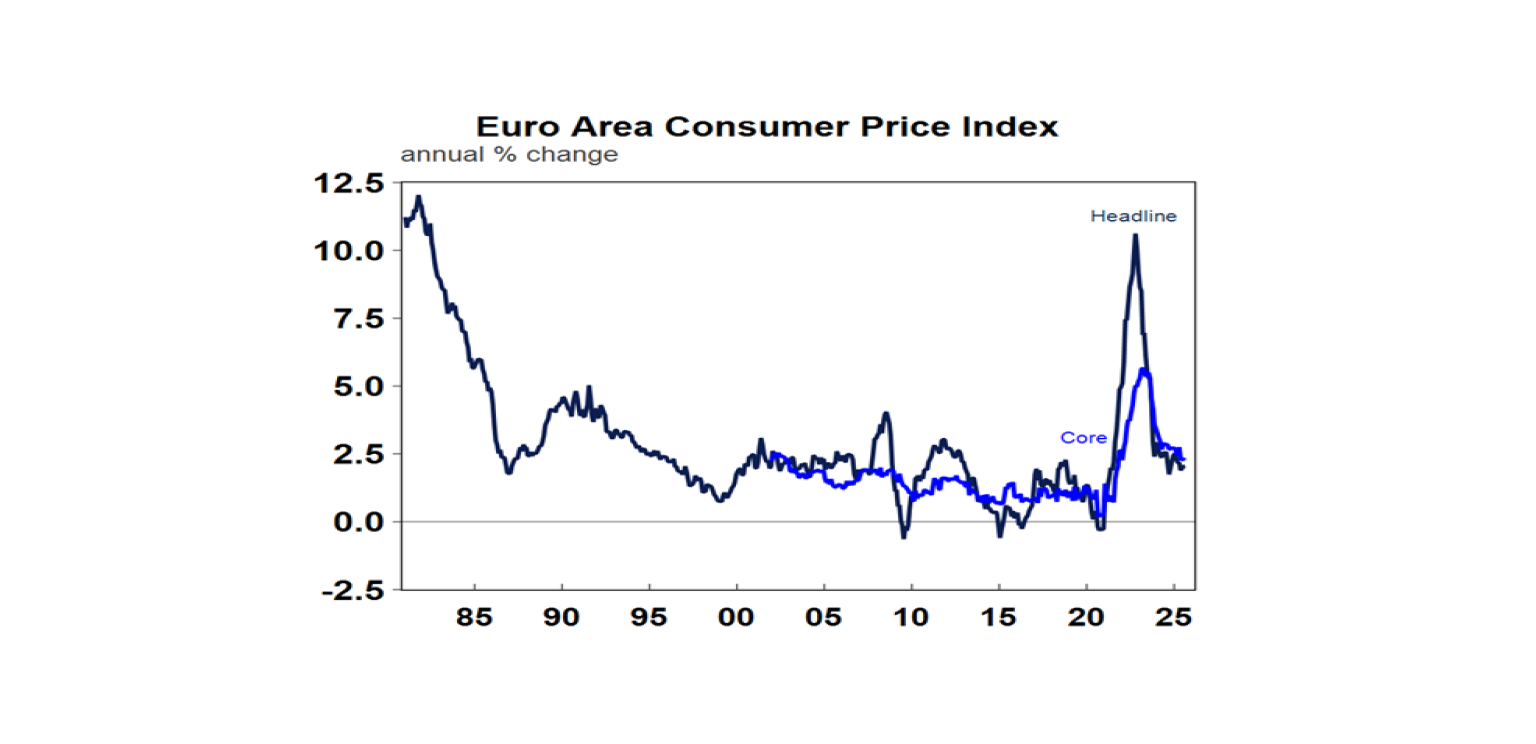
Eurozone consumer prices inflation rose slightly to 2.1%yoy in July, with core unchanged at 2.3%yoy. Both are around the ECB’s 2% inflation target and don’t impart any urgency for the ECB to cut rates in the week ahead. Meanwhile, unemployment was unchanged at 6.2% in July.
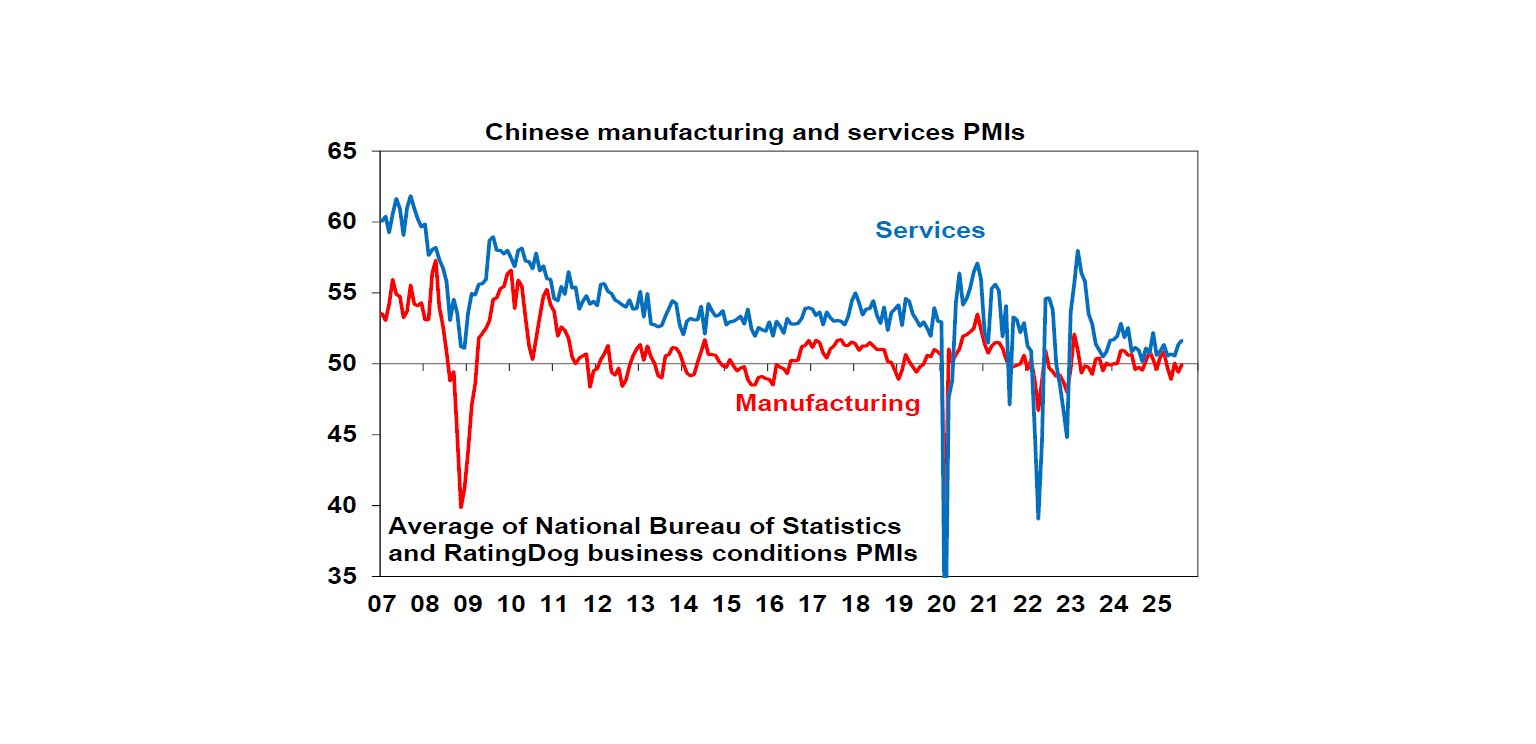
Chinese business conditions PMIs improved in August, with services stronger than manufacturing. Overall, they remain consistent with growth around or just below 5%.
Australian economic events and implications
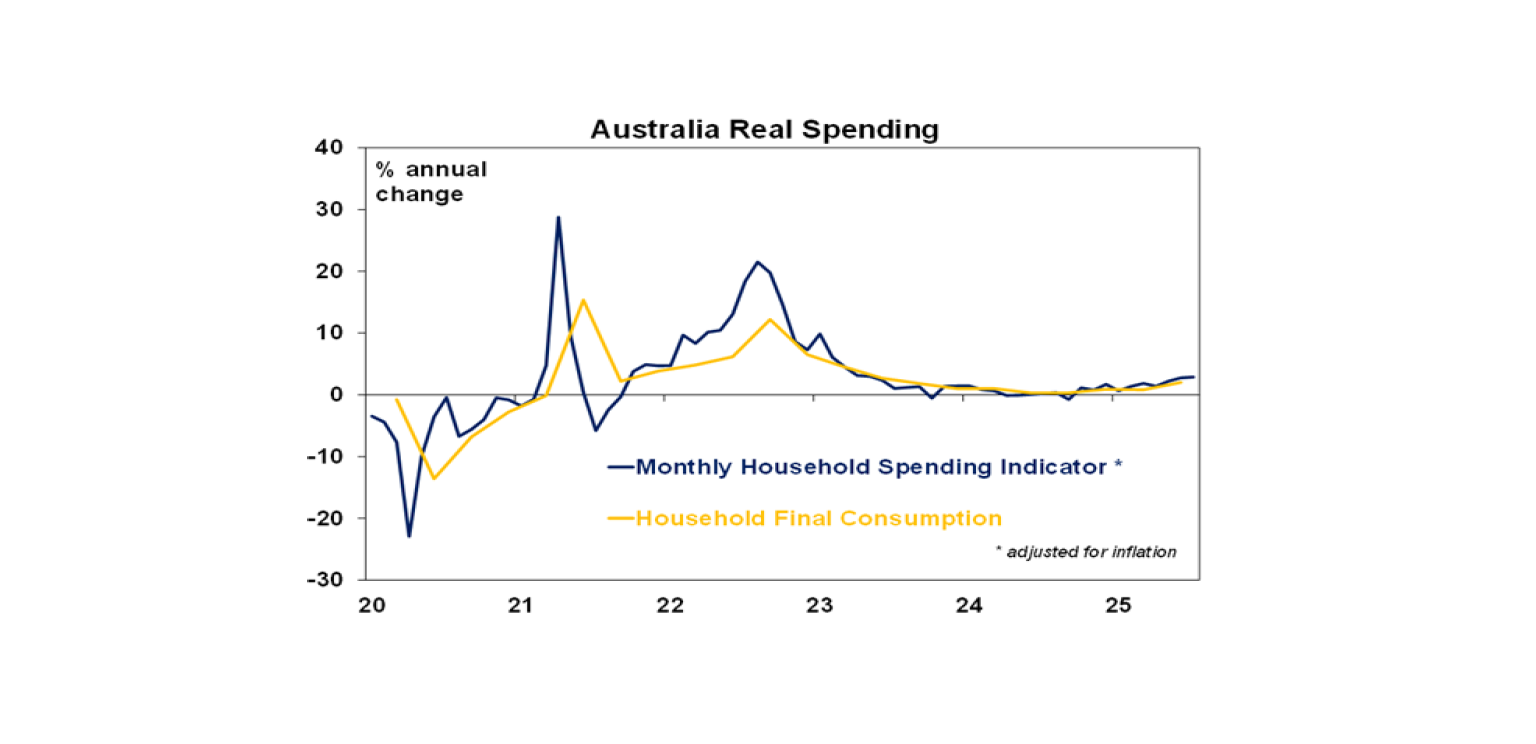
Apart from a slump in building approvals most of the Australian data released over the last week provided good news. Household spending rose a solid 0.5%mom in July leaving it up 5.1%yoy consistent with an ongoing recovery in consumer spending on the back of rate cuts, tax cuts and real wage growth. However, growth was concentrated in services (spending on hotels, travel and dining out which may have been boosted by school holidays and health on the back of the bad flu season) so some payback may be seen in August. The nominal rise in July was likely also exaggerated by the rebound inflation seen in July.
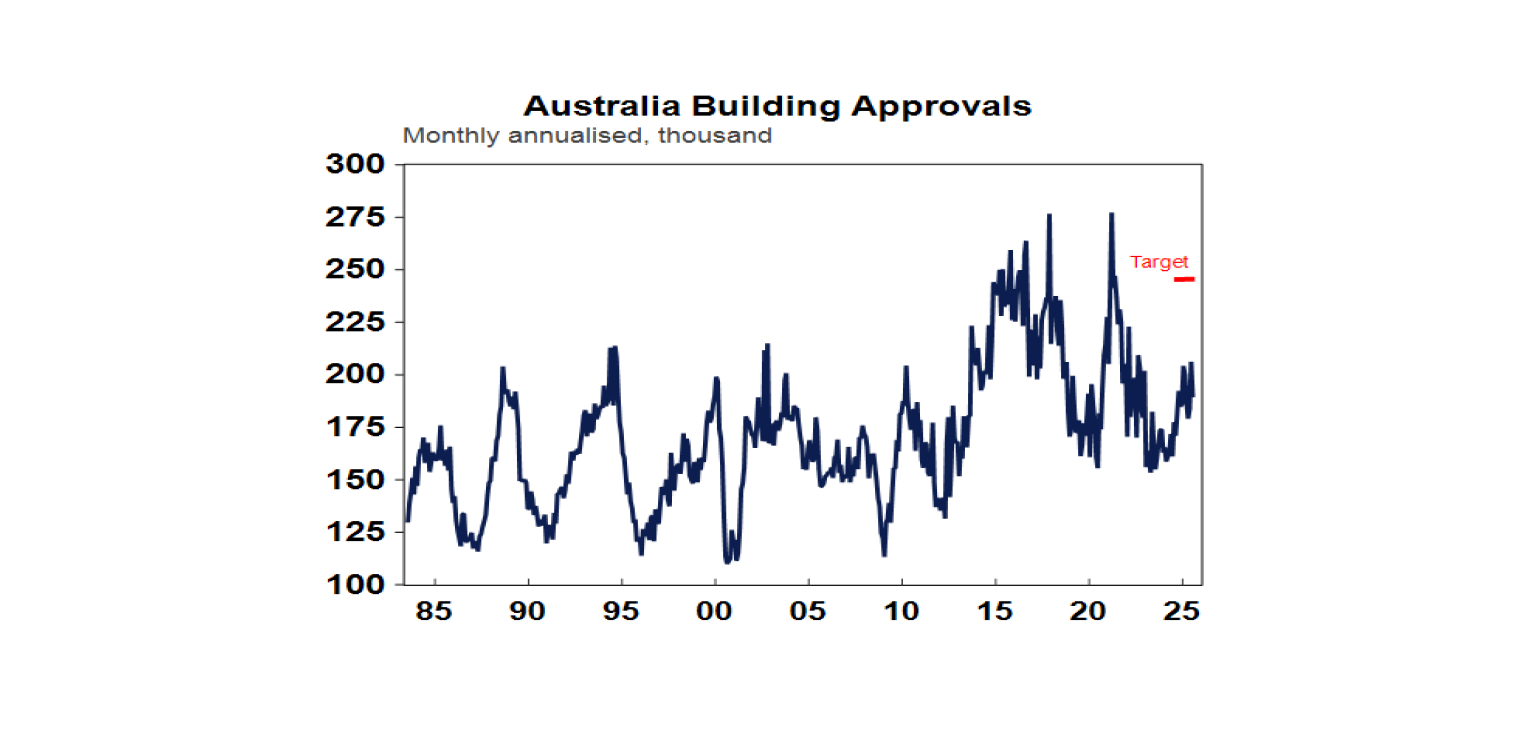
Home building approvals are continuing to run well below target. They fell 8% in July following a 12% rise in June driven by volatile unit approvals. The trend remains up though and at around an annual rate of 194,000 is running around the level of underlying population driven demand for housing. But this is well below the 240,000 per annum level needed to meet the Housing Accord target of 1.2 million new homes over five years, which in turn is necessary to start reducing the 200,000 to 300,000 accumulated shortfall of housing in Australia. If we are to meet the target we need to urgently switch to more units and modular homes in the mix.
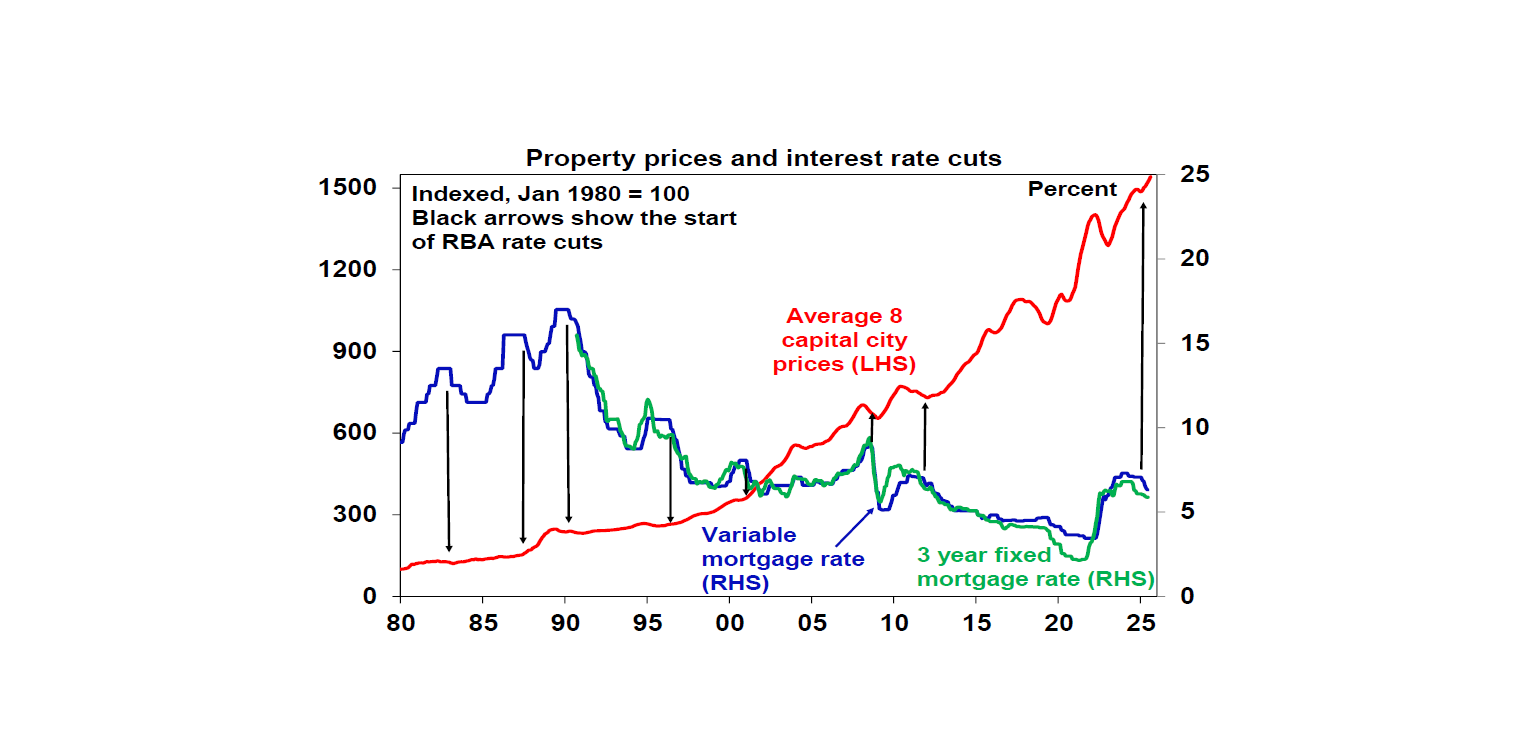
Reflecting the combination of falling interest rates, rising real wages, improved consumer confidence and the shortage of housing, home price growth accelerated in August. While poor affordability will act as a constraint, we now expect average prices to rise 7% this year, accelerating to 8-10 next year on the back of rate cuts and the ramp up government support for home buyers, notably with the bring forward of the expanded low deposit scheme.
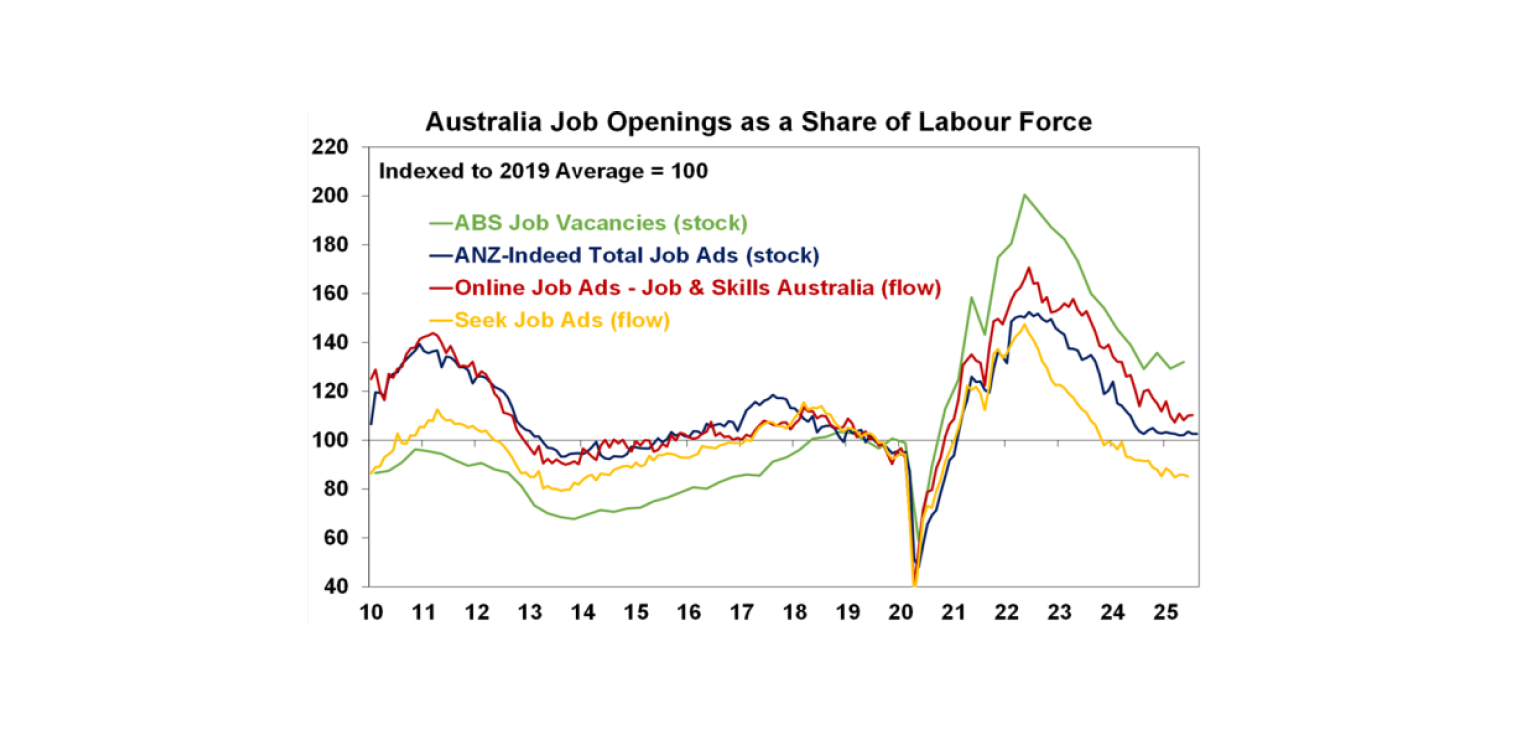
Job ads are well down from their highs but are sending mixed signals, with Seek and ANZ job ads on the soft side.
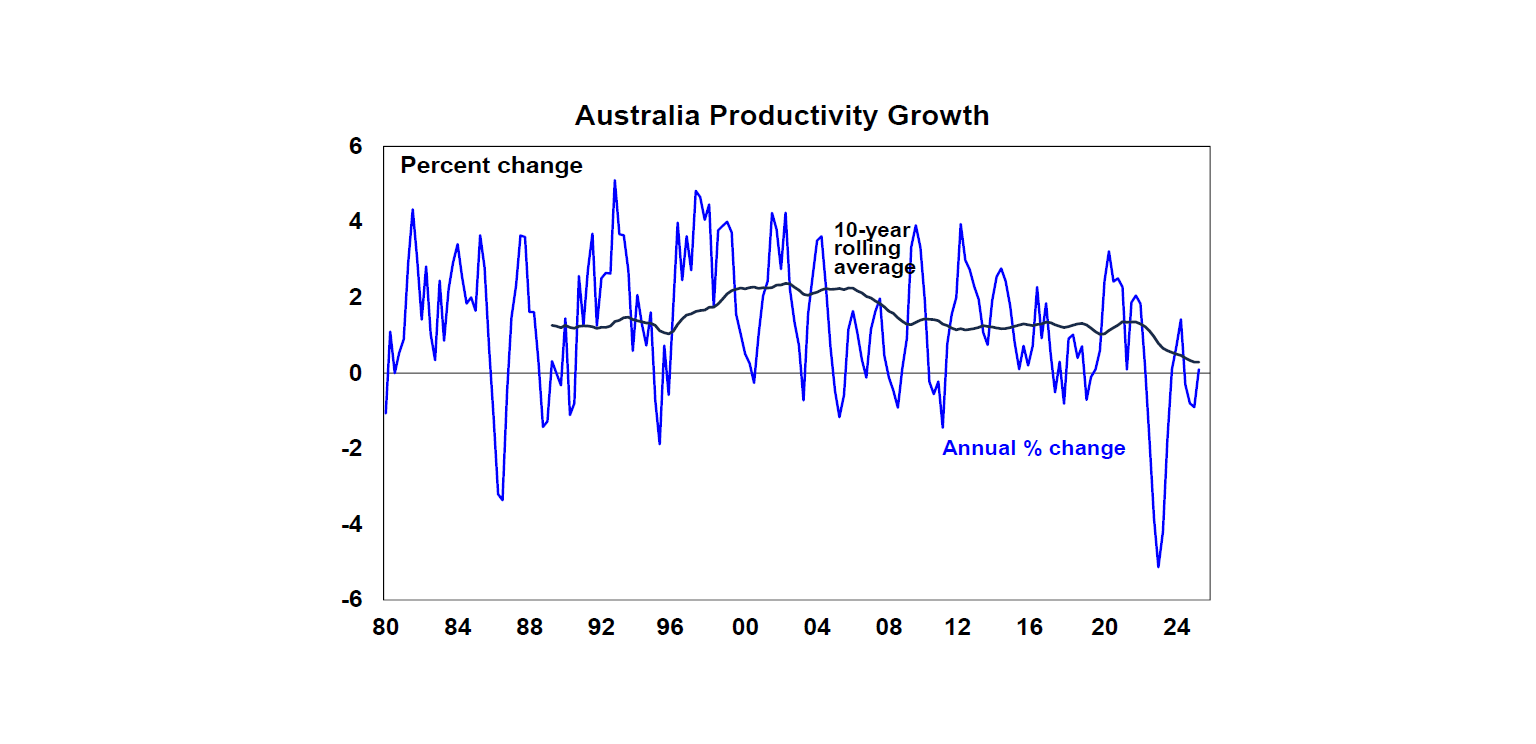
As noted earlier some good news in the June quarter GDP data was a bounce in productivity growth, but as can be seen in the next chart it remains very weak, hence the need for lots of productivity enhancing reforms.
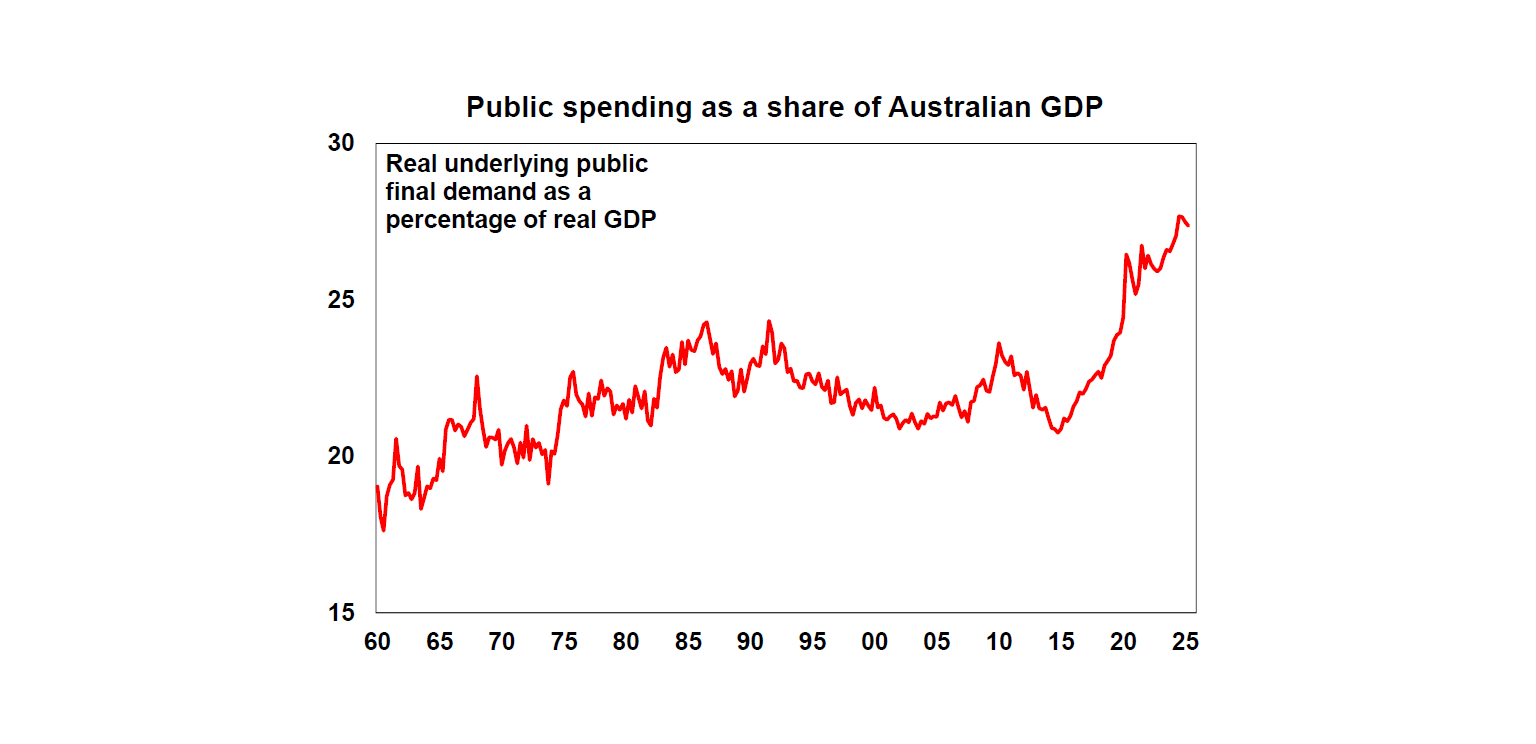
One thing to do to help boost productivity would be to cut public spending back to more in line with its pre-pandemic levels as the public sector is less productive than the private sector. Unfortunately, this did not appear to be anywhere on the list of actions post the recent Economic Reform Roundtable (or productivity summit). Building a better tax system was on the longer-term action list and its good to see reports that the Government is reviewing the $3m super tax plan – injecting another tax that is not indexed and based on unrealised gains into the tax system would not be consistent with building a better tax system.
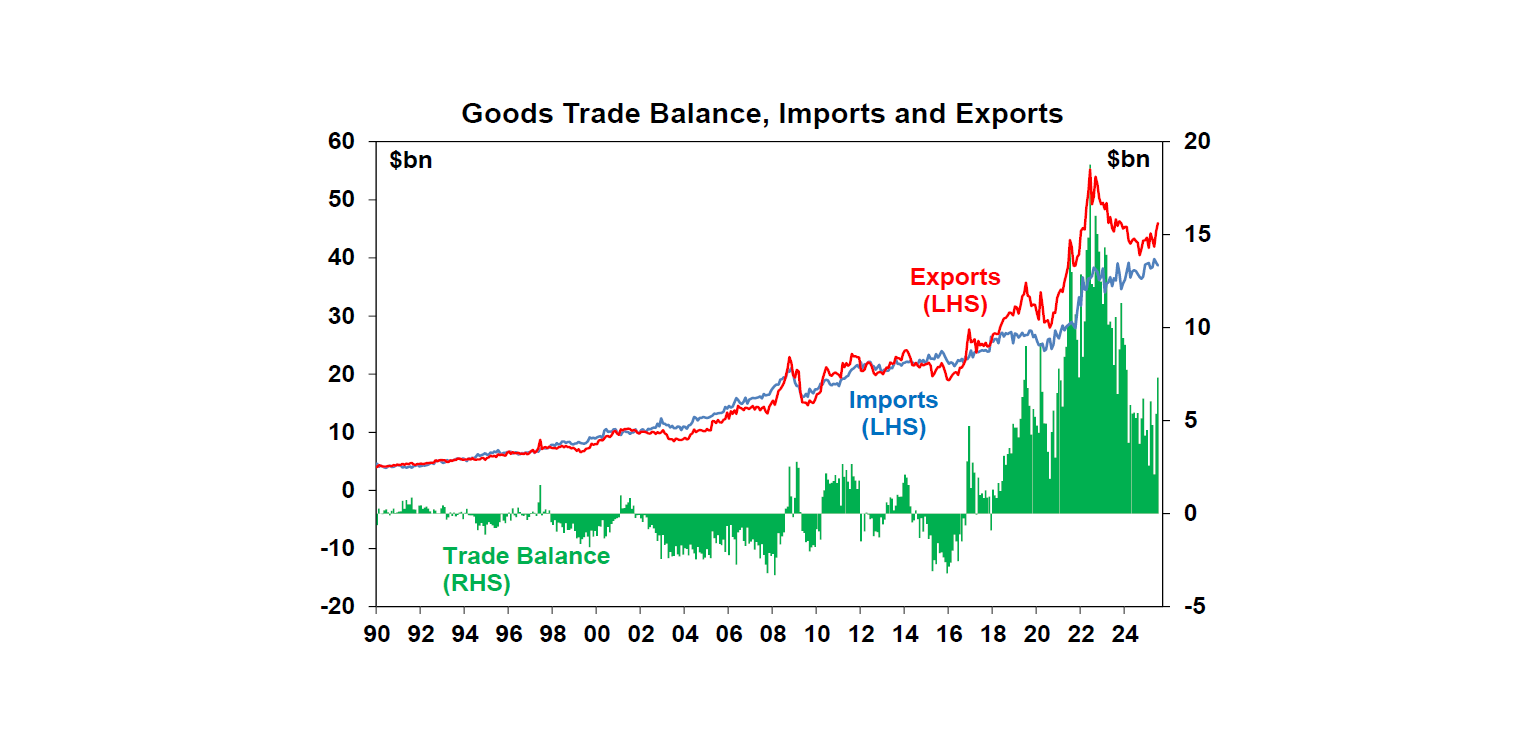
The trade surplus rose more than expected to $7.3bn in July as exports surged 3.3%mom and imports fell 1.3%mom.
The Melbourne Institute’s Inflation Gauge softened in August and still points to lower underlying inflation.
What to watch over the week ahead?
In the US, the focus will be back on inflation with August CPI data (Thursday) is expected to show a rise to 2.9%yoy (from 2.7%), with core inflation remaining at 0.3%mom or 3.1%yoy as tariffs are continued to be passed through to consumers. August small business optimism will be released Tuesday.
The ECB (Thursday) is expected to leave its key deposit rate on hold at 2%, having already cut rates substantially and with inflation continuing to run around its target. Another rate cut is still likely in the next 6 months though.
Chinese trade data for August (Monday) is expected to show a slowing in export growth to around 5.5%yoy, but a slight pick up in import growth to 4.4%yoy.
In Australia, the Westpac/MI consumer confidence survey and the NAB business survey (Tuesday) will be watched for signs of further gains on the back of RBA rate cuts.
Outlook for investment markets
Share markets are at risk of a correction through given stretched valuations, risks around US tariffs and the softening US jobs market. But with Trump pivoting towards more market friendly policies and central banks, including the Fed and RBA, likely to cut rates further, shares are likely to provide reasonable gains on a 6-12 month horizon.
Bonds are likely to provide returns around running yield or a bit more, as central banks cut rates.
Unlisted commercial property returns are likely to improve as office prices have already had sharp falls in response to working from home.
Australian home prices have started an upswing on the back of lower interest rates. But it’s likely to be modest initially with poor affordability and only gradual rate cuts constraining buyers. We see home prices rising around 7% this year, and 8-10% next year.
Cash and bank deposits are expected to provide returns of around 3.5%, but they are likely to slow.
The $A is likely to be buffeted in the near term between the negative global impact of US tariffs and the potential positive of a further fall in the overvalued US dollar. Undervaluation should support it on a medium-term view with fair value around $US0.73.
You may also like
-

Oliver's insights - Why have Australian living standards “fallen” and how do we fix it? For the last few years there has been much talk of a “cost-of-living” crisis in Australia and of “falling living standards”. This has flared up again lately with the pickup in inflation resulting in a renewed fall in real wages. -

Weekly market update - 10-07-2026 Ceasefire over but markets are also over the war, Why oil prices can't go too low or too high, Is AI adding to inflation risk or taking it away, and Australia’s wage problem. -

How to protect yourself from phishing and impersonation scams Phishing scams can look like everyday messages – emails, texts or calls. Learn the signs and simple steps to protect your money and personal information.
Important information
Any advice and information is provided by AWM Services Pty Ltd ABN 15 139 353 496, AFSL No. 366121 (AWM Services) and is general in nature. It hasn’t taken your financial or personal circumstances into account. Taxation issues are complex. You should seek professional advice before deciding to act on any information in this article.
It’s important to consider your particular circumstances and read the relevant Product Disclosure Statement, Target Market Determination or Terms and Conditions, available from AMP at amp.com.au, or by calling 131 267, before deciding what’s right for you. The super coaching session is a super health check and is provided by AWM Services and is general advice only. It does not consider your personal circumstances.
You can read our Financial Services Guide online for information about our services, including the fees and other benefits that AMP companies and their representatives may receive in relation to products and services provided to you. You can also ask us for a hardcopy. All information on this website is subject to change without notice. AWM Services is part of the AMP group.