


Weekly market update
Investment markets and key developments
Global share markets fell over the last week not helped by concerns about the impact of US tariffs on economic growth, despite various deals being reached.
10 min read

Global share markets fell over the last week on the back of concerns about the impact of US tariffs on economic growth and weak US jobs data. US shares fell sharply on Friday after jobs data showed that payroll growth is close to stalling leaving them down 2.4% for the week. Eurozone shares lost 3%, Japanese shares fell 1.6% and Chinese shares fell 1.8%. Australian shares fell on Friday in response to Trump’s latest tariff announcements leaving them down 0.1% for the week with gains in consumer discretionary, financial and industrial shares but tariff driven falls in resources shares. Bond yields fell. Oil prices rose on fears that US secondary sanctions (tariffs) on countries buying Russian oil could impact global oil supplies. Iron ore and gold prices also rose but metal prices fell. The $A and Bitcoin fell as the $US rose for the week.
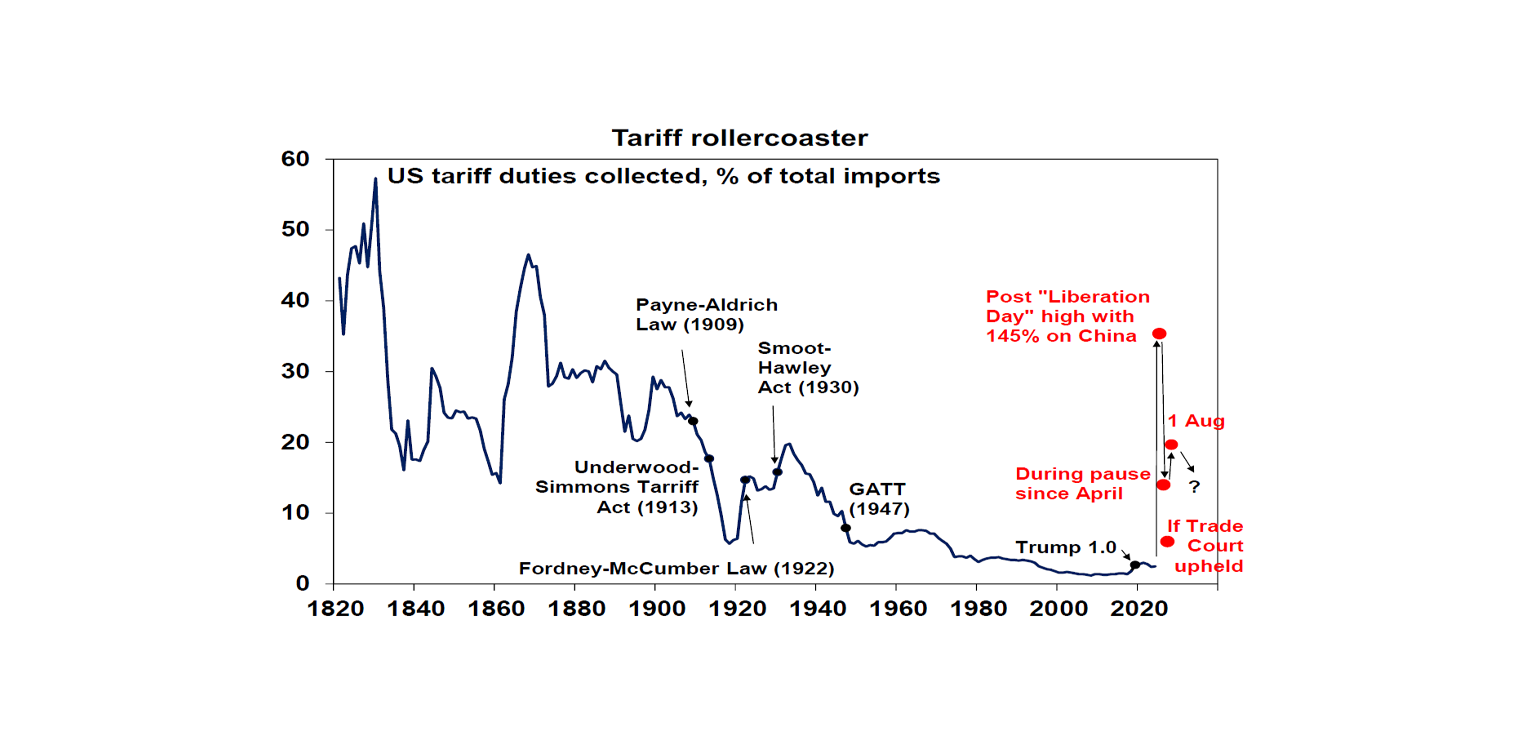
The past week saw Tariff Man Trump again flooding the zone with daily tariff announcements, that are next to impossible to keep up with, ahead of his (latest) 1st August deadline but now to apply from 7 August. It wasn’t all bad news with trade deals with the EU and South Korea (both with 15% tariffs) coming after previously announced deals serving to reduce uncertainty, tariff rates in these deals coming in less than announced on Liberation Day and the baseline tariff of 10% maintained for countries with which the US has a trade surplus, including Australia. However:
countries without deals have seen tariffs imposed on them ranging from 15% to 50% (Brazil);
the deals that have been agreed lack detail and look grossly lopsided with countries facing 15% plus tariffs on their goods in the US, but goods from the US seeing around zero tariffs;
and they come with silly agreements to invest in the US – eg $750bn from the EU – which can likely never be fulfilled;
US/China trade tensions could flare up again if the current truce is not extended beyond its expiry on 12th August; and
most importantly the latest set of country and sector tariff rates still imply a rise in the average US import tariff rate to around 20%, from 15% through the pause since April, which is way up from up from 2-3% at the start of the year resulting in higher prices (taxes) for US consumers and businesses and a disruption to the US economy (like Brexit did to the UK) and a hit to non-US exporters posing risks to global growth.
So, while things aren’t as bad as threatened on Liberation Day, the surge in US tariffs still poses a significant threat to the global economy which will likely become more evident in the months ahead. Ultimately, a combination of more trade deals for those countries without deals (some of which may come ahead of the 7 August start up) and Trump being forced to back down in the face of market volatility and or the economic impact are likely to see the tariffs settle around 15%, but this may take a while.
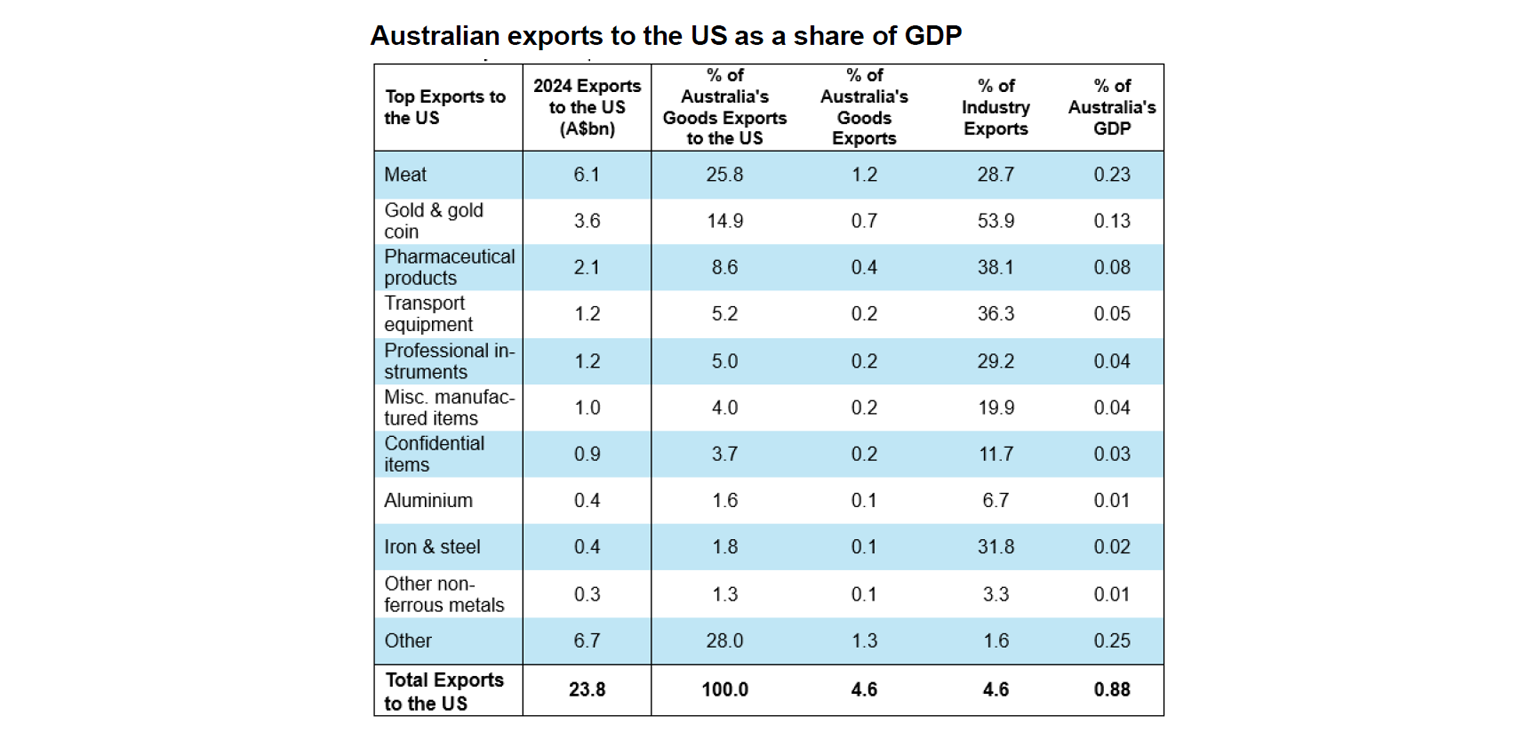
For Australia, confirmation that the general tariff stays at 10% isa relief. But its still up from 2% or less at the start of the year and aluminium, steel and likely pharmaceuticals are still to be tariffed at higher rates. While this remains bad for industries affected, we remain of the view that the overall direct macroeconomic impact will be minor because our exports to the US are a very small share of our total goods exports (less than 5%).Rather the main threat continues to come via the hit to globaltrade from the tariffs resulting in slower global growth and hence weaker demand for our exports generally. So, while worst case US trade war scenarios have been averted for now the drag from US tariffs still adds to the case for more RBA rate cuts.
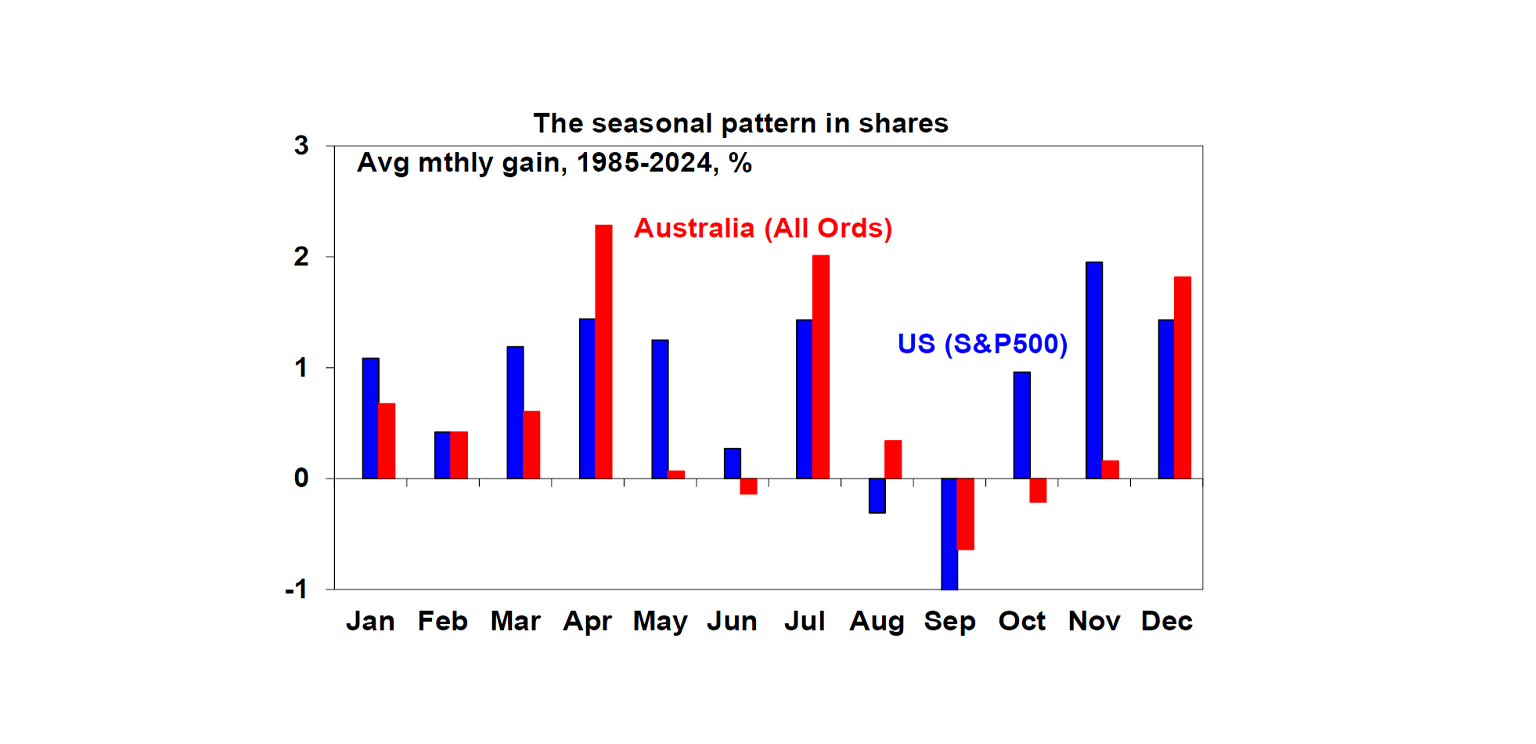
Shares had a strong July with US shares up 2.2%, global shares up 2% and Australian shares up 2.3%. This has left valuations stretched and a lot of good news has been factored in which leaves markets vulnerable over the seasonally weaker months of August and September. And there is a long worry list that could trigger volatility: around US tariffs and their impact; Trump’s threat to impose 100% tariffs on countries like China that import from Russia from 7th August if Russia does not make progress towards a ceasefire with Ukraine which could lead to a surge in oil prices and new trade wars; the threat to Fed independence with the early departure of a Fed Governor providing an opportunity for Trump to appoint a shadow Fed Chair as he again called for Powell to resign; the high risk of a US Government shutdown in September; and the risk of rising bond yields due to debt worries in the US and Japan. Beyond the messy near-term outlook though, shares should benefit on a 6-12 month view as Trump continues to pivot towards more market friendly policies, the Fed starts cutting rates again and other central banks including the RBA continue to cut.
In Australia, the latest inflation data confirms that inflation is continuing to fall. For the June quarter it was good on all fronts:both the headline CPI at 2.1%yoy and the underlying trimmed mean at 2.7%yoy are within the RBA’s target range; both are at their lowest since 2021; annualised trimmed mean inflation was 2.4% in the June quarter and 2.6% over the last six months;services inflation fell to its lowest in three years; more than 50% of CPI basket items now have annualised inflation less than 2%; and the Monthly CPI for June fell to 1.9%yoy with the trimmed mean alling to 2.1%yoy indicating that momentum remains down.
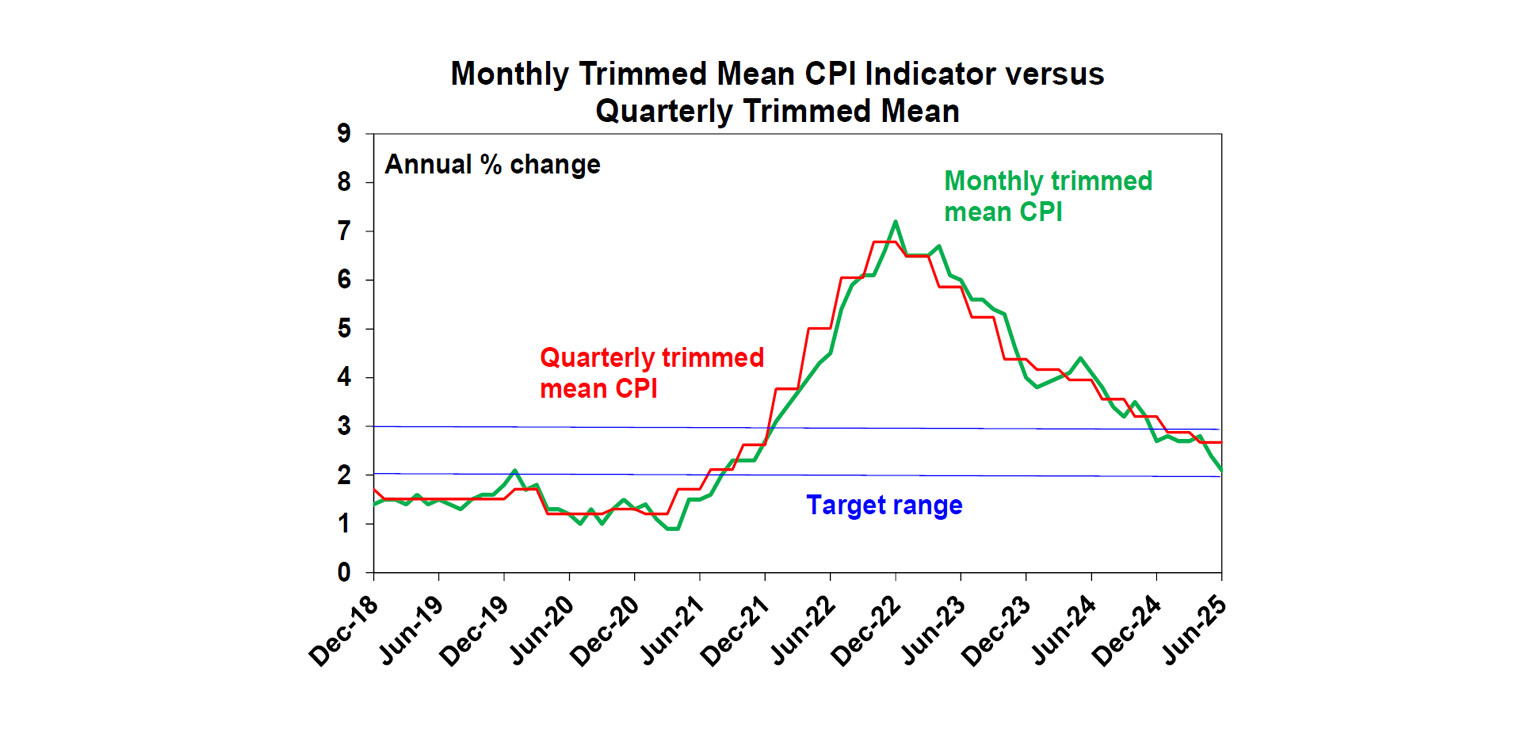
The confirmation of the continuing decline in inflation makes anAugust RBA rate cut almost certain. While trimmed mean inflation was 2.7%yoy compared to the RBA’s forecast for 2.6%,the difference was marginal as before rounding it was 2.67% and,is consistent with the RBA’s forecasts for inflation to fall to the mid-point of their target range. RBA Deputy Governor Hauser effectively confirmed this favourable assessment noting that the June quarter inflation data was “very much as we had expected”implying that its consistent with RBA forecasts. As such along withthe signs of softness evident in June jobs data and the threat to growth from Trump’s tariffs we see it as making an August rate cut almost certain. So, we retain our forecast for 0.25% rate cutsin each of August, November, February and May. However, with momentum remaining down the risks are skewed to inflation undershooting the target and unemployment rising more thanexpected suggesting the risk is towards a faster easing.
Major global economic events and implications
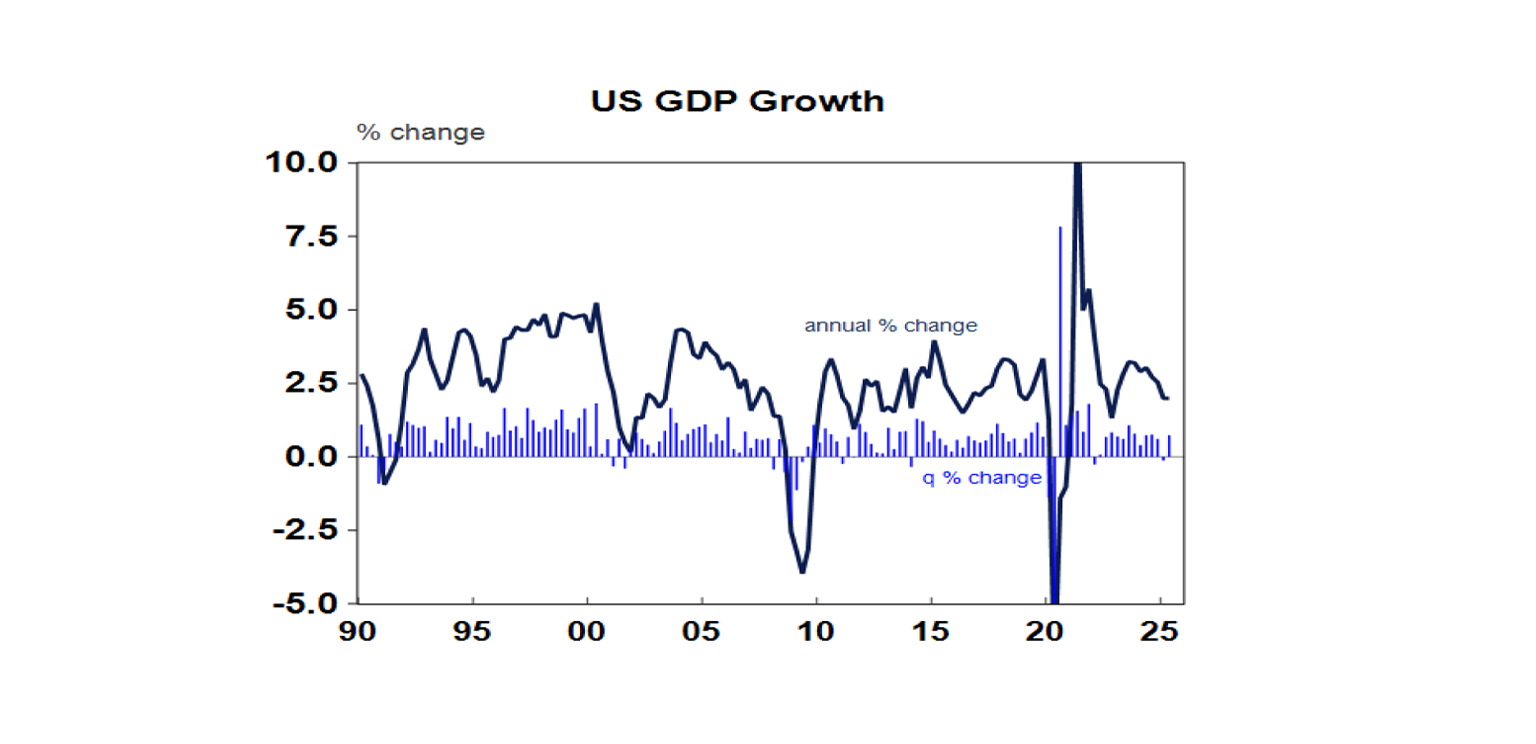
US growth rebounded but is slowing beneath the surface. June quarter GDP growth was 3% annualised after a 0.5% fall in the March quarter as the boost to imports from tariff front running reversed resulting in trade contributing 5 percentage points to growth. Private final demand grew just 1.2% annualised though highlighting an ongoing underlying slowdown in growth.
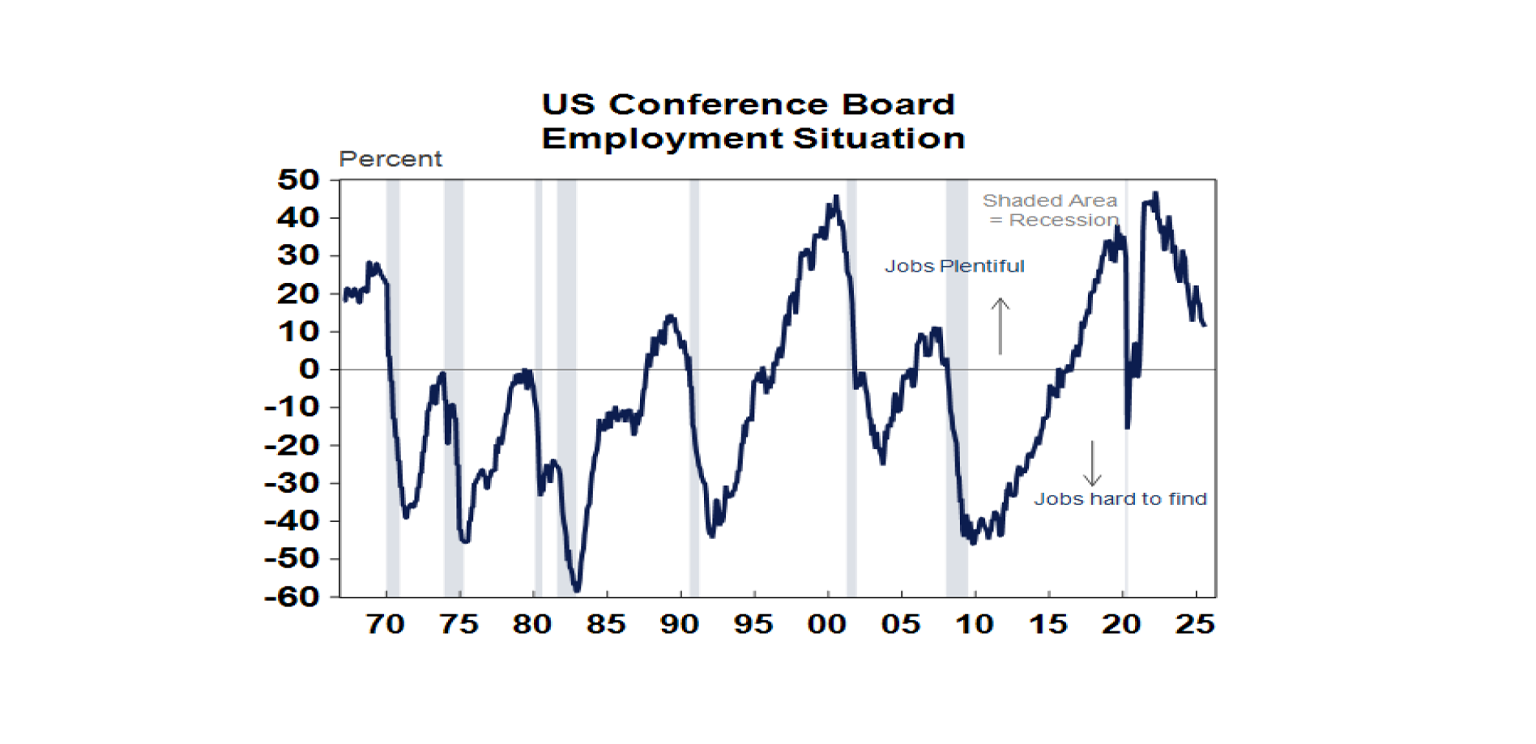
Jobs growth looks to be close to stalling in the US with July payrolls up just 73,000 and the prior months revised down by 238,000. Unemployment rose to 4.2% but this was held down by a fall in participation. The US jobs market having been resilient for so long now looks to be softening in line with weakness in business survey hiring plans, job openings and quits and consumers’ perceptions of whether jobs are plentiful, which fell again in July (see the next chart). Reflecting his annoyance with the bad news not meeting his assessment that “The Economy is BOOMING under Trump””, President Trump then shot the messenger by firing the head of the Bureau of Labor studies which has led to concerns that US economic data will become politicised and lose integrity.
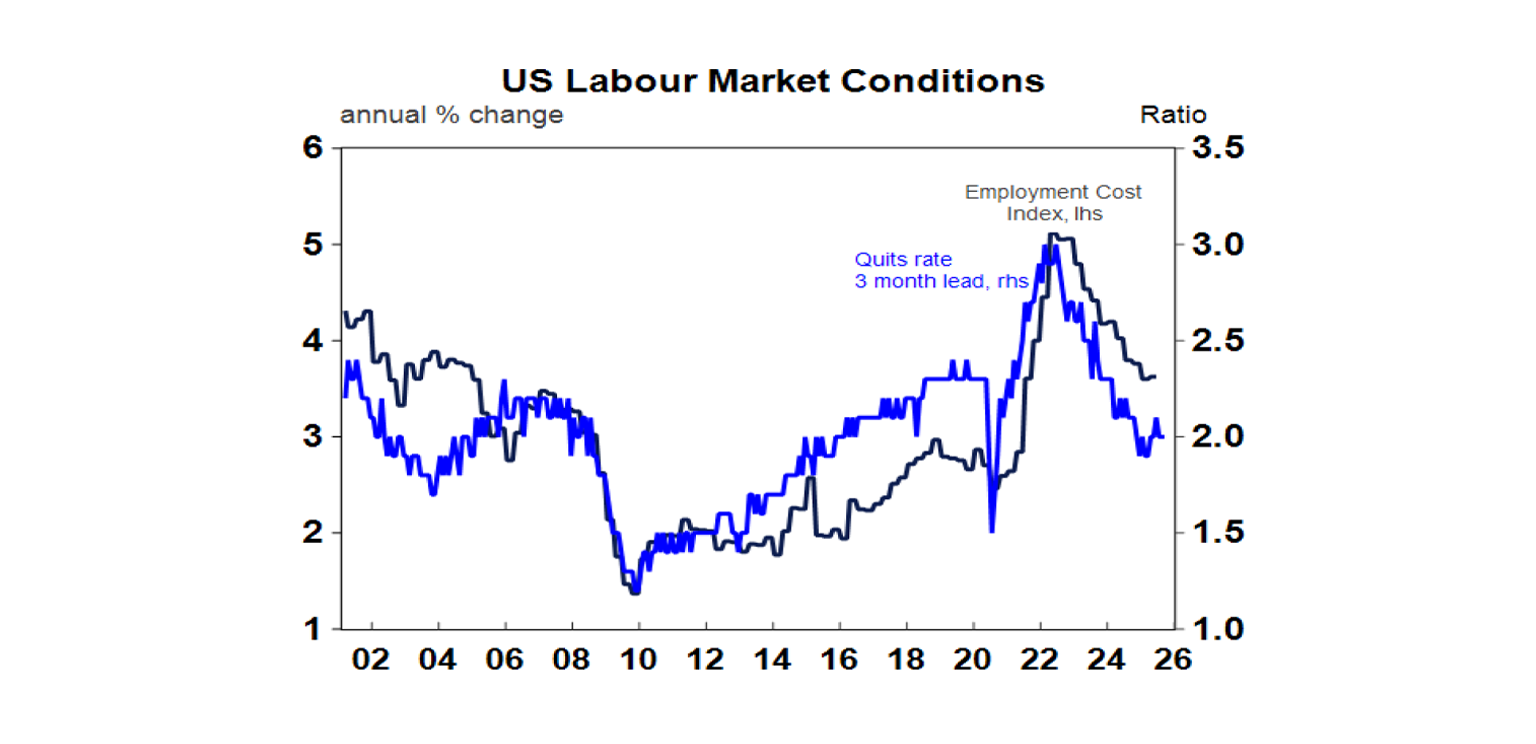
US job openings, quits and hirings all fell with quits pointing to a further cooling in the growth rate in Employment Costs which remained at 3.6%yoy in the June quarter. The employment component in the ISM manufacturing survey also fell sharply in July. Meanwhile, the July manufacturing ISM surprisingly weakened and May home price data showed a further slowing to just 2.8%yoy.
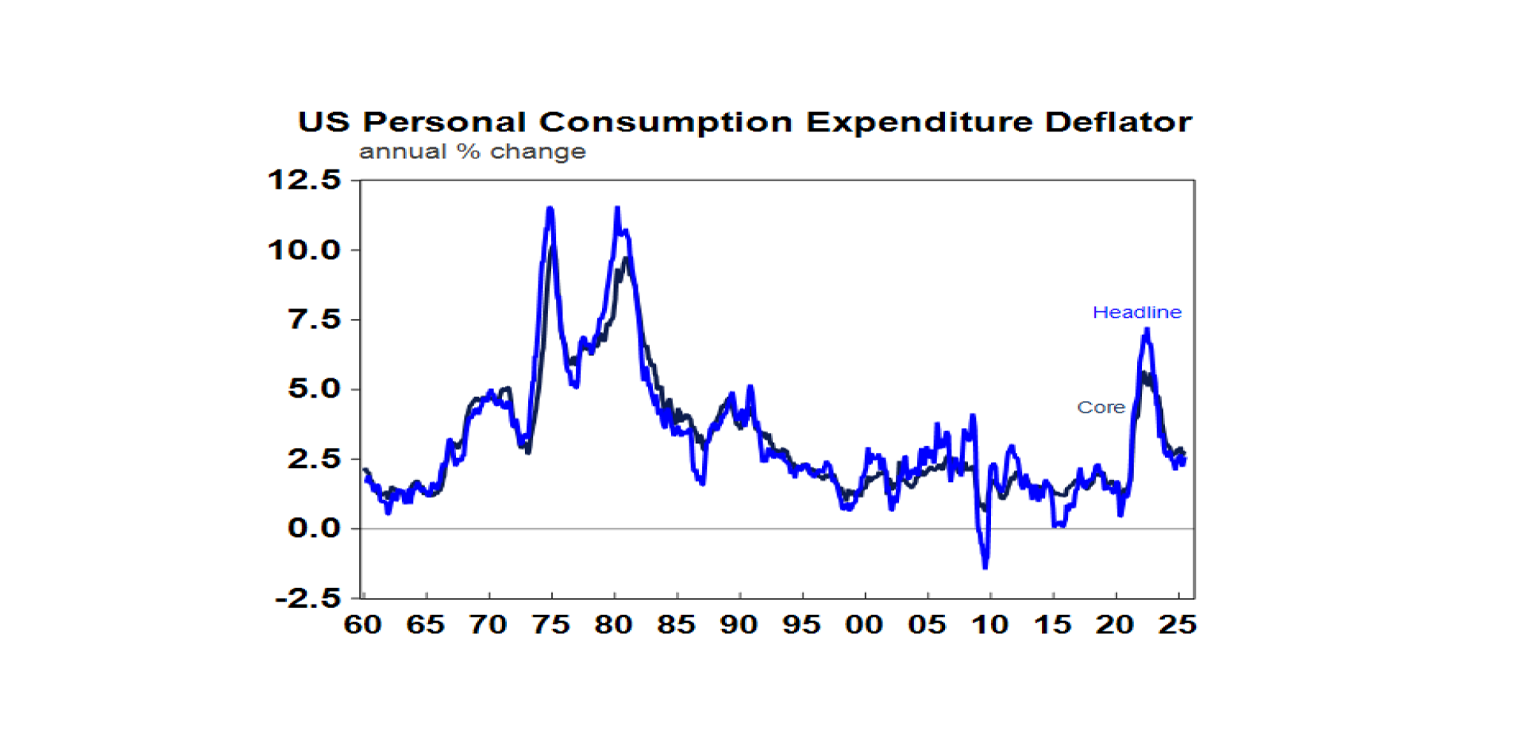
The Fed left interest rates on hold as expected at 4.25-4.5%, but weak jobs data suggests its now behind the curve. Basically, the Fed remains in wait and learn mode regarding the impact of tariffs and low unemployment had given it flexibility to do this. June core PCE inflation data showing a rise to 2.8%yoy also supported this. But the increasing evidence that the labour market is weakening suggests that the Fed is now behind the curve and under increasing pressure to cut rates. Our base case is that weaker growth will trigger a cut in September, and the money market has now moved in line with this. Three cuts are now looking likely this year. Bear in mind though that were it not for Trump’s tariffs the Fed would probably have already cut rates.
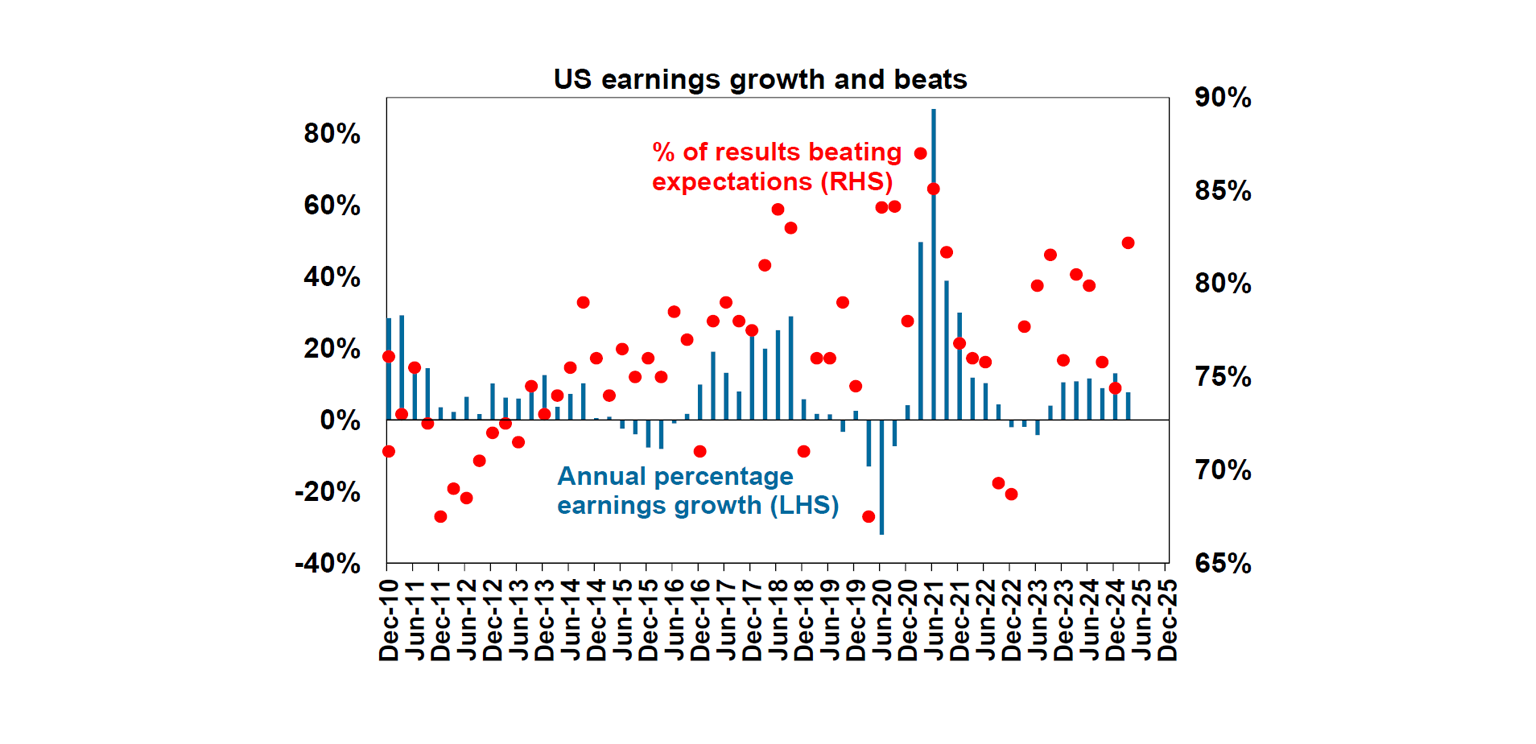
US June quarter earnings are continuing to come in stronger than expected. 66% of S&P 500 companies have so far reported results with 82% beating expectations, above the norm of 76%. Consensus earnings expectations for the quarter have risen to 9.3%yoy up from 4.1% four weeks ago with strong profit growth in tech and financials but most other sectors seeing profits down.
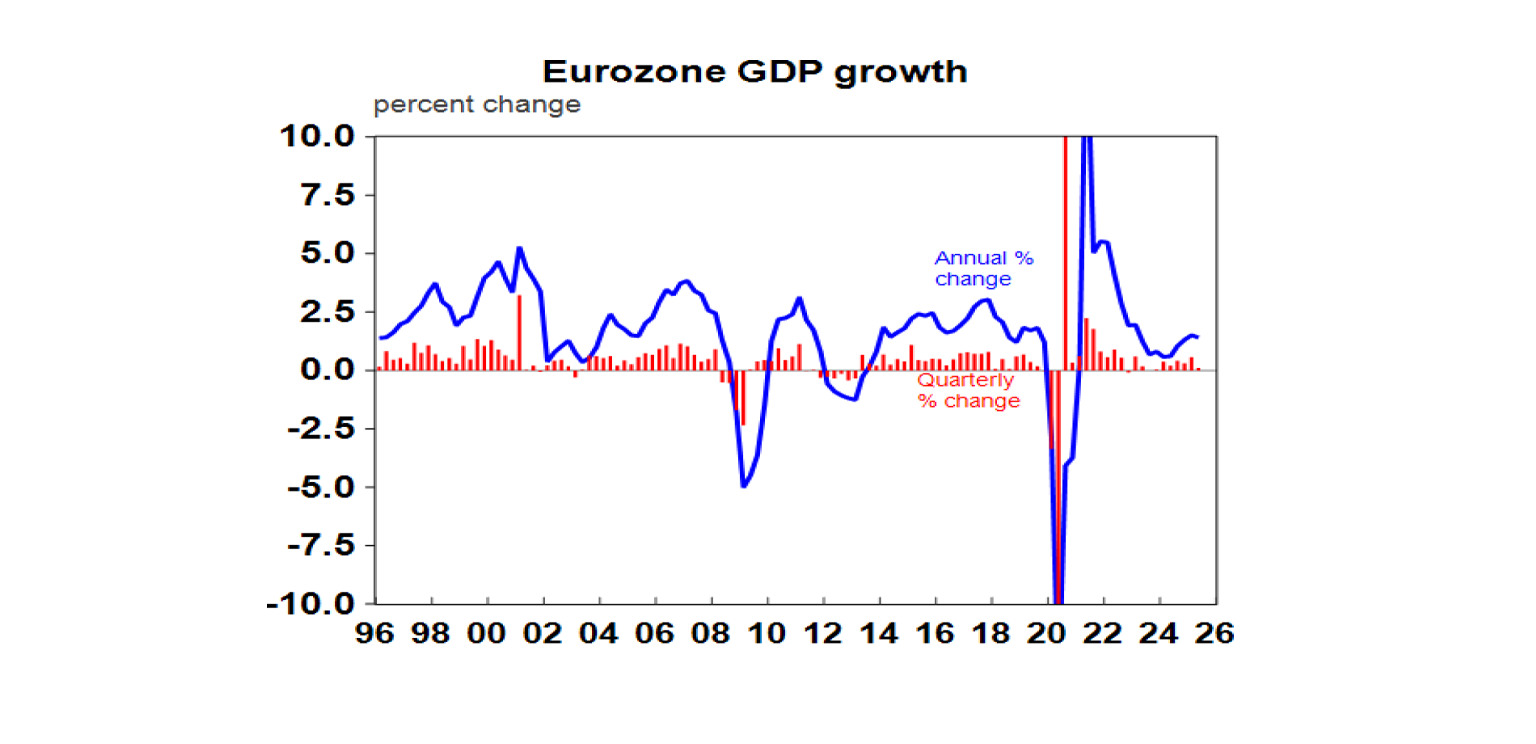
Eurozone June quarter GDP growth slowed to 0.1%qoq and1.4%yoy after the boost to exports from US tariff front running in the March quarter reversed. France and Spain surprised on the upside, Germany and Italy on the downside. Meanwhile, July economic sentiment rose slightly but remains subdued and unemployment remained at 6.2%.
The Bank of Canada left rates on hold at 2.75% noting the economy showing some resilience, ongoing inflation pressures and a reduced risk of a severe global trade war but noted that there may still be a need for a further rate cut.
The Bank of Japan also kept interest rates on hold at 0.5%. Whileit noted that uncertainty remains high, with an upwards revisionto its inflation forecasts and worst case scenarios averted by the US/Japan trade deal, another 0.25% rate hike is possible by year end.Growth in retail sales and industrial production picked up inJune and unemployment remained low at 2.5%.
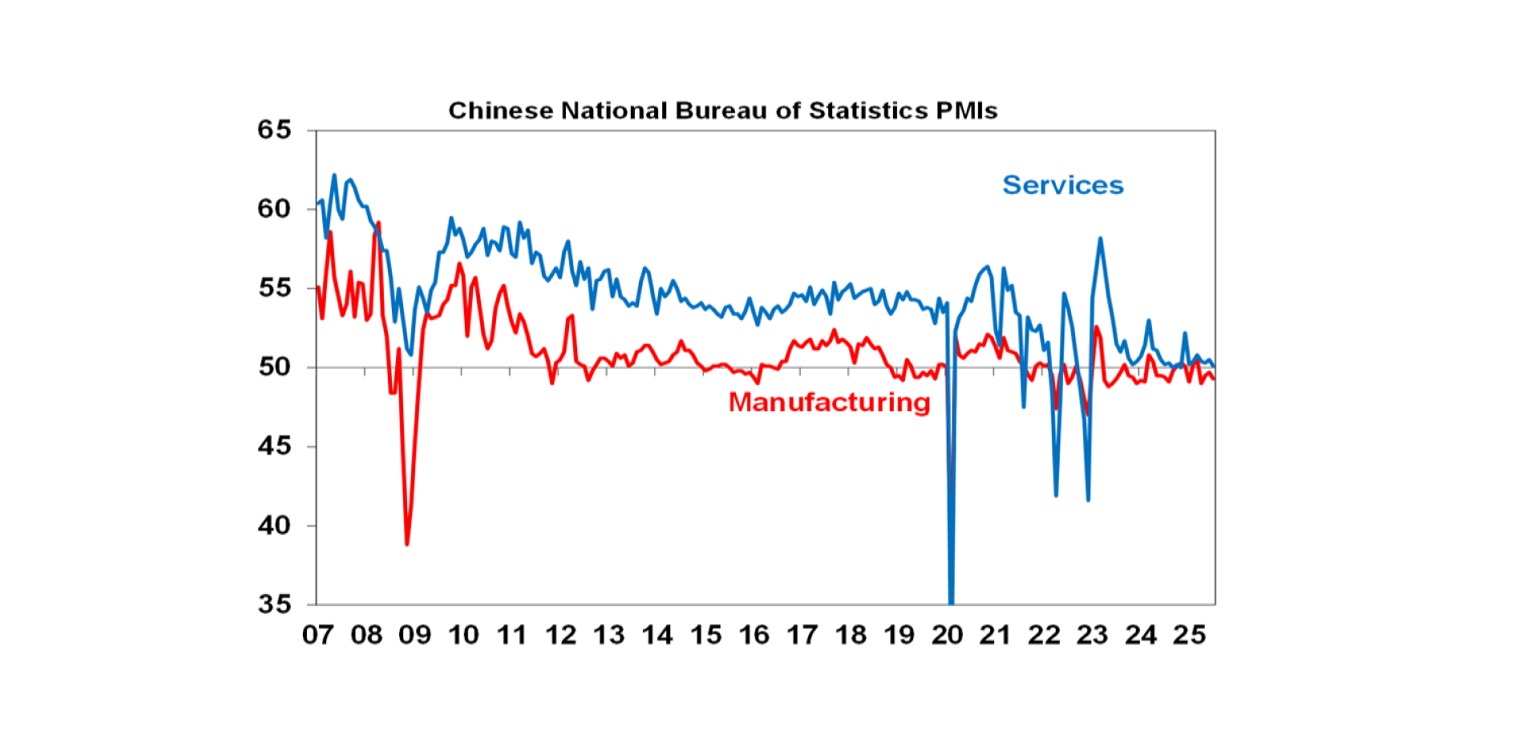
China’s business conditions PMIs fell in July, although theyremain in the same range seen over the last two years.Interestingly the July Politburo meeting indicated less urgency forfurther policy stimulus, possibly reflecting better than feared firsthalf growth and optimism of a trade deal with the US.
Australian economic events and implications
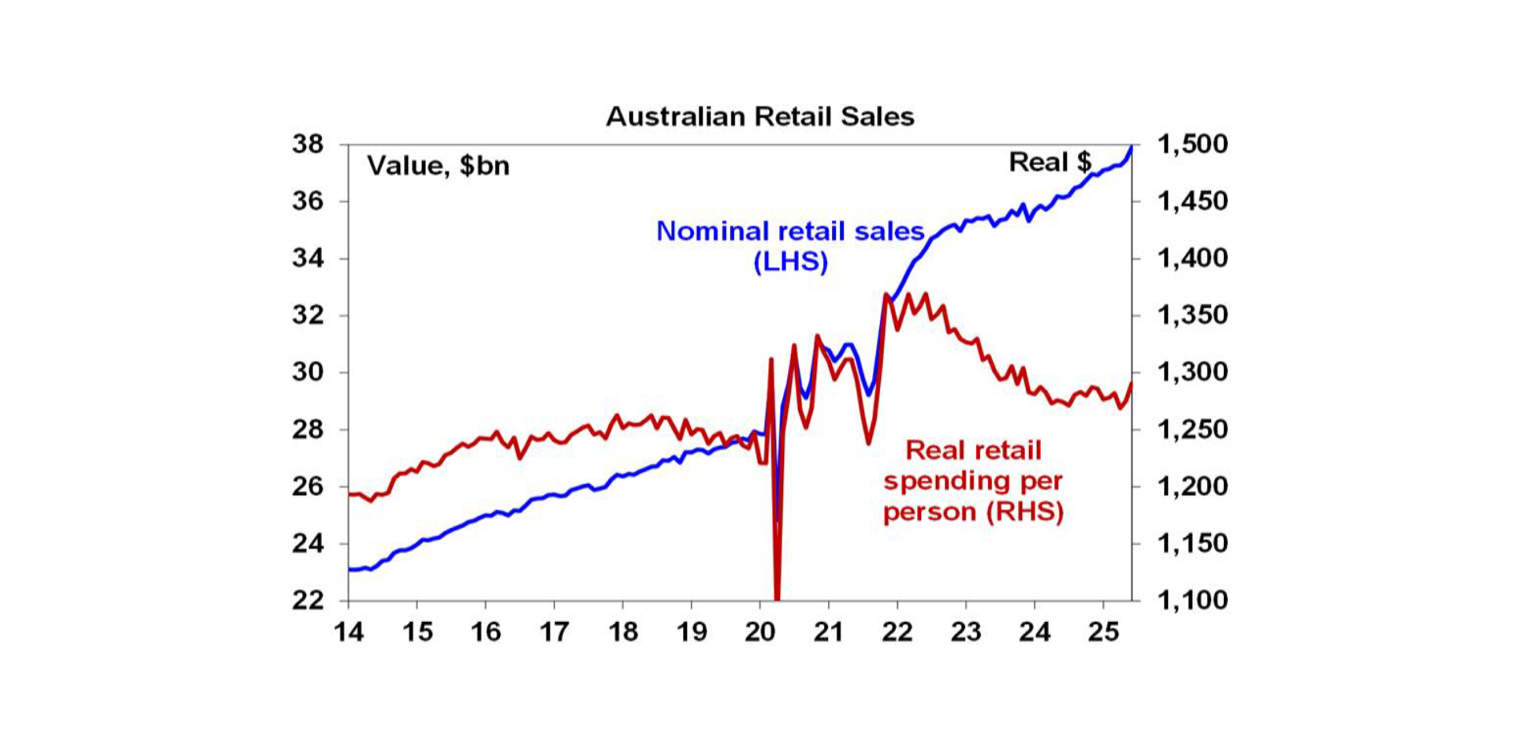
The past week saw a run of stronger economic data. Retail salesrose a stronger than expected 1.2% in June.This along with are bound in spending in Queensland after bad weather also droveup real retail sales in the June quarter by a stronger than expected 0.3%. However, the June bounce looks to have been boosted by EOFY sales driving spending on furniture, electrical goods and clothing with a high risk that it will soften next month much as occurred after Black Friday and Cyber Monday sales last year.
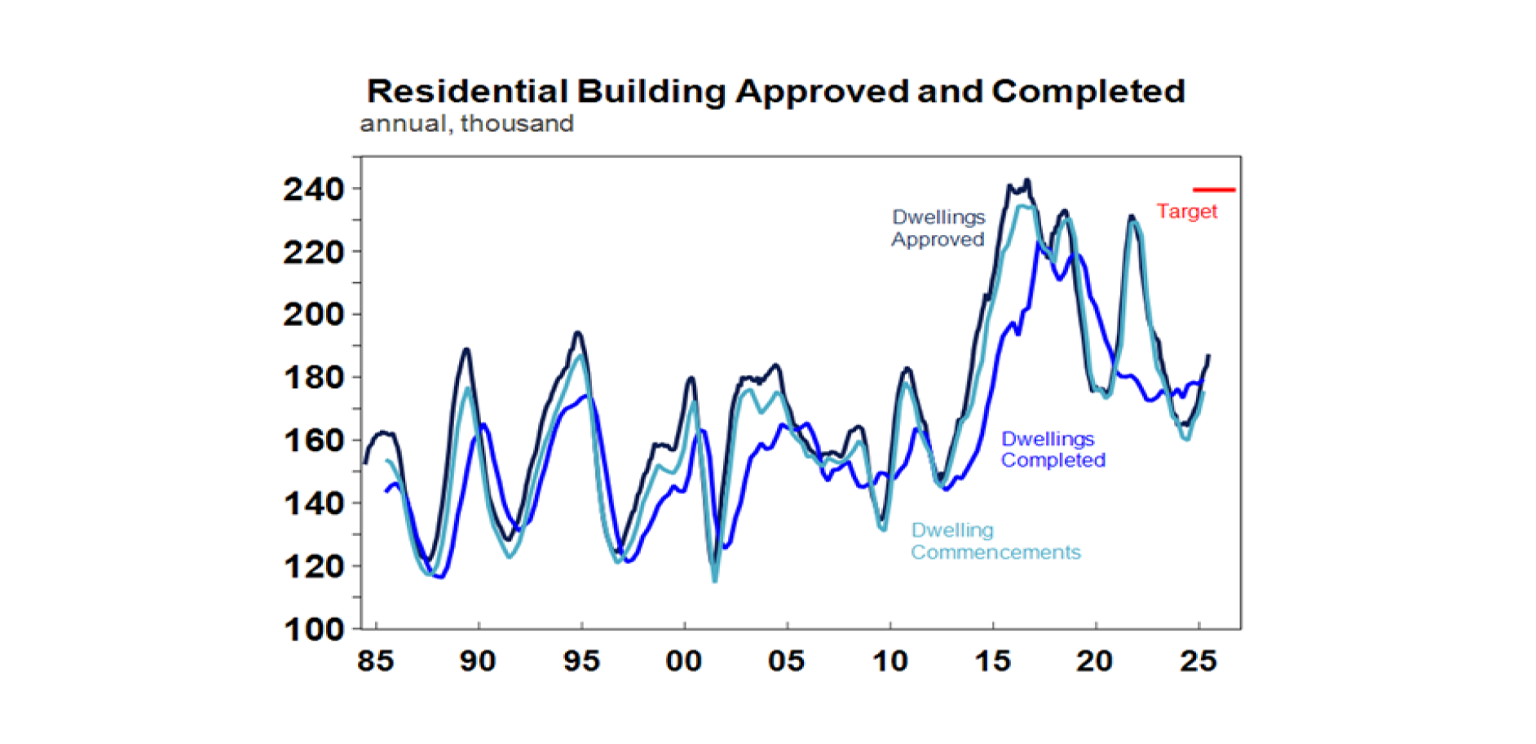
Home building approvals surged nearly 12% in June, restoring arising trend. The rebound is good news and puts trend approvals running at 192,000 pa which is just above current population driven demand for housing. However, it’s still well below the Housing Accord target for 240,000 homes a year (or 1.2 millionover five years) which is what we will need to cut into the accumulated housing shortfall which we estimate to be between 200,000 to 300,000 dwellings! What’s more the surge in June wasdue to a 33% rise in private unit approvals and they are normally very volatile whereas private house approvals fell.
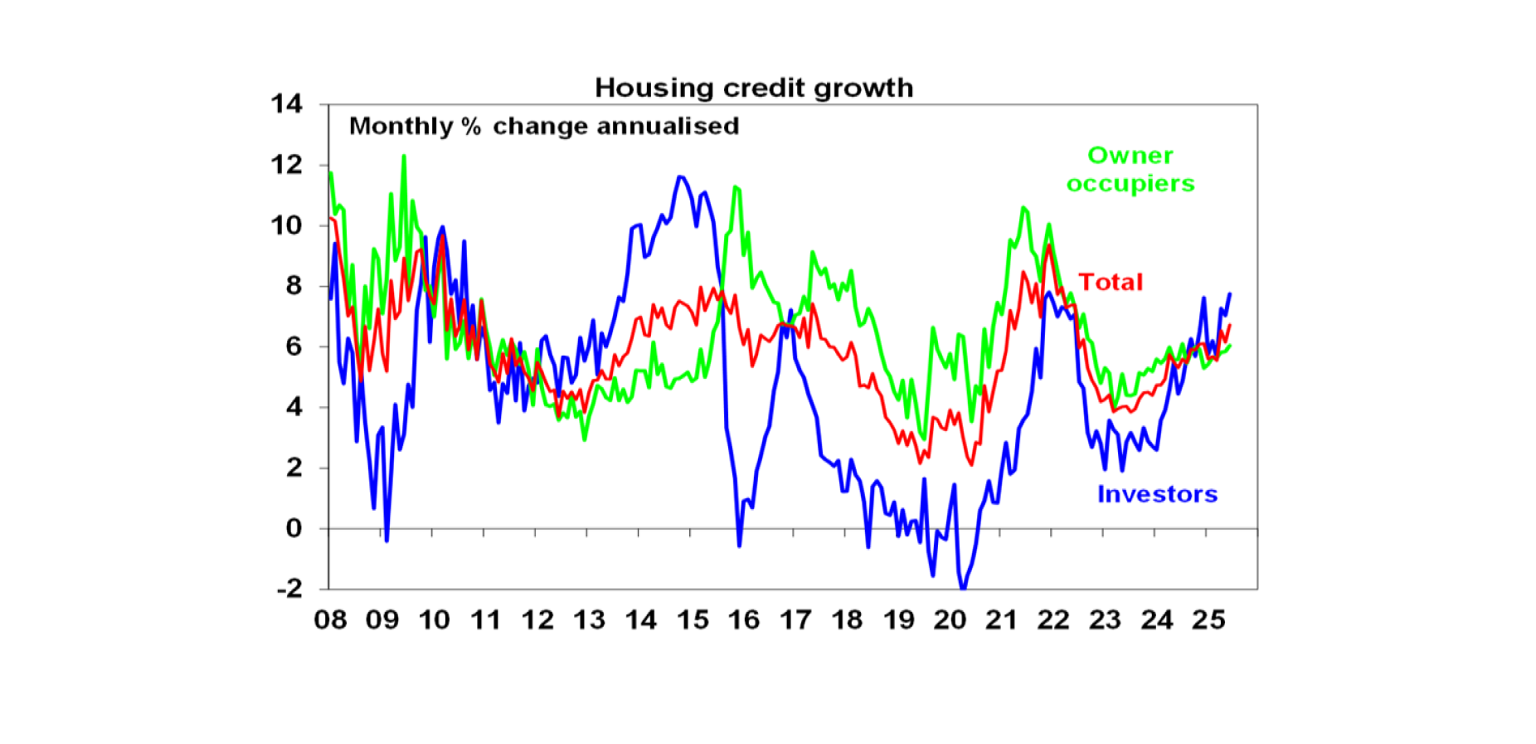
Meanwhile, credit growth remained moderate in June with housing credit growth picking up slightly.
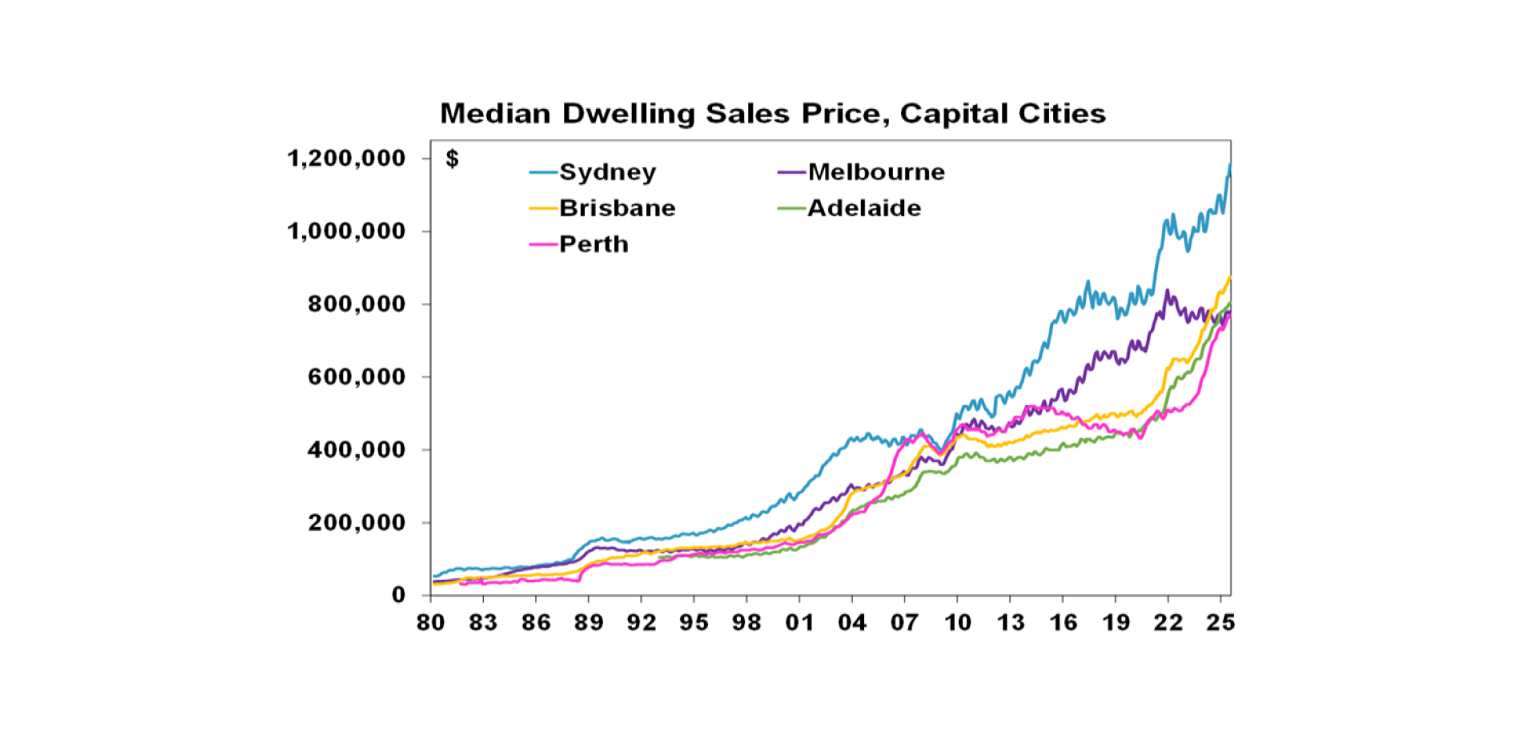
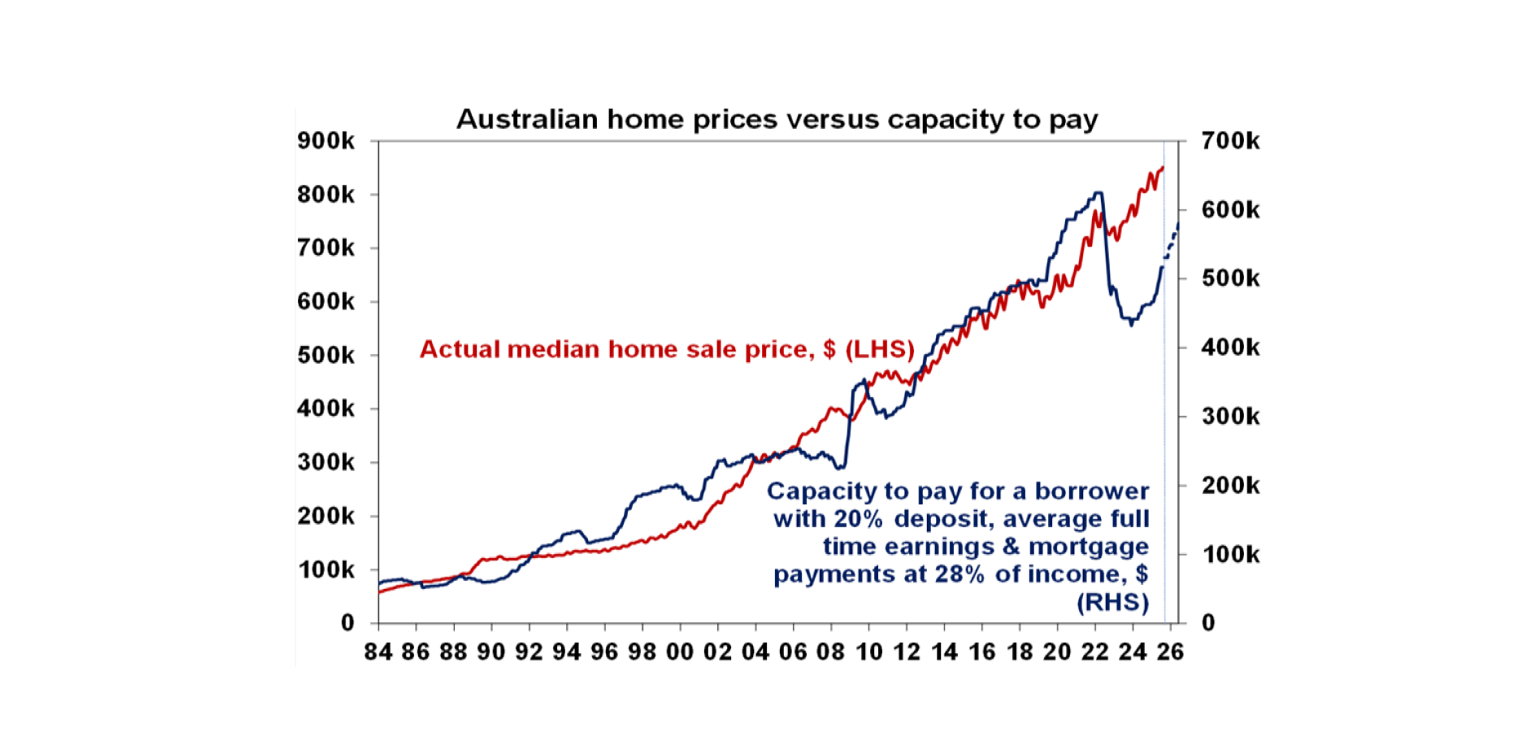
Australian home prices rose for the sixth month in a row in July with another 0.6% gain, as Sydney and Melbourne continue to pick up and the boomtime cities of Brisbane, Adelaide and Perth remain strong. RBA rate cuts with the expectation of more to come are the key driver along with the ongoing housing shortage. Expect further gains ahead, although poor affordability, as illustrated by the still weak capacity to pay for a home compared to when prices soared in 2021, will act as a constraint.
What to watch over the week ahead?
In the US the July services conditions ISM (Tuesday) is expected to improve slightly to an okay reading of 51.3.
The Bank of England (Thursday) is expected to cut its policy rate by 0.25% taking it to 4% and provide dovish guidance.
Chinese trade data for July (Thursday) is expected to show a slight slowing to 4%yoy with import growth remaining weak around 1%yoy. Inflation data (Saturday) is likely to show consumer prices up just 0.1%yoy.
In Australia, household spending for June (Tuesday) is expected to rise 0.9%mom or 5%yoy and the trade surplus for June (Thursday) is expected to rise to around $2.5bn. The June half profit reporting season will see 10 major companies reporting including AMP (Thursday) and Nick Scali & QBE (Friday). Consensus earnings expectations are for a 1.7% fall in earnings for 2024-25 which will mark the third year in a row of falling profits. Resources earnings are expected to be the main drag (as evident in Rio’s profit slump already reported) along with modest falls consumer sector profits but growth elsewhere. Key to watch will be outlook statements given the boost from lower rates, but the threat posed by US tariffs.
Outlook for investment markets
Share markets are at risk of a correction through the seasonally weak months of August and September given stretched valuations and risks around US tariffs and US debt and likely weaker growth and profits. But with Trump pivoting towards more market friendly policies and central banks, including the Fed and RBA, likely to cut rates further, shares are likely to provide reasonable gains into year end.
Bonds are likely to provide returns around running yield or a bit more, as growth slows, and central banks cut rates.
Unlisted commercial property returns are likely to improve as office prices have already had sharp falls in response to the lagged impact of high bond yields and working from home.
Australian home prices have started an upswing on the back of lower interest rates. But it’s likely to be modest initially with poor affordability and only gradual rate cuts constraining buyers. We see home prices rising around 6% this year.
Cash and bank deposits are expected to provide returns of around 3.75%, but they are likely to slow as the cash rate falls.
The $A is likely to be buffeted in the near term between the negative global impact of US tariffs and the potential positive of a further fall in the overvalued US dollar. Undervaluation should support it on a medium-term view with fair value around $US0.73.
You may also like
-

Weekly market update - 17-07-2026 Following the renewed escalation in the US/Iran conflict, the Strait of Hormuz is effectively closed again with Iran attacking ships and the US attacking Iran and blockading its ports. Both are now back to attacking energy infrastructure which is a signficant & concerning escalation. -

Oliver's insights - Why have Australian living standards “fallen” and how do we fix it? For the last few years there has been much talk of a “cost-of-living” crisis in Australia and of “falling living standards”. This has flared up again lately with the pickup in inflation resulting in a renewed fall in real wages. -

Weekly market update - 10-07-2026 Ceasefire over but markets are also over the war, Why oil prices can't go too low or too high, Is AI adding to inflation risk or taking it away, and Australia’s wage problem.
Important information
Any advice and information is provided by AWM Services Pty Ltd ABN 15 139 353 496, AFSL No. 366121 (AWM Services) and is general in nature. It hasn’t taken your financial or personal circumstances into account. Taxation issues are complex. You should seek professional advice before deciding to act on any information in this article.
It’s important to consider your particular circumstances and read the relevant Product Disclosure Statement, Target Market Determination or Terms and Conditions, available from AMP at amp.com.au, or by calling 131 267, before deciding what’s right for you. The super coaching session is a super health check and is provided by AWM Services and is general advice only. It does not consider your personal circumstances.
You can read our Financial Services Guide online for information about our services, including the fees and other benefits that AMP companies and their representatives may receive in relation to products and services provided to you. You can also ask us for a hardcopy. All information on this website is subject to change without notice. AWM Services is part of the AMP group.