


Oliver's insights
Nine key charts for investors to keep an eye on
Share markets have had a bit of a wobbly start to the year, particularly in the US. This note looks at nine key charts worth watching.
8 min read

Key points
This year has started off rather messy with geopolitical threats and worries around AI disruption and valuations.
We are mildly upbeat on shares for the year but see a 15% or so correction as likely along the way.
Nine key charts worth watching are: business conditions PMIs; US tariffs; inflation; inflation expectations; profit growth; share market valuations; the rotation trade from tech to non-tech shares; the $US; and geopolitical risk. At present they are sending mixed signals.
Introduction
Share markets have had a bit of a wobbly start to the year, particularly in the US. This note looks at nine key charts worth watching.
Chart 1: Global business conditions PMIs - positive
As always, a key driver of how shares perform over the next 6-12 months will be whether major economies including Australia avoid recession and continue to grow. The historical experience indicates that provided recession is avoided any fall in shares will be relatively short term in nature. Business conditions PMIs – surveys of business conditions globally - will provide a key early warning. So far, they are running around okay levels.
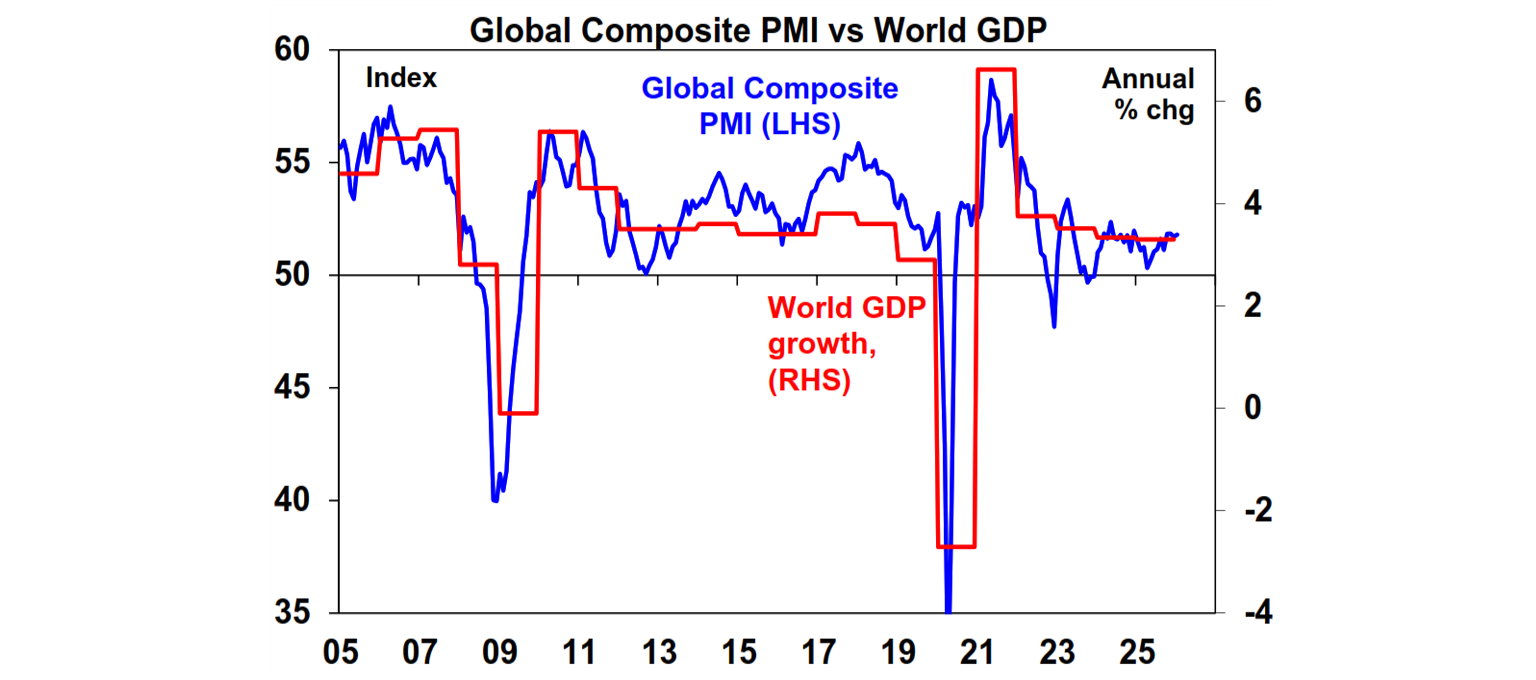
Chart 2: US tariffs as a proxy for Trump policies - better
Last year saw a US tariff roller-coaster as Trump announced huge tariffs and then backed down a bit. They are still subject to much chopping and changing and while longer-term damage is yet to felt, it’s likely we have seen “peak tariff” as Trump pivots to more voter friendly policies ahead of the midterm elections. This may get a push along with a good chance the Supreme Court will reject the reciprocal and fentanyl tariffs. Call it TACO or TUNA, the pivot on tariffs is consistent with other recent moves like nominating a more conventional Fed Chair and a softer approach from ICE. If this continues it’s likely to be positive for share markets.
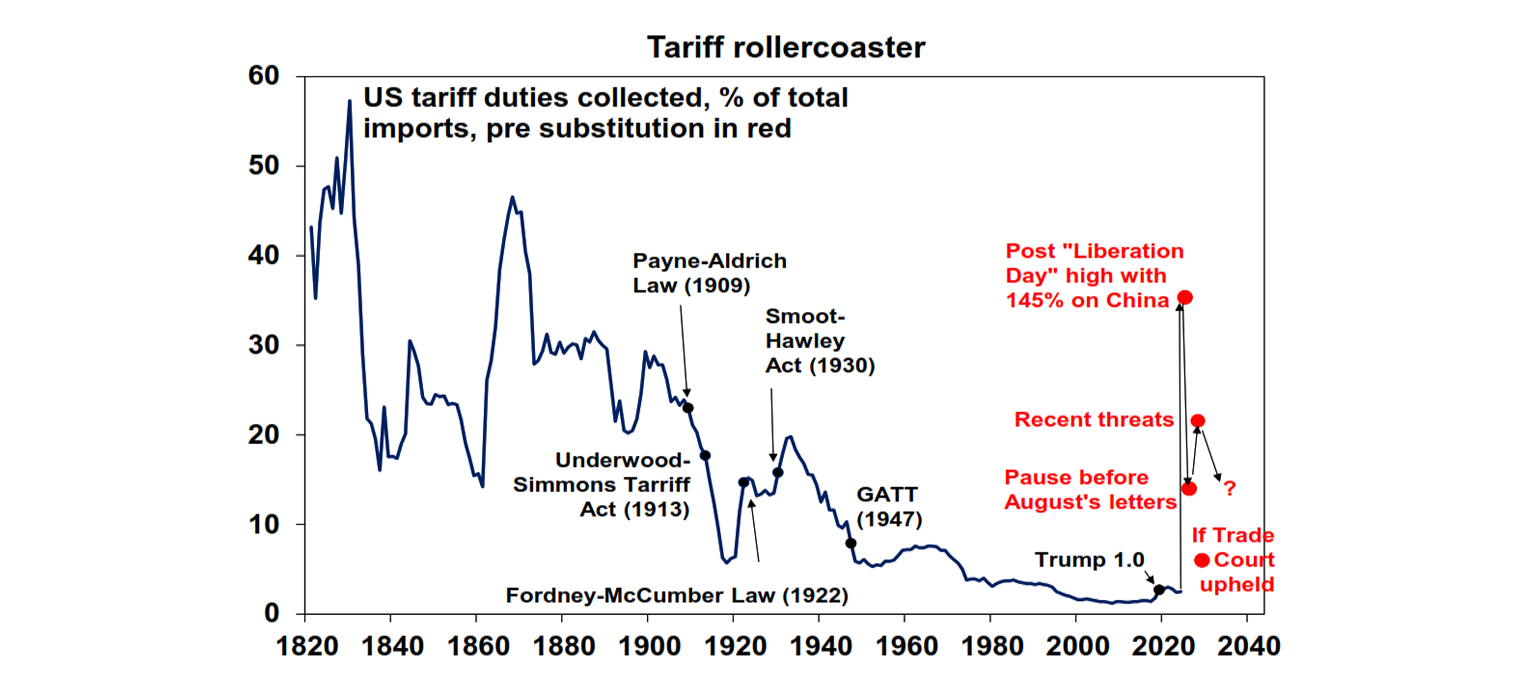
Chart 3: Inflation (and hence interest rates) - neutral
Last year progress in lowering inflation reversed in some countries. This included Australia which has raised rates. A resumption of the downswing will be needed for further cuts or to leave rates on hold (in Australia).
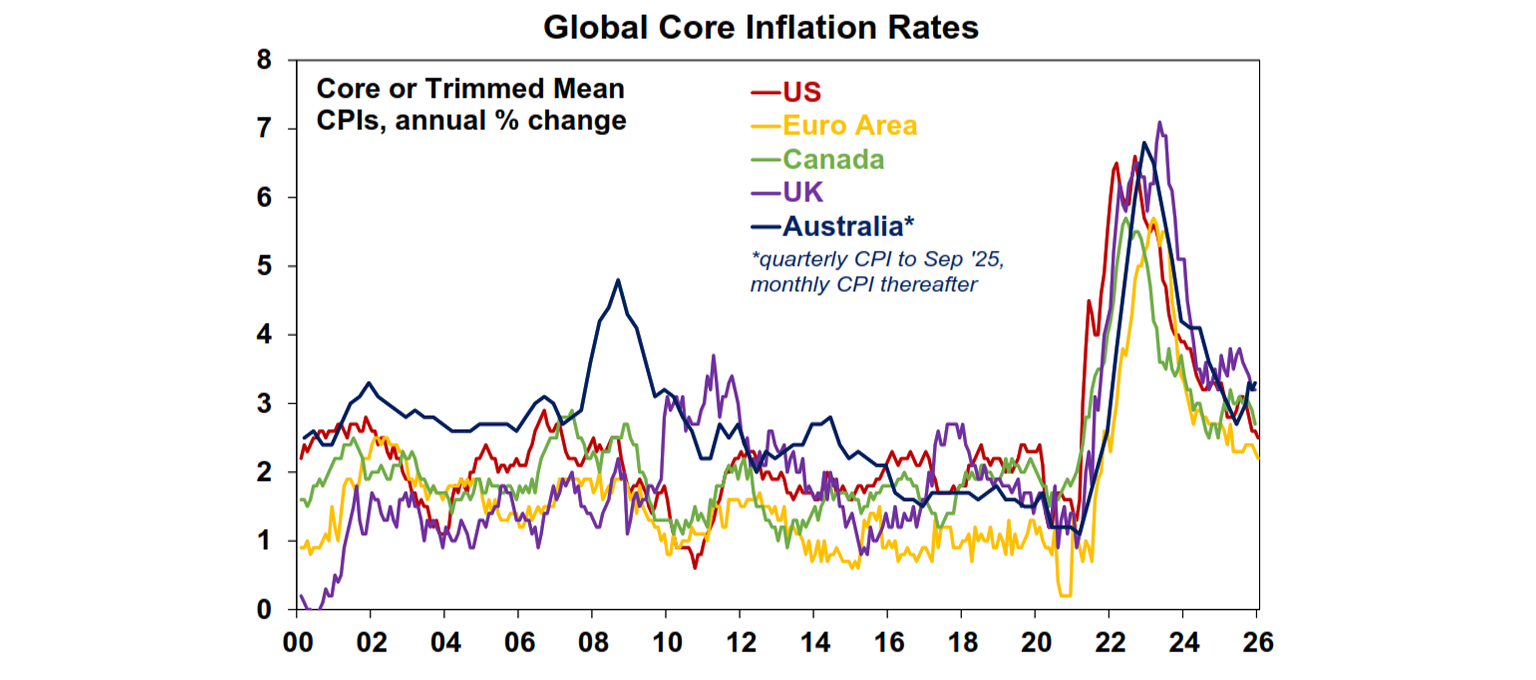
Chart 4: Inflation expectations – slight negative
The 2022 inflation shock and last year’s US tariff surge posed a risk that inflation expectations will move higher making it harder to get inflation down. Fortunately, inflation expectations remain reasonably low. But they are high compared to the pre-pandemic period, including in Australia. If the trend stays up it will mean higher interest rates than otherwise.
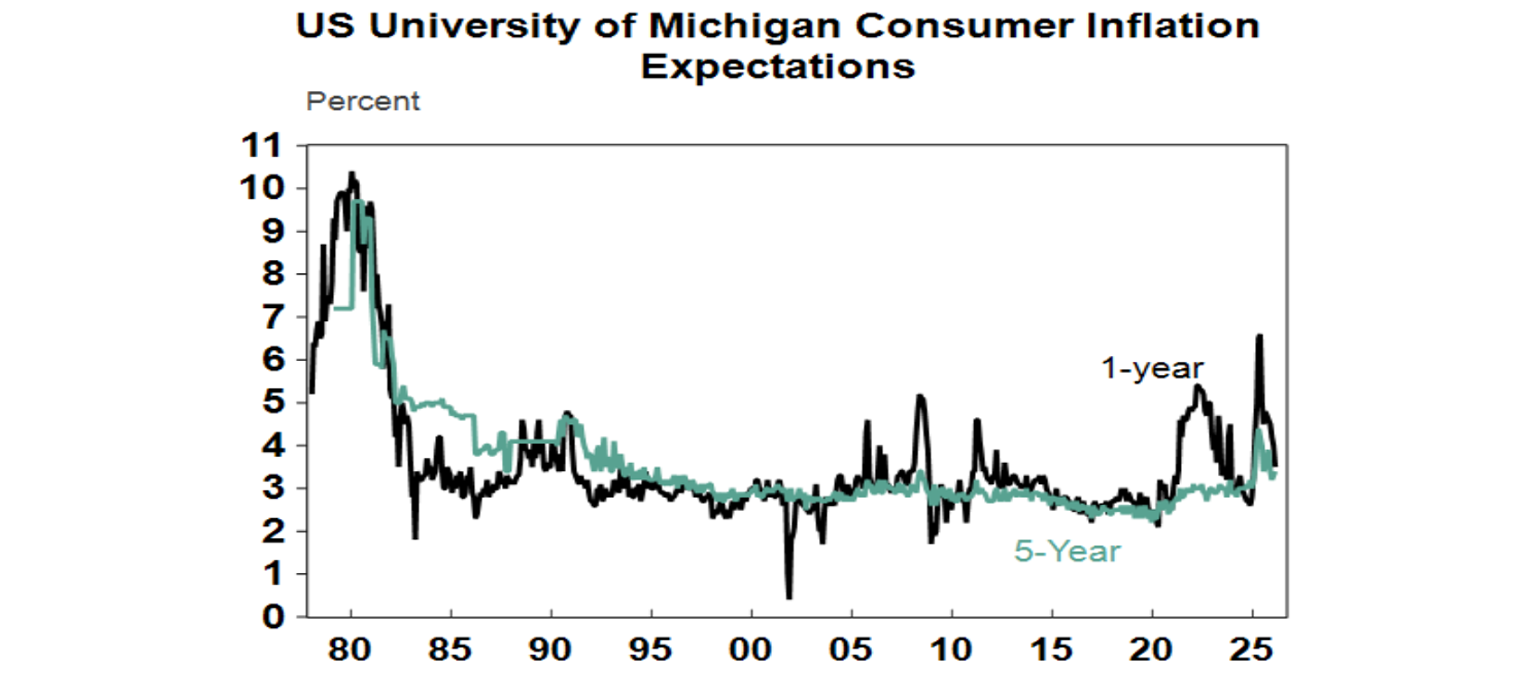
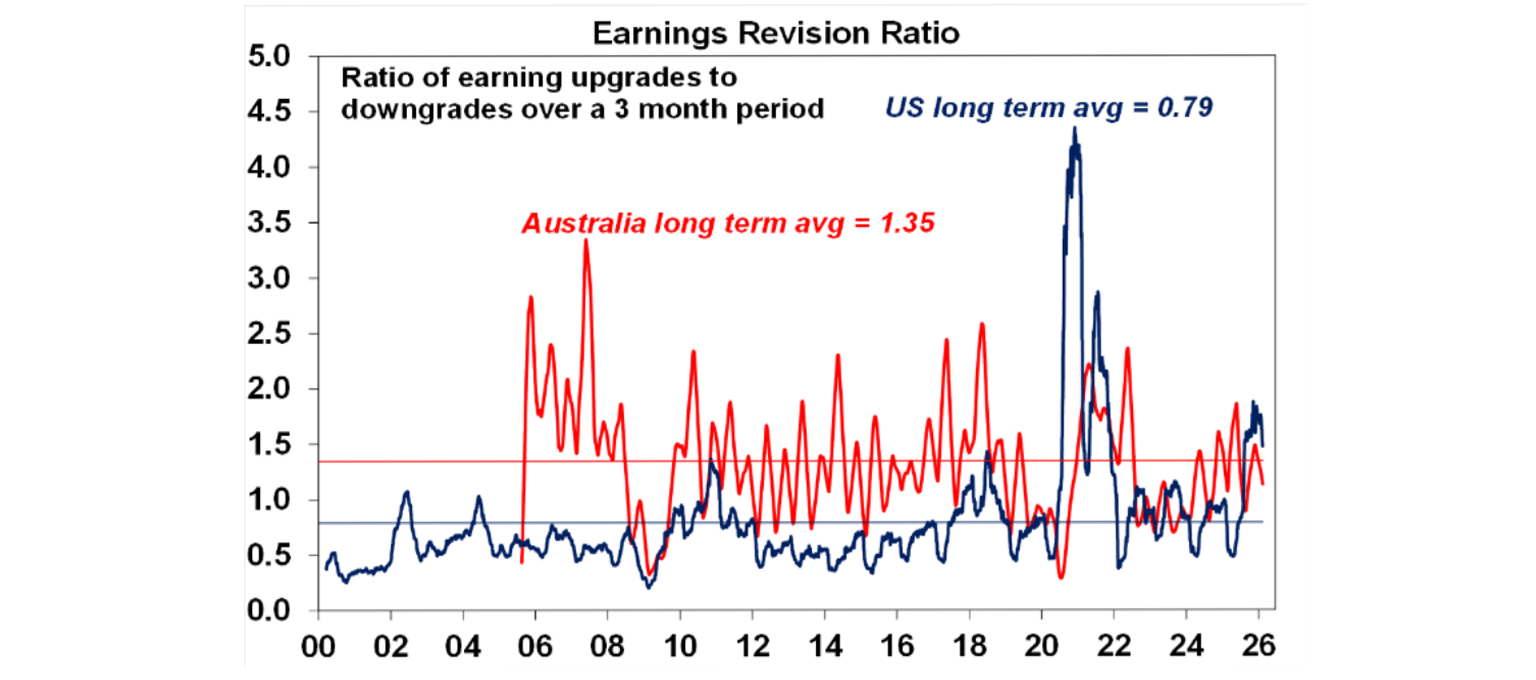
Chart 5: Company profits - positive
Consensus 12-month ahead earnings growth expectations are around 15% in the US and around 10% in Australia, with upwards revisions lately.
While the Australian December half reporting season is only about 25% done, so far there has been more beats and less misses than normal with around 60% of companies reporting earnings & dividends up on a year ago. This needs to continue to support further gains in the local share market.
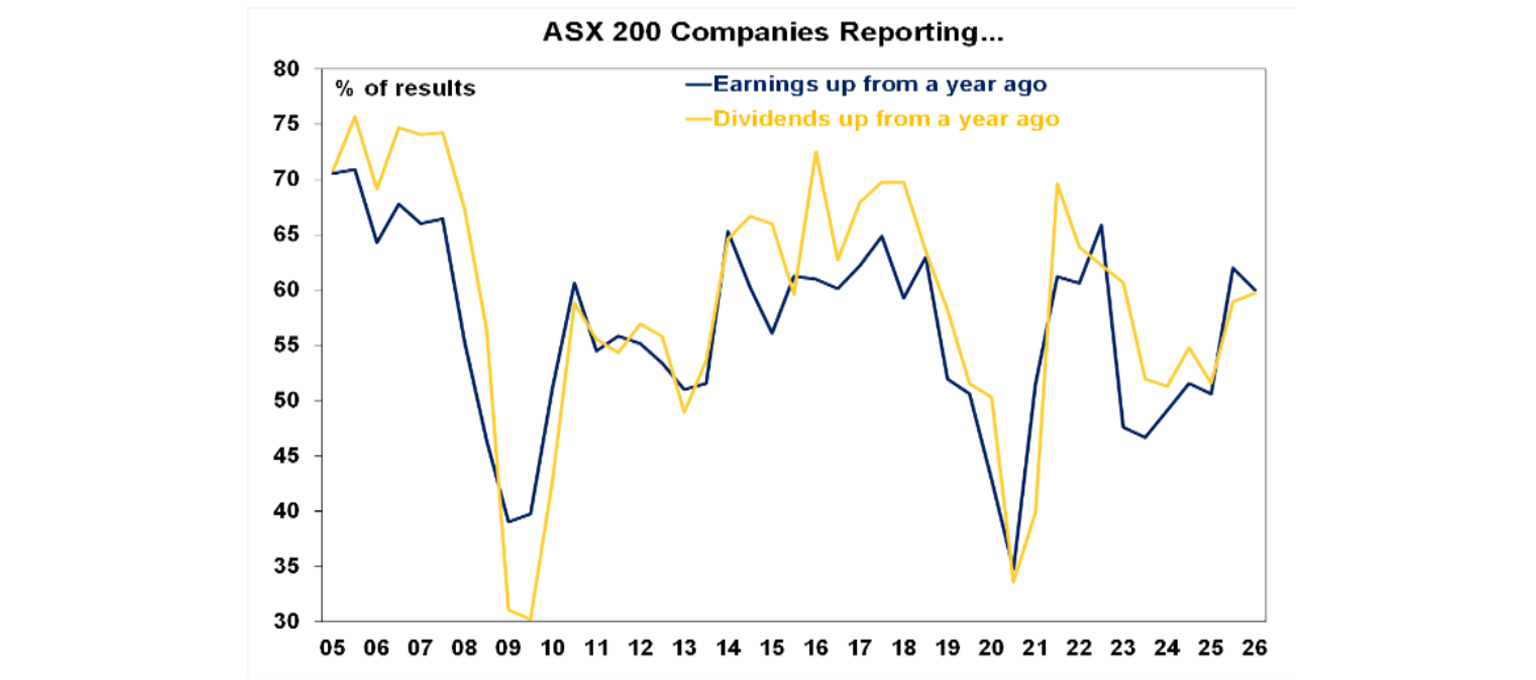
Chart 6: Share valuations - negative
Since 2020, rising bond yields and high PE multiples have seen a deterioration in share valuations such that the gap between earnings yields & bond yields is near zero in the US & Australia. This leaves them vulnerable to bad news. Ideally lower bond yields and higher earnings are required.
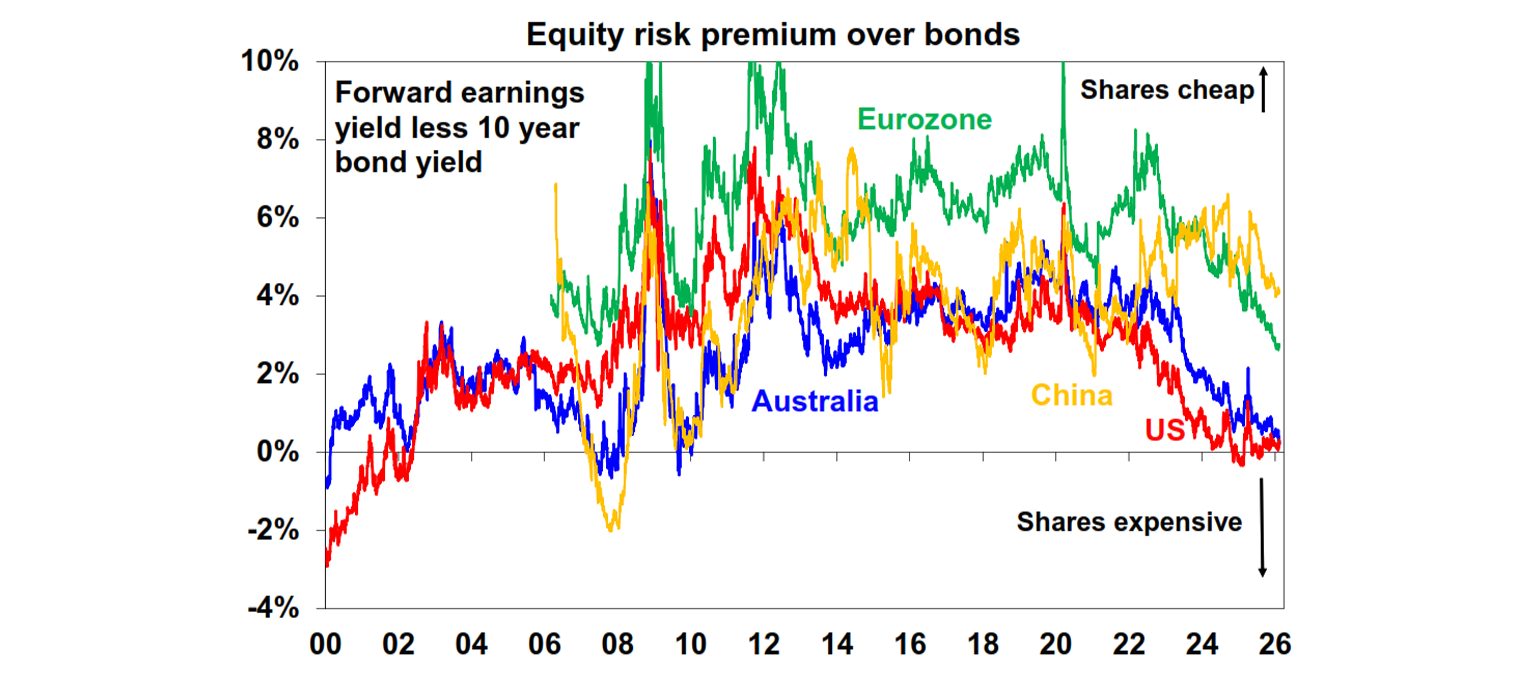
Chart 7: Share market rotation – positive
While concerns about the disruptive impact of AI, related capex and tech valuations have weighed on tech stocks this year leaving Nasdaq down 3% and the Magnificent Seven down 7.2%, an investor rotation into non-tech shares has pushed the equal weighted S&P 500 up 5.8% and limited the fall in the market cap weighted S&P 500 to 0.1%. The rotation has also seen other global share markets rise. A continuing rotation should mean that overall shares can still see gains this year, unless tech falls so much it drags the whole market down (as ultimately occurred in the tech wreck).
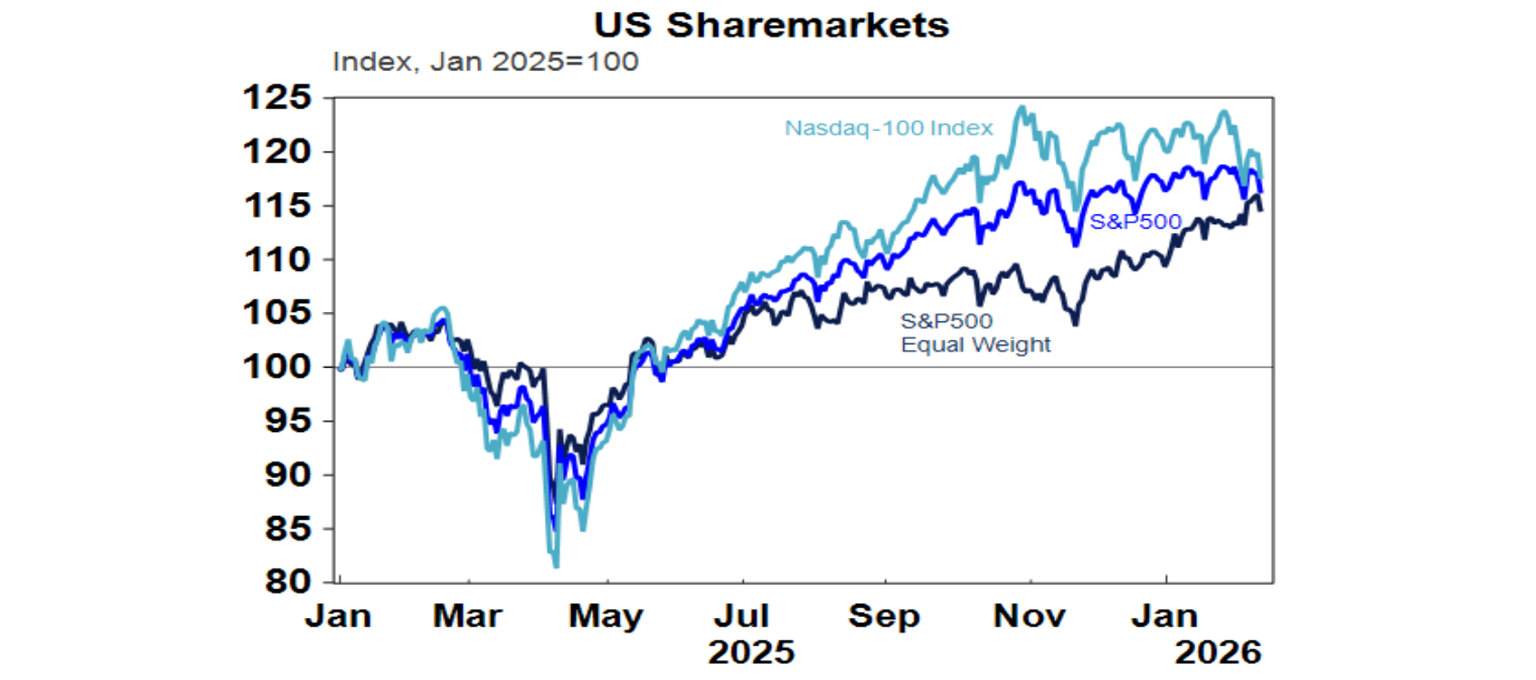
Chart 8: The US dollar - messy
Normally in times of uncertainty the $US rises as the US economy has a relatively low exposure to cyclical sectors. Over the last year this has been upended as Trump’s erratic policymaking put downwards pressure on the $US. If the $US continues its downtrend it could raise the risk of a US public debt crisis which runs the risk of higher bond yields impacting share markets. For Australia, the falling $US and rising interest rates versus the US means a higher $A. This is a de facto monetary tightening – and could take pressure off inflation enabling the RBA to avoid further rate hikes.
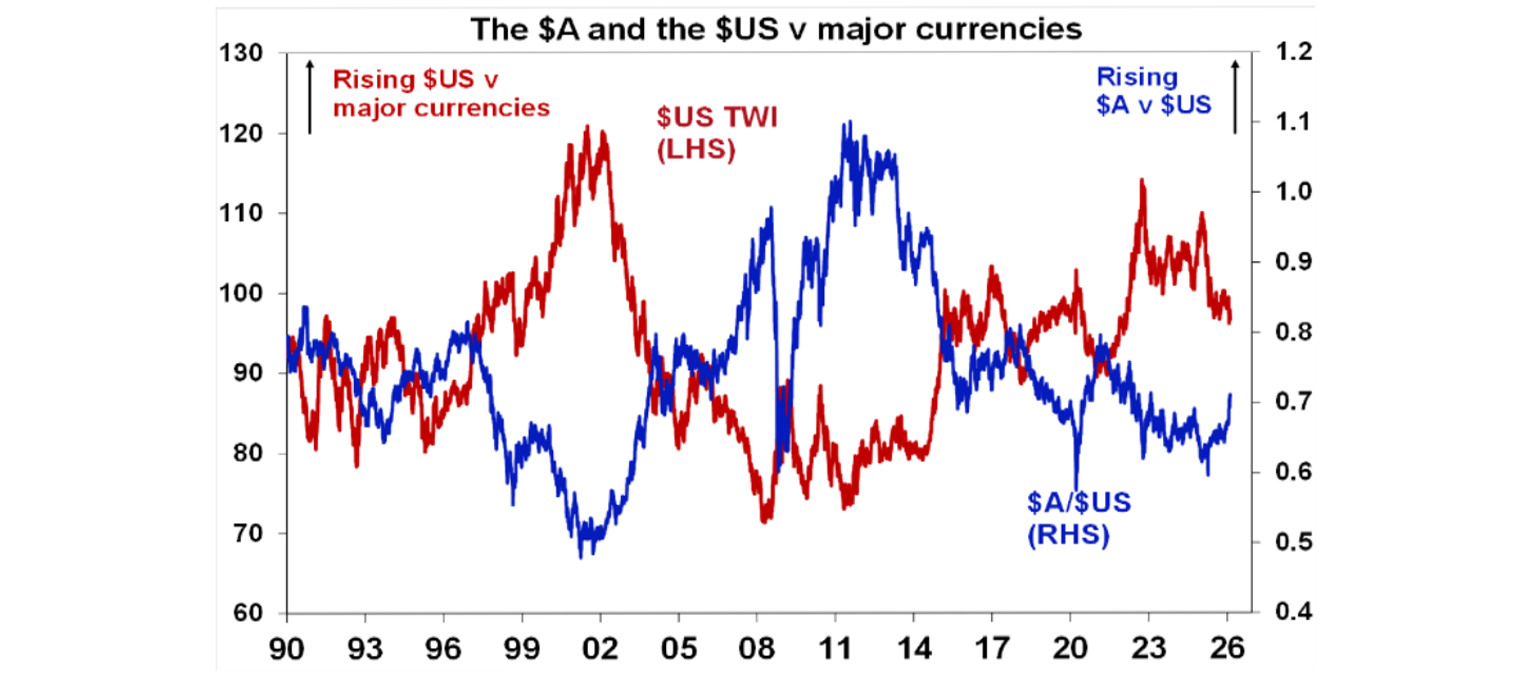
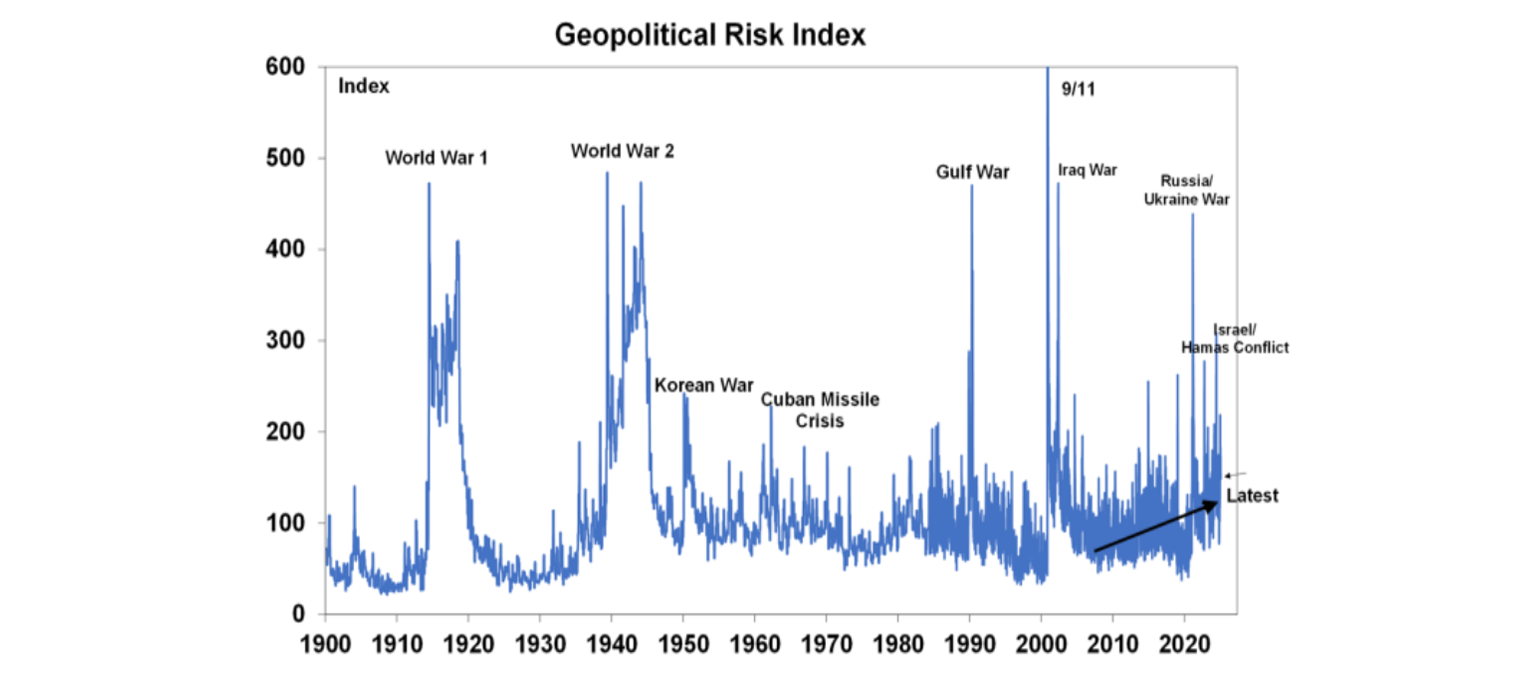
Chart 9: Geopolitical risk – slight negative
Since the GFC, geopolitical risk has been on the rise in response to rising populism and nationalism, great power rivalry between the US and China and as the US enters relative military decline. It’s hard to see this reversing any time soon. Key to watch in the near term is the high risk of conflict between the US and Iran which could threaten global oil supplies. But as we saw last year with the US strike on Iran, trying to forecast this is fraught.
Dr Shane Oliver
Head of Investment Strategy and Chief Economist, AMP
You may also like
-

Oliver's insights Economics of happiness 28 July 2026 . The basic “economic problem” which economics is focussed on solving is: how to maximise utility or satisfaction when human wants are unlimited but resources available to satisfy those wants are limited. Of course, utility is basically happiness, so economics is all about happiness. -

Weekly market update - 24-07-2026 Renewed global worries weighed on the Australian share market which fell around 0.3%, but with its lower exposure to tech shares providing some protection. -

Oliver's insights Charts to watch 21 July 2026 Share markets had a strong first half despite the oil supply shock as expectations for de-escalation, okay economic data, strong profits and the AI boom provided an offset.
Important information
Any advice and information is provided by AWM Services Pty Ltd ABN 15 139 353 496, AFSL No. 366121 (AWM Services) and is general in nature. It hasn’t taken your financial or personal circumstances into account. Taxation issues are complex. You should seek professional advice before deciding to act on any information in this article.
It’s important to consider your particular circumstances and read the relevant Product Disclosure Statement, Target Market Determination or Terms and Conditions, available from AMP at amp.com.au, or by calling 131 267, before deciding what’s right for you. The super coaching session is a super health check and is provided by AWM Services and is general advice only. It does not consider your personal circumstances.
You can read our Financial Services Guide online for information about our services, including the fees and other benefits that AMP companies and their representatives may receive in relation to products and services provided to you. You can also ask us for a hardcopy. All information on this website is subject to change without notice. AWM Services is part of the AMP group.