


Oliver's Insights
Australian home prices fell another 1.2% in October
Dr Shane Oliver discusses how Australian home prices fell another 1.2% in October, prices have now fallen 6% from their peak and that we will continue to expect a 15-20% top to bottom fall in average home prices.
6 min read
Key features
Australian capital city average dwelling prices fell another 1.1% in October according to CoreLogic, making it their sixth monthly decline in a row.
Including regional dwellings, which fell another 1.4%, national dwelling prices fell 1.2% in the month, and prices are now down -0.9%yoy.
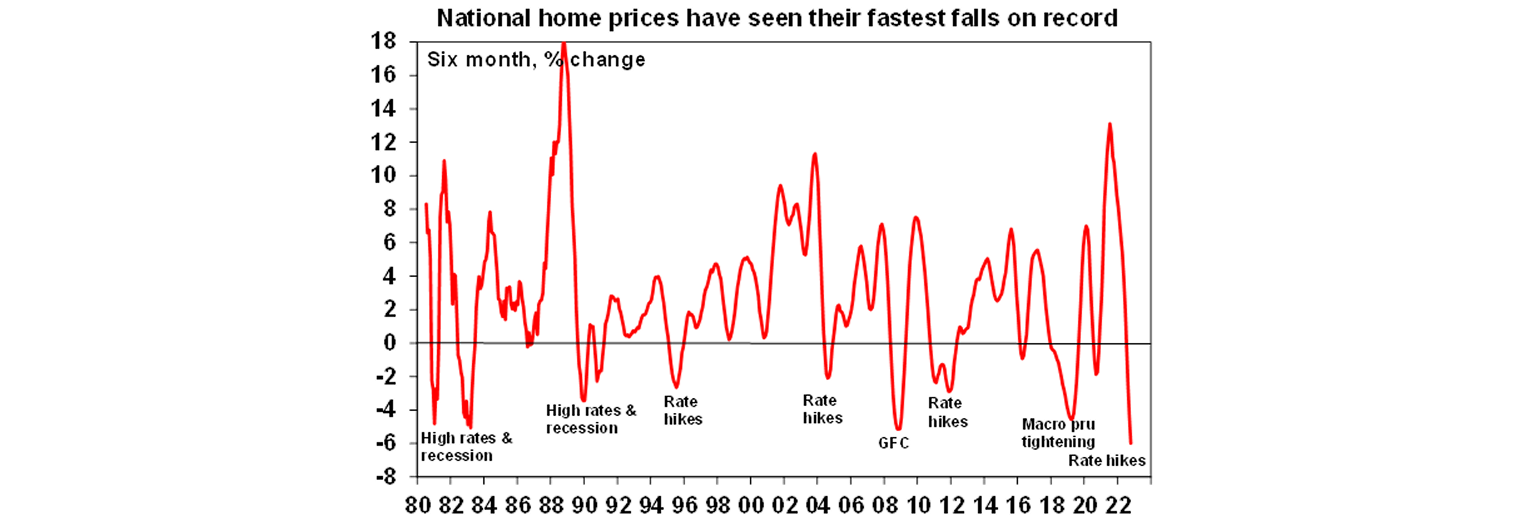
National average dwelling prices have now fallen 6% over six months, which is their fastest pace of decline on CoreLogic’s monthly records dating back to 1980.
Prices are now falling in all eight capital cities.
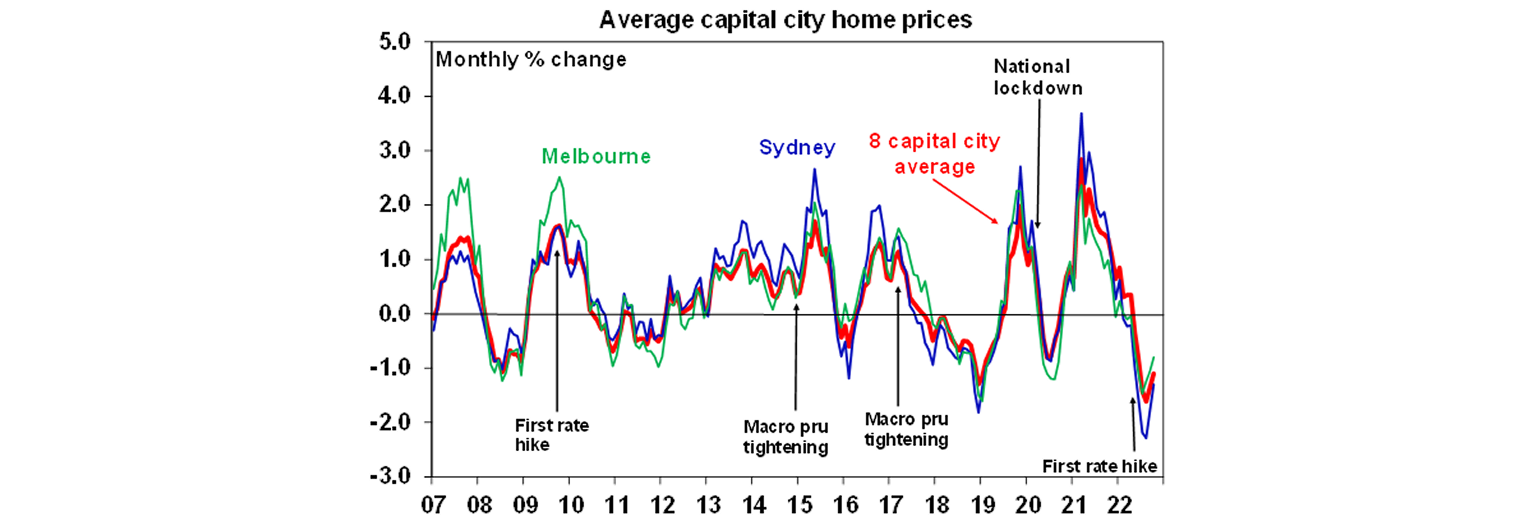
The monthly pace of falls slowed further in Sydney to 1.3% (after 9 months of falls) from 2.3% in August and in Melbourne to 0.8% (after 8 months of falls) from 1.5% in July but this is unlikely to be a sign that prices are nearing the bottom.
House prices are continuing to fall faster than unit prices, reflecting the much stronger boom in house prices and as unit prices are relatively supported by better affordability and tight rental markets.
We continue to expect a 15-20% top to bottom fall in average home prices as the full impact of rate hikes to date along with further rate hikes impact and as economic conditions slow sharply into next year resulting in rising unemployment.
Australian dwelling price growth
| October % change | 12 mths to October, % change | % change versus high | |
| Sydney | -1.3 | -8.6 | -10.2 |
| Melbourne | -0.8 | -5.6 | -6.4 |
| Brisbane | -2.0 | 8.4 | -6.2 |
| Adelaide | -0.3 | 16.5 | -0.6 |
| Perth | -0.2 | 4.0 | -0.7 |
| Hobart | -1.1 | -1.0 | -5.7 |
| Darwin | -0.8 | 4.9 | -0.9 |
| Canberra | -1.0 | 1.0 | -5.4 |
| Captial city average | -1.1 | -3.1 | -6.5 |
| Capital city houses average | -1.2 | -3.2 | -7.2 |
| Capital city units average | -0.7 | -3.0 | -4.1 |
| Regional average | -1.4 | 6.6 | -4.9 |
| National average | -1.2 | -0.9 | -6.0 |
Source: CoreLogic, AMP
The slump in home prices continues
After surging 28.6% between their pandemic low in September 2020 to their high in April national average property prices have now fallen 6%. Price falls have now spread from Sydney and Melbourne to all other capital cities and regional areas. Brisbane property prices are now falling faster than Sydney prices. Just as Brisbane continued to accelerate long after Sydney slowed as it played catchup to Sydney’s prior boom, its now falling faster than Sydney as it now looks to be catching down.
The key drivers of the downturn remain: poor affordability; rising mortgage rates; some rise in new listings, albeit it’s been modest; a rotation in household spending from goods including houses back to services; cost of living pressures making it harder to save for a deposit; and a collapse in homebuyer confidence. Rising mortgage rates are the biggest driver of the slump as the surge in fixed mortgage rates and then variable rates has substantially reduced the amount new home buyers can borrow and hence their capacity to pay for a home.
While the pace of monthly price declines slowed further in Sydney, Melbourne, Hobart and Canberra and for the national average, this likely reflects the market getting used to the initial shock of rate hikes, bargain hunters taking advantage of lower prices and vendors holding off selling with Spring listings remaining below normal levels. Auction clearance rates have also increased from a low of around 50% to around 60%, albeit volumes remain low.
But with the full impact of rate hikes to date yet to be felt, interest rates still rising and the economy set to weaken, the slowdown in price falls in some cities is unlikely to presage an imminent bottoming in home prices. Past periods of property price falls experienced a few gyrations in the pace of price declines before prices ultimately bottomed, eg in the 2017-19 down cycle. See the next chart.
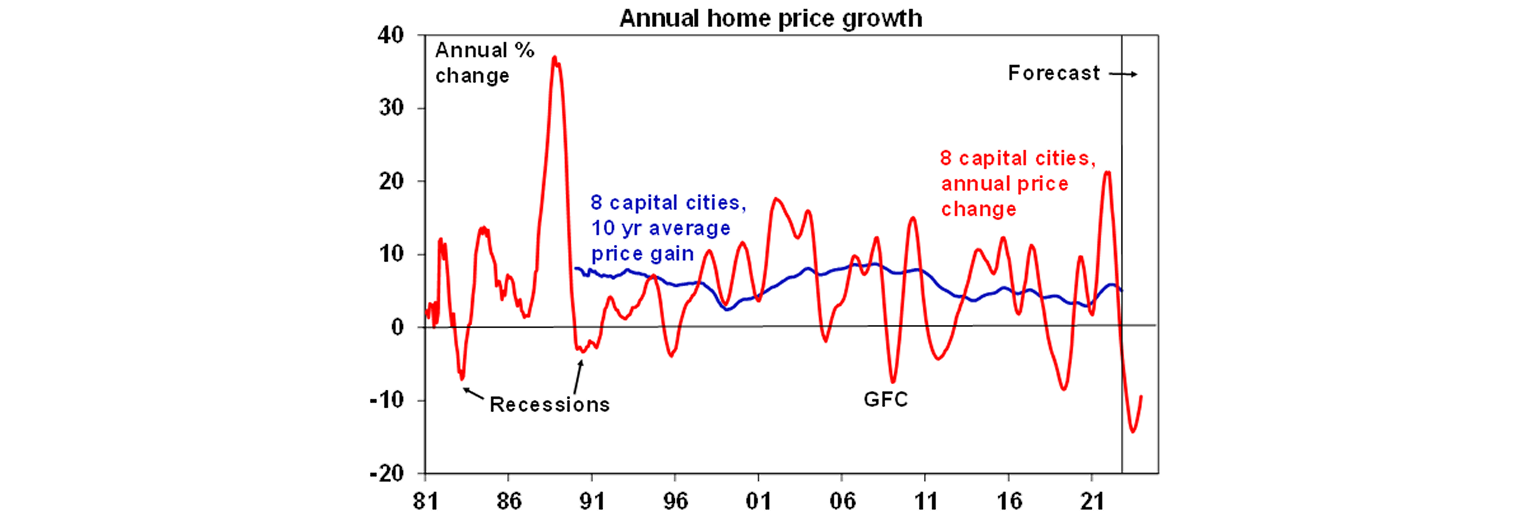
So far national average property prices are down 6% from their high over six months – which is the fastest pace of decline on CoreLogic records going back to 1980. The rapidity of the decline in home prices this time around likely reflects the de facto tightening that started with rising fixed mortgage rates a year ago, the speed of RBA cash rate hikes and heightened household sensitivity to rising interest rates flowing from much higher debt levels now along with the extent of the prior boom.
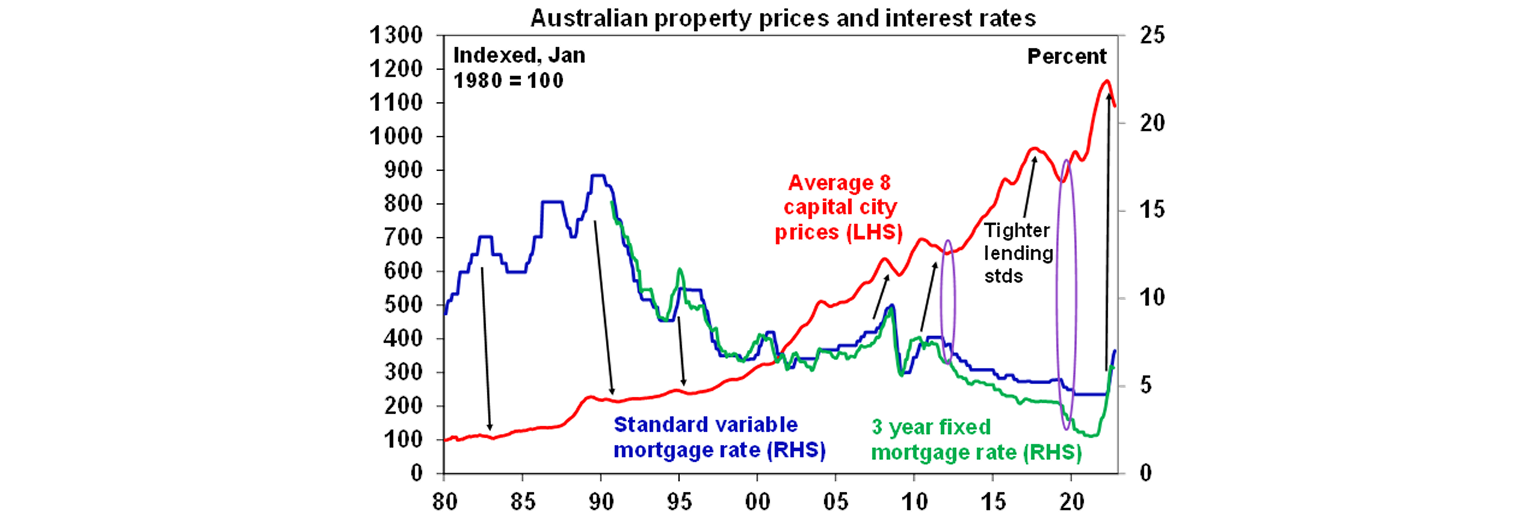
Of course, average home price levels have still only seen a flick off the top after a huge boom that saw capital city prices gain 25.5% from their pandemic lows and national average prices gain 28.6% . See the next chart. But further falls are likely.
Outlook – we continue to expect average property prices to have a top to bottom fall of 15 to 20%
We expect national average property prices to fall further over the next 9-12 months as rate hikes continue to flow through and economic conditions deteriorate though next year. Specifically: the full impact of variable rate hikes to date has yet to fully felt as it takes 2-3 months for RBA hikes to show up in actual mortgage payments; there are still more rate hikes to come; two thirds of the 40% of households with a mortgage on fixed rates will see their mortgage rate reset from around 2% to around 5 or 6% by the end of next year resulting in a sharp rise in mortgage stress; and economic conditions are set to deteriorate though next year as weaker global growth and rate hikes lead to slower growth locally and rising unemployment. The combination will result in a further weakening in home buyer demand and a potential increase in supply as some financially stressed homeowners are forced to sell.
As a result, there is a high risk that the pace of decline could reaccelerate next year, and we continue to expect national home prices will have a top to bottom fall of 15 to 20% out to around September quarter next year, of which we are only about one third of the way through.
However, the risks are on the downside. The RBA has already raised rates by more than the 2.5% interest rate serviceability buffer (assuming another rate hike today) that applied up to October last year and may soon push through the 3% buffer that has applied since then. With inflation continuing to surprise on the upside this is resulting in ever higher forecasts for the peak cash rate. We have revised our peak cash rate to 3.1% but concede that the risk is on the upside. If money market forecasts for a peak cash rate of over 4% are reached, this would more than double average household interest payments and push total (interest and principal) mortgage repayments to record highs relative to household income and likely drive a 30% or so fall in prices.
On the upside though there are several factors that will help put a floor under prices and eventually drive a recovery. These include: various government support programs (including expanded access to home deposit schemes, the Federal Government’s “Help to Buy” scheme and NSW first home buyers likely swapping stamp duty for land tax next year); the tight rental property market which is pushing up rental yields and may support investor demand; and rapidly rising immigration levels. But for now, the property market will be dominated by the cyclical impact of rising interest rates.
A recovery in prices is likely to require interest rates to start falling. This can be seen in the last two major upwards cycles in property prices that started in 2012 and 2019 where property prices did not start to turn up until interest rates started to fall. See the purple ovals in the last chart. Right now the RBA is still hiking rates and we don’t anticipate rate cuts to start until late next year at the earliest.
You may also like
-

Oliver's insights - Why have Australian living standards “fallen” and how do we fix it? For the last few years there has been much talk of a “cost-of-living” crisis in Australia and of “falling living standards”. This has flared up again lately with the pickup in inflation resulting in a renewed fall in real wages. -

Weekly market update - 10-07-2026 Ceasefire over but markets are also over the war, Why oil prices can't go too low or too high, Is AI adding to inflation risk or taking it away, and Australia’s wage problem. -

How to protect yourself from phishing and impersonation scams Phishing scams can look like everyday messages – emails, texts or calls. Learn the signs and simple steps to protect your money and personal information.
Important information
Any advice and information is provided by AWM Services Pty Ltd ABN 15 139 353 496, AFSL No. 366121 (AWM Services) and is general in nature. It hasn’t taken your financial or personal circumstances into account. Taxation issues are complex. You should seek professional advice before deciding to act on any information in this article.
It’s important to consider your particular circumstances and read the relevant Product Disclosure Statement, Target Market Determination or Terms and Conditions, available from AMP at amp.com.au, or by calling 131 267, before deciding what’s right for you. The super coaching session is a super health check and is provided by AWM Services and is general advice only. It does not consider your personal circumstances.
You can read our Financial Services Guide online for information about our services, including the fees and other benefits that AMP companies and their representatives may receive in relation to products and services provided to you. You can also ask us for a hardcopy. All information on this website is subject to change without notice. AWM Services is part of the AMP group.