


Oliver's insights
Bubble trouble – is AI enthusiasm driving a bubble in shares?
Rich share market valuations are warning of the risk of a pullback in shares amidst fears of a bubble and it’s possible that enthusiasm for AI has run ahead of itself. But the fundamentals behind this are arguably far stronger than they were at the time of the late 1990s tech boom.
6 min read

Key points
Rich share market valuations are warning of the risk of a pullback in shares amidst fears of a bubble and it’s possible that enthusiasm for AI has run ahead of itself. But the fundamentals behind this are arguably far stronger than they were at the time of the late 1990s tech boom.
For investors and super fund members, the danger in trying to time corrections and bear markets is that you miss out on longer-term gains. The key is to adopt an appropriate long-term investment strategy and stick to it.
Introduction
Lately, some commentators and investment experts have been expressing concern about a bubble in equity markets with some referring to excessive optimism about AI and drawing comparisons to the late 1990s tech boom. Some have been advocating holding a higher proportion of funds in cash in response. This note looks at the key issues and what it means for investors. As the concerns centre on the direction-setting US share market, we will focus mainly on that, as any fall there will impact Australian shares.
Why the bubble worries?
The concerns about a bubble reflect a combination of factors:
First, shares have been enjoying very strong gains led by the US with most at or around record levels. The US share market is up 35% from its April US tariffs driven low & has returned 25%pa over the last 3 years with global shares returning 23%pa and Australian shares 15%.
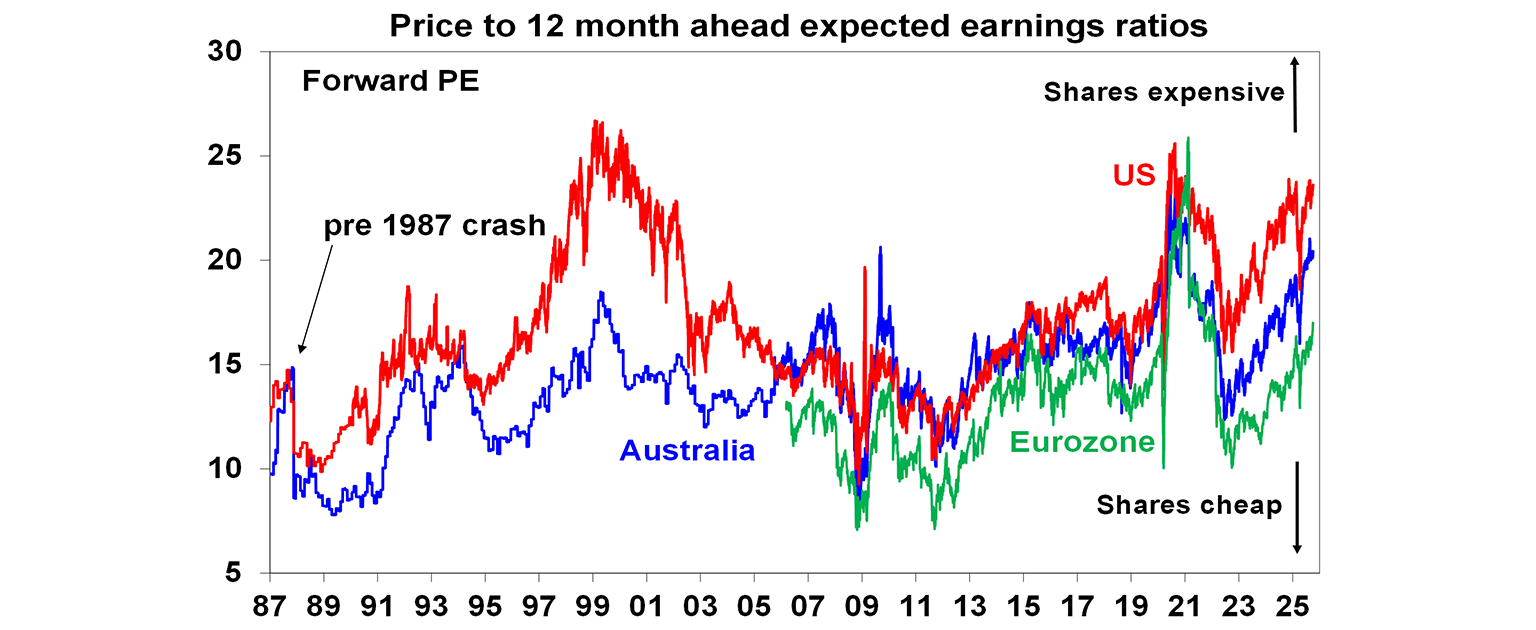
Second, valuations are stretched with the forward price to earnings ratio on US shares at 23.6 times, not far below the 1999-2000 tech boom high of 26 times. The PE on Australian shares is well above its tech boom high. Note PEs were above current levels in late 2020/early 2021 due to distortions caused by the pandemic.
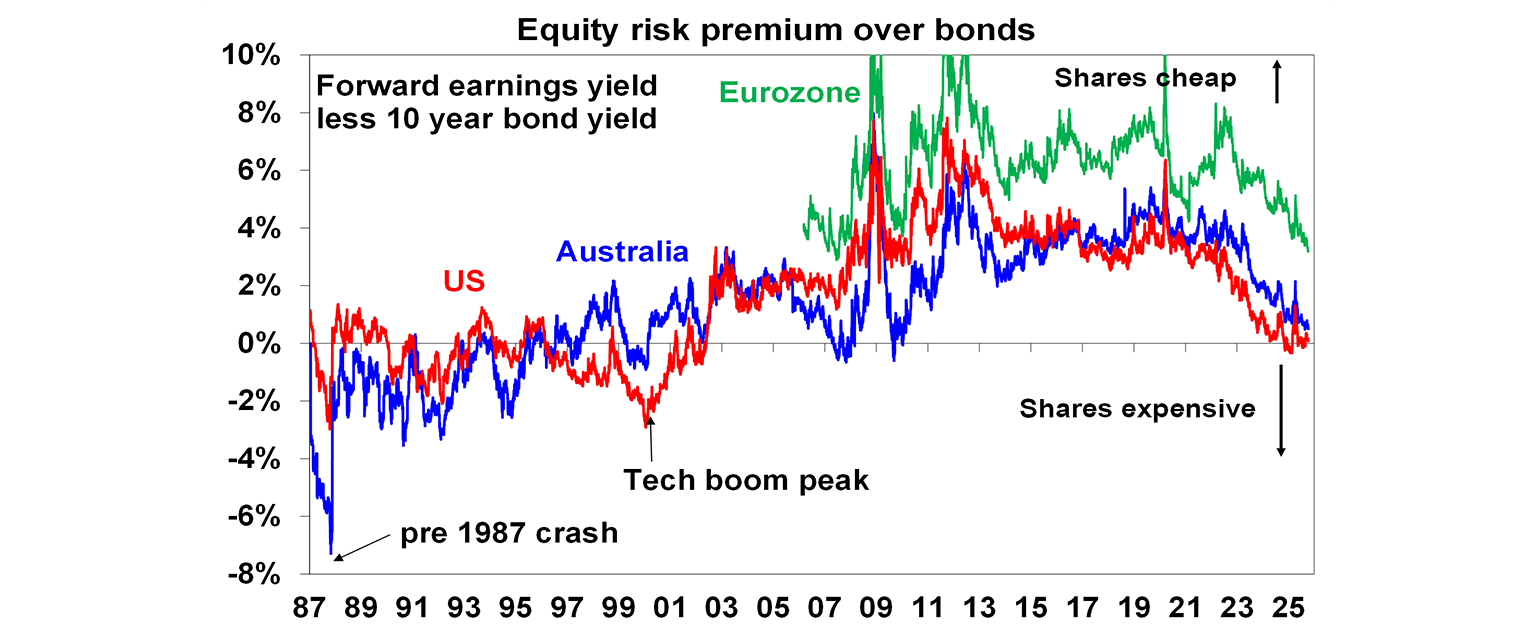
Related to this, the risk premium offered by shares over bonds – the gap between the forward earnings yield (inverse of the forward PE) and the 10-year bond yield - is very low in the US and Australia.
Third, the US share market has been disproportionately driven by a group of tech stocks. For example, the Magnificent Seven stocks (Apple, Microsoft, Alphabet, Amazon, Nvidia, Meta and Tesla) have been accounting for 50% or more of the gains in the S&P 500 since 2023 despite being about one third of market capitalisation. This arguably leaves US shares very vulnerable to the performance of this narrow group of tech/AI focussed companies.
Fourth, this narrow group of stocks have surged in value over the last decade initially reflecting FAANG (Facebook, Apple, Amazon, Netflix & Google) enthusiasm that has morphed into AI enthusiasm since Chat GPT was released in 2022. As can be seen in the next chart the Magnificent Seven group of stocks have risen more than 30-fold since 2015 dwarfing various other “bubbles” over the last decade including the tenfold rise in the tech heavy Nasdaq into 2000.

Fifth, while there is a high level of corporate interest and investment in AI, evidence that they are reaping a benefit is mixed with many projects at the pilot stage with issues around data, culture, leadership and skills. In other words, AI hype may have run ahead of the reality.
Sixth, speculative assets like gold and bitcoin have also been strong, suggesting speculative attitudes may be starting to take hold.
Finally, share markets appear to be disconnecting from a long worry list that includes: uncertainty around US tariffs and their impact; the slowing US jobs market; messy US economic policies and the latest shutdown; uncertainty as to whether the Fed will cut rates as much as the 4-5 cuts the US market is expecting; concern about public debt sustainability in the US, France, UK and Japan; & elevated geopolitical risks particularly with escalating tensions between Russia and NATO and the risk of secondary tariffs on countries importing Russian oil.
But could this time be different?
Over the years I have seen numerous bubble calls only for the market to keep going up or see nothing more than a brief correction. There are several arguments against the bubble call making it all a shade of grey:
First, while the risk premium offered by shares is low, bond yields today are much lower than when the tech boom peaked in early 2000 when they were over 6%, so the equity risk premium is at least better than it was back then particularly in the US.
Second, while the chart above showing a comparison of “bubbles” highlights the extreme gains in the Magnificent Seven it probably exaggerates the case for a bubble. It shows gains much bigger than the tech heavy Nasdaq going into 2000, but this time around Nasdaq has not gone up anywhere near as quickly. There is a danger in focussing on a select group of stocks – just as there was last decade when the FAANG stocks were said to be in a bubble. Perhaps the comparison should be the “dot com” stocks of the late 1990s.
But here there is a notable difference. Dot com stocks were making little in the way of profits, but Magnificent Seven stocks are making huge profits as a group with very strong profit growth, running around 30%yoy. Profit growth for US tech companies generally is around 17%yoy. More broadly US company profit growth has continued to surprise on the upside and is likely to have been around 11.5%yoy in the September quarter.
Fourth, while initial results on the benefits of corporate investment in AI are mixed, it was inevitable that this will take time, but anyone who has used AI tools can see the huge benefit they offer in doing things faster (like doing the research for these notes!) and boosting productivity. Related to this AI systems, or specifically large language models, are very data and computationally intensive and will require a significant build out of data centres which in turn will mean high levels of business investment and demand for raw materials like copper.
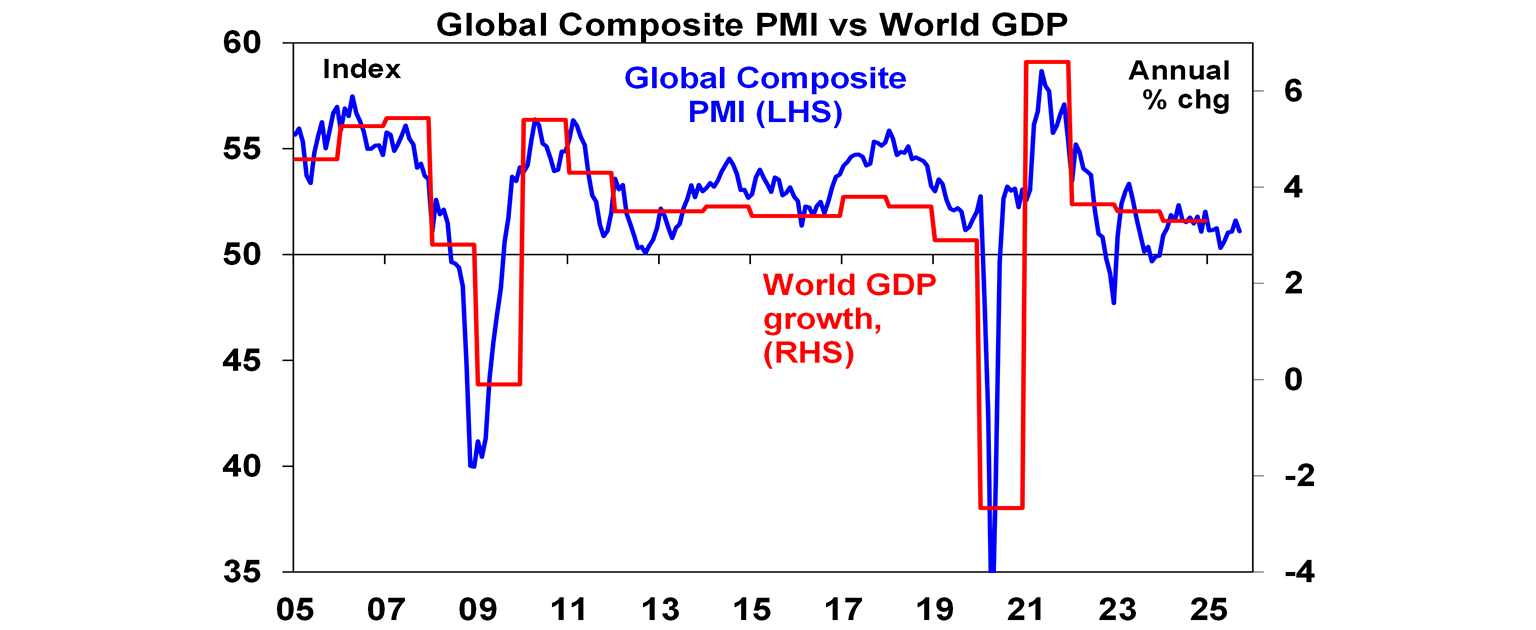
Fifth, while global business conditions PMIs – i.e. surveys of how businesses are faring – have slowed they are still at levels consistent with reasonable economic growth. In other words, there is no sign of recession which is important because major bear markets in shares tend to be associated with recession – although this is no guarantee as share markets often lead the way.
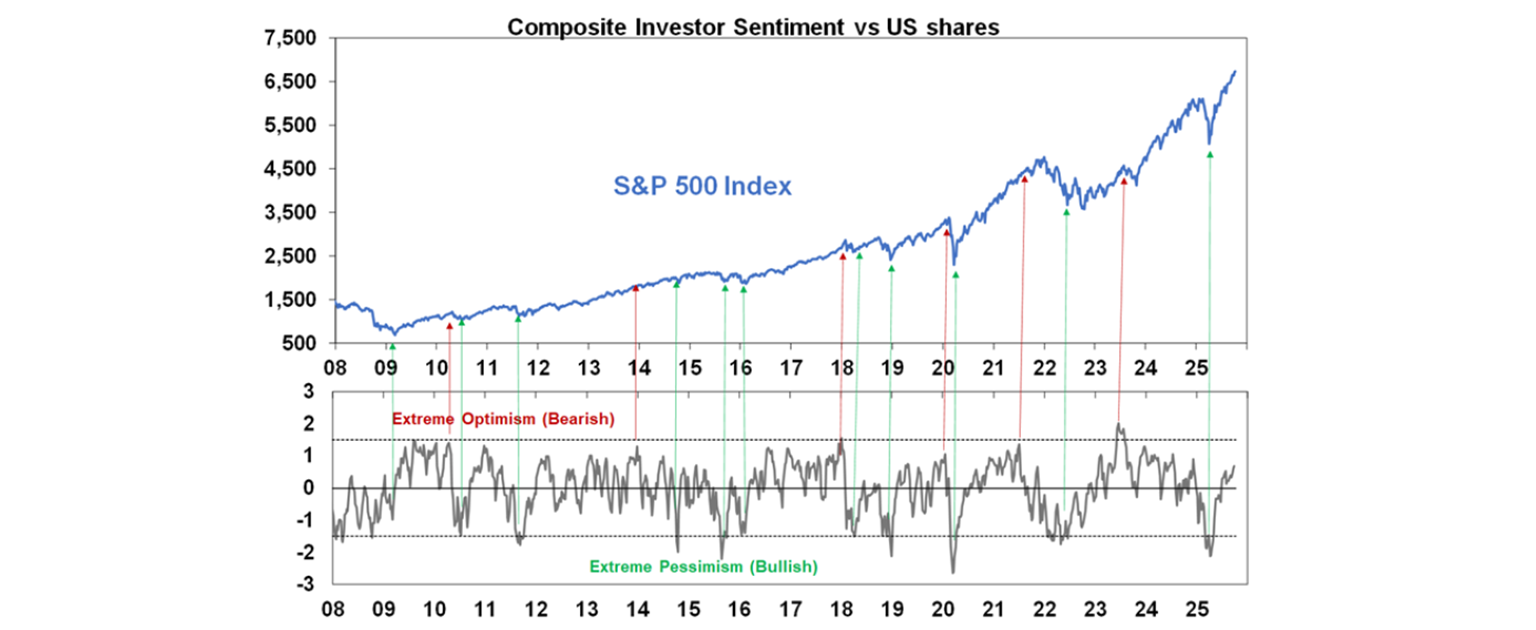
Sixth, measures of US investor sentiment show optimism, but they are arguably not yet indicative of euphoria towards shares that may be associated with a major share market top. See the next chart.
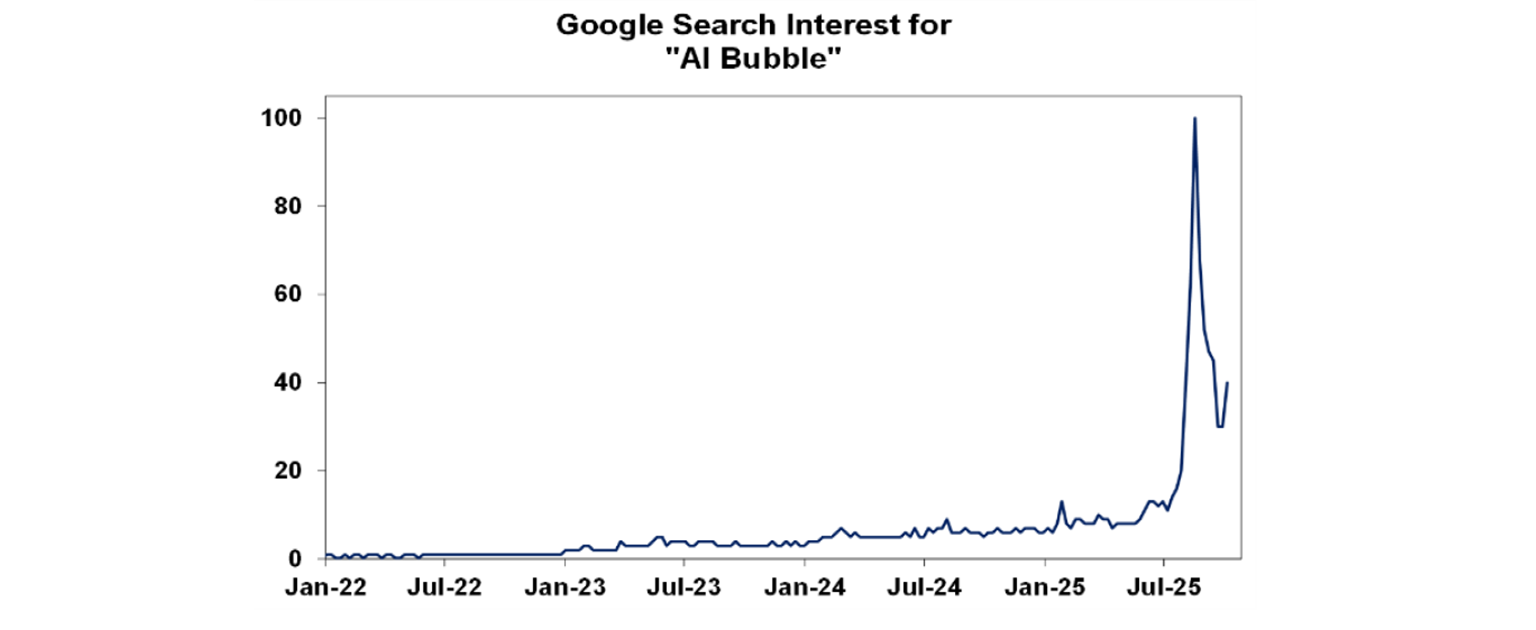
Related to this, bubbles don’t normally see lots of people doing bubble searches online so the surge in Google searches for an “AI bubble” since June may be a positive sign from a contrarian perspective, i.e. that we are not in a bubble yet.
Finally, while there is no doubt a speculative element in investor demand for gold and bitcoin pushing their prices up, their surge partly owes to demand for a hedge against feared unsustainable public debt levels, worries that this might be monetised (i.e. where governments allow higher inflation to reduce the real value of debt) and geopolitical threats. So, record high levels of both are not necessarily a sign of a broader speculative mania.
Implications for investors
What are investors to make of all of this? There are four key points.
Rough periods – corrections and sharp bear markets – are normal in share markets and are the price we pay for the higher returns compared to defensive assets they provide over the long term.
Rich share market valuations are warning of the risk of a pull back in shares and it’s possible that enthusiasm for AI has run ahead of itself. But the fundamentals behind this are arguably far stronger than they were at the time of the late 1990s tech boom.
Either way it’s very hard to time share market moves. There were warnings of “irrational exuberance” in US shares in 1995, and it went on for another five years. The danger in trying to time corrections and bear markets is that you miss out on the longer-term gains.
The key is to adopt a long-term investment strategy appropriate for your risk tolerance, financial situation and age and stick to it.
Dr Shane Oliver
Head of Investment Strategy and Chief Economist, AMP
You may also like
-

Weekly market update - 17-07-2026 Pressure remained on Korean shares which are down 25% from their high on worries about a bubble, profit taking after shares more than doubled, heavily leveraged retail investors closing positions, tightened regulations around buying singe stock leveraged ETFs and not helped by the Bank of Korea raising rates with more hikes likely. -

Oliver's insights - Why have Australian living standards “fallen” and how do we fix it? For the last few years there has been much talk of a “cost-of-living” crisis in Australia and of “falling living standards”. This has flared up again lately with the pickup in inflation resulting in a renewed fall in real wages. -

Weekly market update - 10-07-2026 Ceasefire over but markets are also over the war, Why oil prices can't go too low or too high, Is AI adding to inflation risk or taking it away, and Australia’s wage problem.
Important note
While every care has been taken in the preparation of this document, neither National Mutual Funds Management Ltd (ABN 32 006 787 720, AFSL 234652) (NMFM), AMP Limited ABN 49 079 354 519 nor any other member of the AMP Group (AMP) makes any representations or warranties as to the accuracy or completeness of any statement in it including, without limitation, any forecasts. Past performance is not a reliable indicator of future performance. This document has been prepared for the purpose of providing general information, without taking account of any particular investor’s objectives, financial situation or needs. An investor should, before making any investment decisions, consider the appropriateness of the information in this document, and seek professional advice, having regard to the investor’s objectives, financial situation and needs. This document is solely for the use of the party to whom it is provided. This document is not intended for distribution or use in any jurisdiction where it would be contrary to applicable laws, regulations or directives and does not constitute a recommendation, offer, solicitation or invitation to invest.