


Econosights
Is China winning the trade war?
China’s economy is slowing, but resilient exports (especially high-tech goods and rare earths) lessen its need to respond to US pressures.
7 min read

Key points
China’s economy is slowing, but resilient exports (especially high-tech goods and rare earths) lessen its need to respond to US pressures..
China’s long-standing dominance in rare earths and critical minerals guarantees its strategic advantage over the US and allies.
In the near term, the US still has domestic and financial market constraints, allowing China to have a stronger negotiating position.
Introduction
The US trade war with the world has been a roller coaster throughout this year. Half a year since Liberation Day, the big unknown for US tariffs remains China, where the current effective tariff rate is already above 40% (and is at risk of being reverted to around 145% once the current trade “truce” expires in November). Since this trade truce in August, headlines have resurfaced with a series of tit-for-tat measures, involving disputes over soybeans, chips, port fees, rare earths, and cooking oil.
With China’s slowing GDP growth against resilient US economic growth, which country holds the upper hand in this trade war? We’ll explore in this edition of Econosights.
First… the negatives from China
There has been no shortage of negative news surrounding China throughout the last three years, which likely provided Trump with the perfect backdrop to start the second-round trade war (after his first term). Chinese economic activity has been losing momentum, continuing its downward trend from the early 2010s (when GDP growth was averaging 10%pa) to the most recent reading of just 4.8% in the September quarter of 2025. As the property market cooled, consumer sentiment worsened, and spending slowed, the government has pivoted to more aggressive fiscal policy stimulus and property support measures in October 2024.
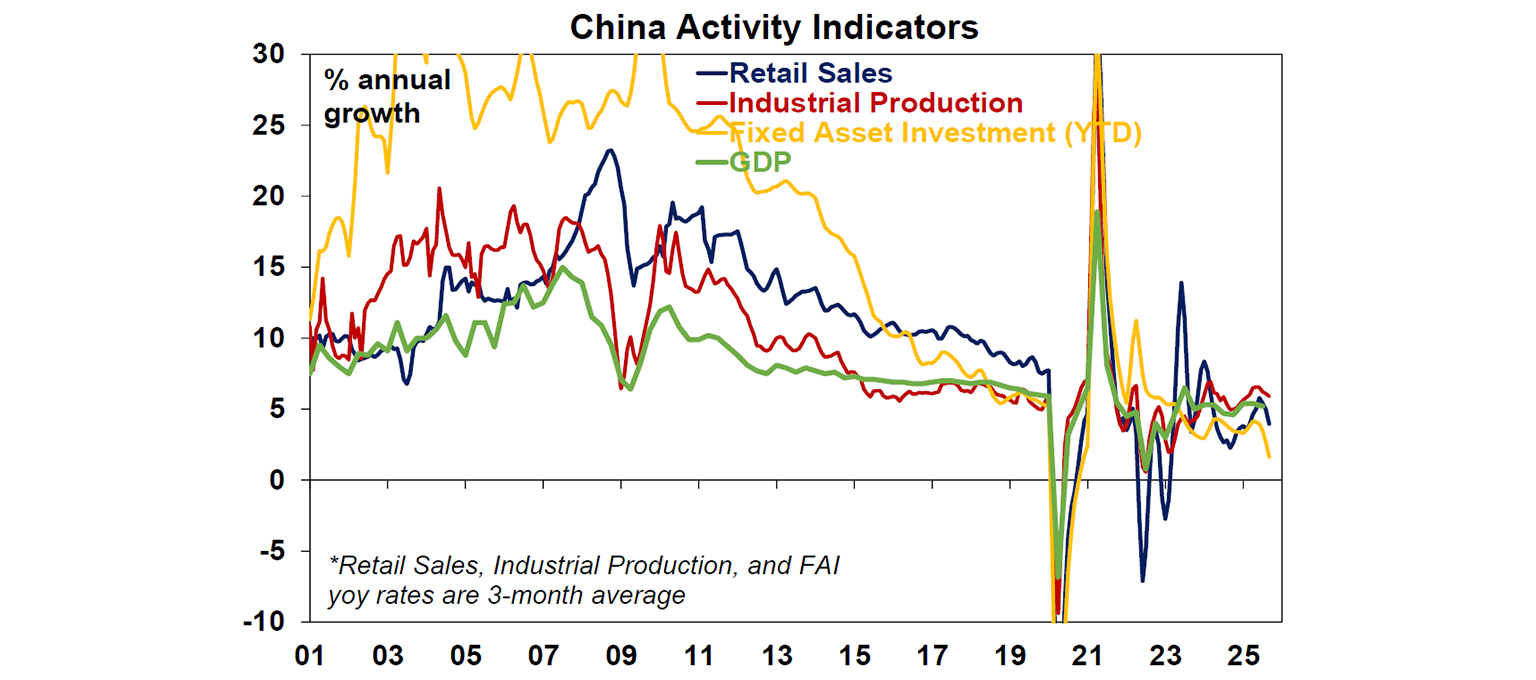
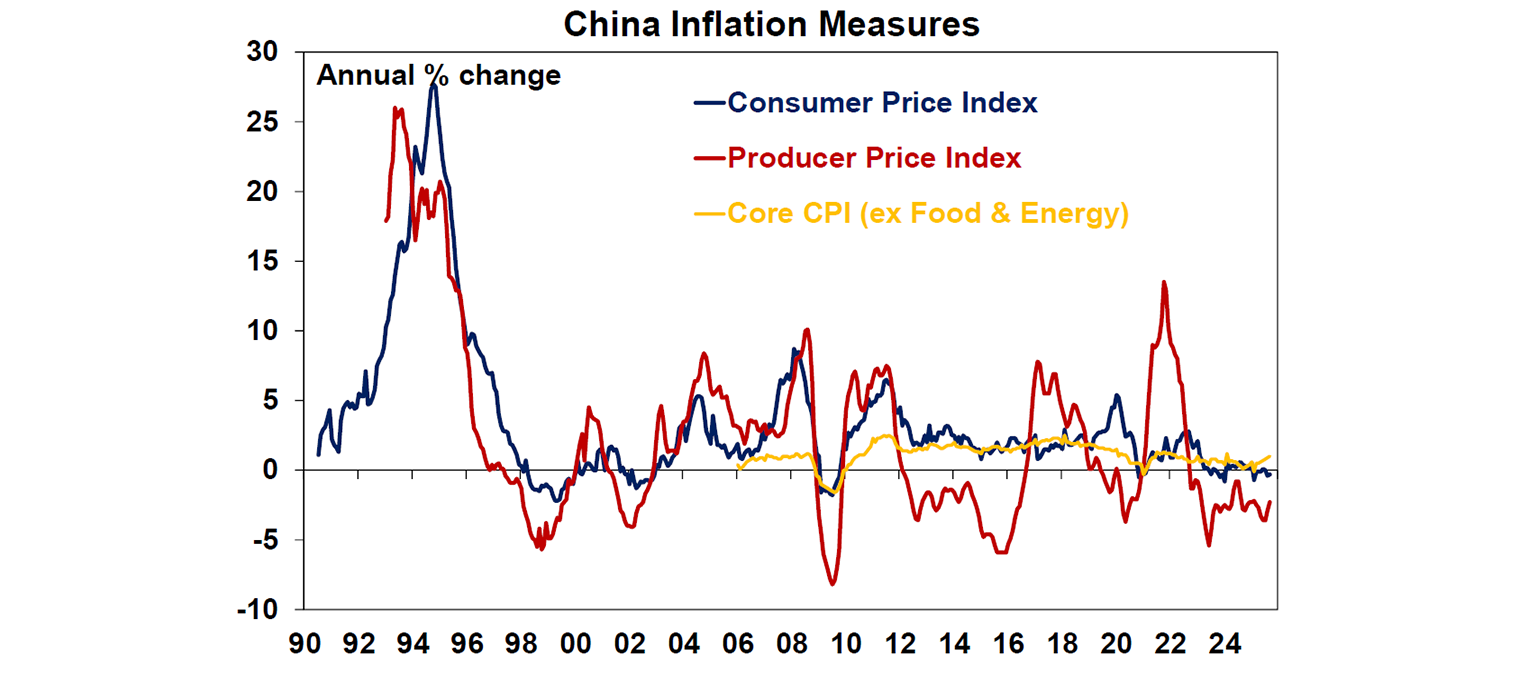
Despite a short-lived spike in retail sales from the stimulus measures, recent economic data has resumed its sluggish path. Retail spending has been growing at a pace of 4.4% over the year to September, compared to the 10% rate seen throughout the 2010s. Industrial production is the bright spot – after all, China is the “factory of the world” – growing at an annual pace of 6.1% to September. But the factories are making more than what consumers are willing to buy (partially thanks to government incentives to produce), and thus prices are outright falling. While inflation has improved, it is mainly being driven by services rather than goods, with producer prices in deflation for the last 3 years.
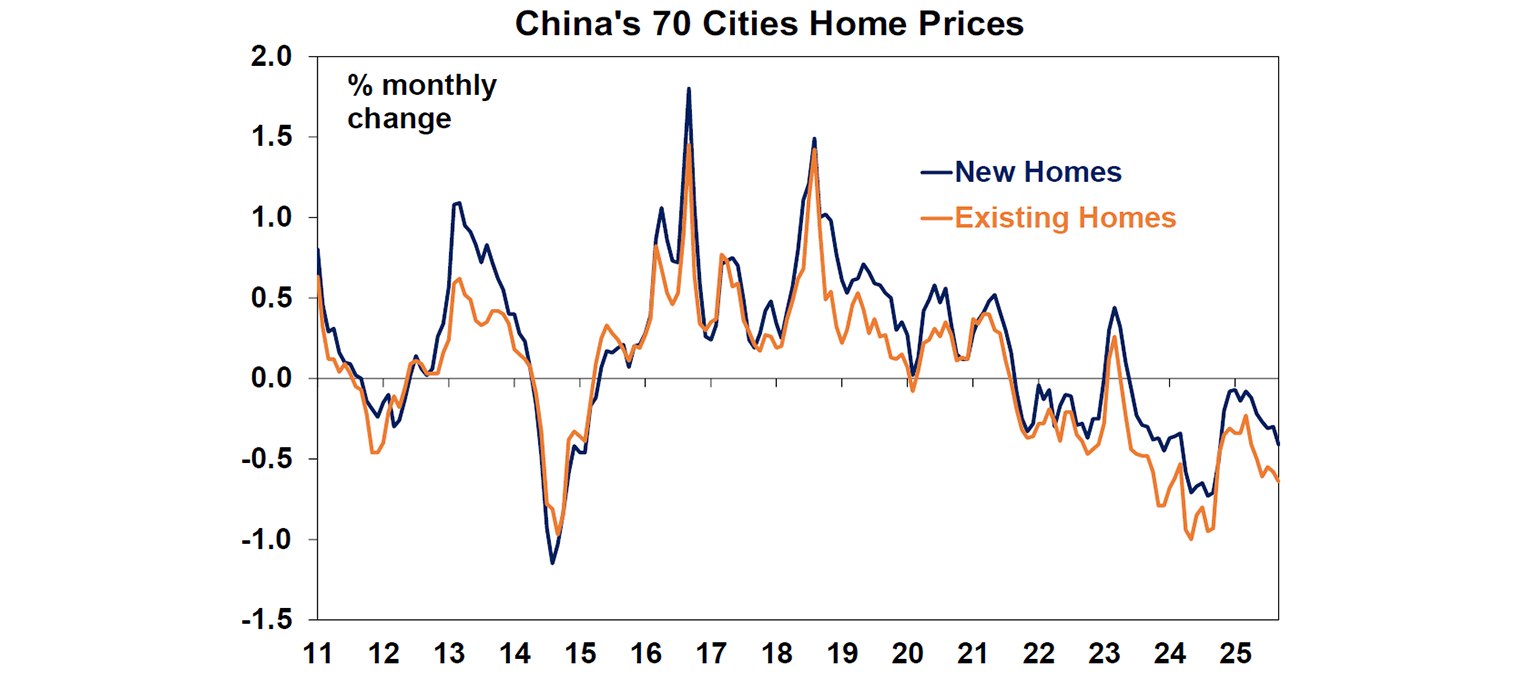
The housing slump remains the key weakness with the Chinese economy. Home prices have been falling since 2021 and are now down 11% from the peak. The core issue with the property bust is structural rather than cyclical and thus very hard to reverse from temporary government stimulus. Culturally, Chinese households have a high savings rate (at over 30% compared to <5% in Australia and the US), and these savings tend to be channelled into the leveraged property market. As a result, household wealth is tightly related to the property market cycle (with a homeownership rate of ~90%). Lower household wealth reduces consumption and economic growth, making the deflation spiral harder to break.
But China’s trade is still holding up
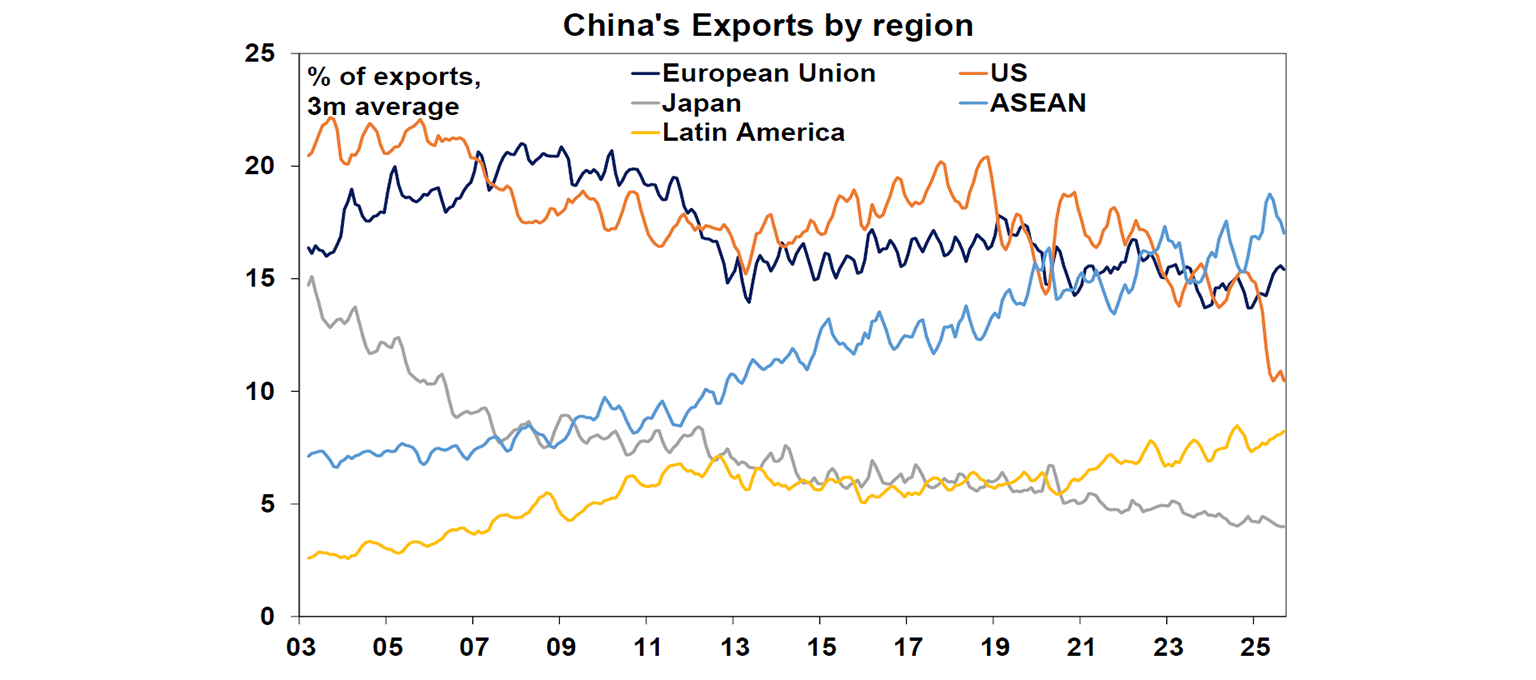
Despite these challenges, we continue to see China’s economy growing at around 5% annually, reducing the urgency for the government to cater to US demands. A key driver for growth has been the resilient trade surplus, despite rising tariff rates on exports to the US, supported by the shifts in export destinations and product mixes as well as higher commodity prices. Year to date, nominal export growth has averaged 6%yoy, accelerating to over 8% by September. While year-to-date exports to the US are down 17%, they have been offset by growing trade with ASEAN countries (+15%), the EU (+8%), and most major trading partners including Hong Kong, Taiwan, India, and other EM countries.
Tariffs still hurt exports, particularly within traditional manufactured goods sectors such as clothing (-2.5%yoy), toys (-8.3%yoy) or furniture (-4.8%yoy). However, mechanical and electrical products grew 8.6% over the year while high tech products rose 7.1%. More strikingly, exports of chips are now up more than 32%yoy in September, and rare earth ores and minerals are now 97% higher than a year ago.
Clearly, China has pivoted and is no longer just a low-cost factory for the world. Back in 2015, the government launched the “Made in China 2025” policy, aiming to transform the country into a manufacturing superpower in key sectors including biotech, semiconductors and electric vehicles. Ten years on, the policy has been widely considered largely achieved, helping exports and economic growth hold up despite trade war threats.
And rare earths remain a trump card for China
This long-term strategy has allowed China to build leverage over the years, with its latest trump card being “rare earths”. Rare earth metals – a group of 17 minerals used in various high-tech manufacturing – are not necessarily rare (even the rarest rare earth is more abundant than gold!). Their names stemmed from three factors: 1) deposits are geographically concentrated (with China accounting for half of the world’s reserves); 2) extraction is intensive and environmentally toxic and 3) processing is very complex.
Since the 90s, China has rapidly scaled up rare earth production. The further downstream in the supply chain, the more dominant China is: it owns half of global rare earths’ reserves, but mines about 70% of production, and processes around 90% of the extraction.
Given that rare earths are used in technology everywhere from cell phones, semiconductors, energy production, electric vehicles, medical devices, to defence technology; the US is exceptionally vulnerable to the lack of reserves and processing capacity. Currently, the US imports 70% of its rare earth metals from China, and even its fighter jets rely on rare earths.
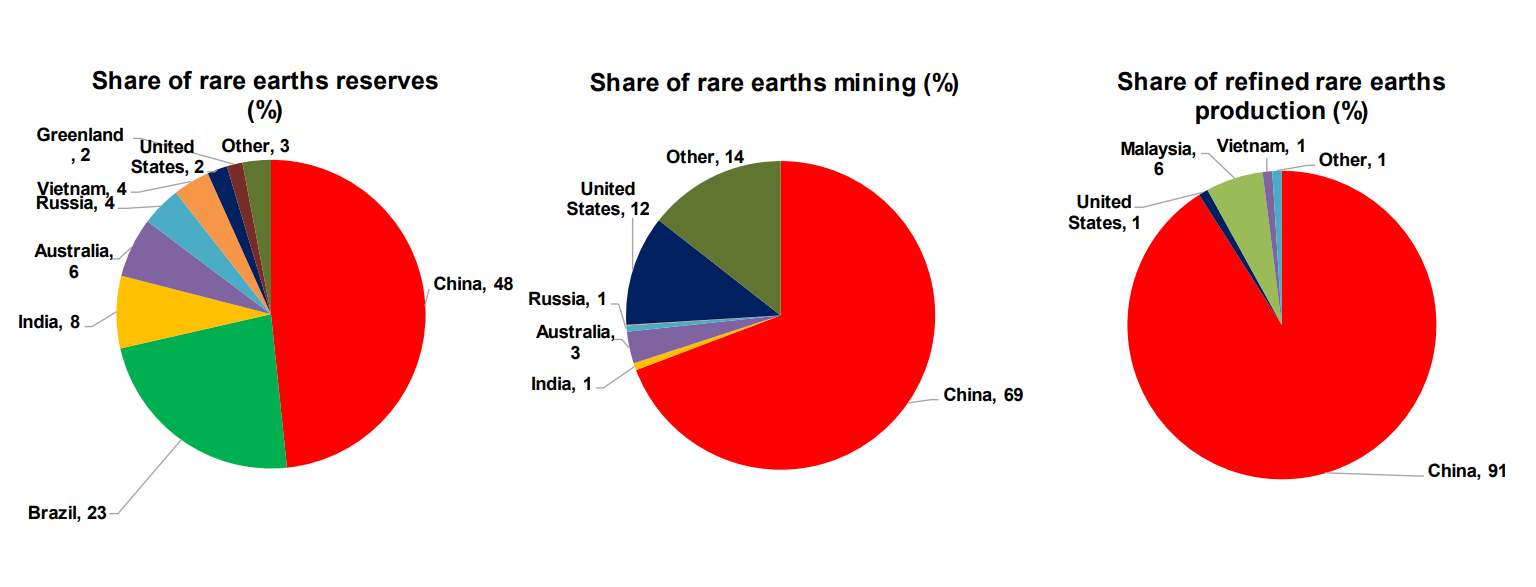
While Trump has signed an Executive Order to “immediately” make the US the “leading producer and processor” of rare earths, it is nearly impossible not to rely on China in the meantime. The US lacks full rare earths separation capacity (see the third chart above); and as a result, China has repeatedly used export controls either as a bargaining chip or as a retaliation tactic.
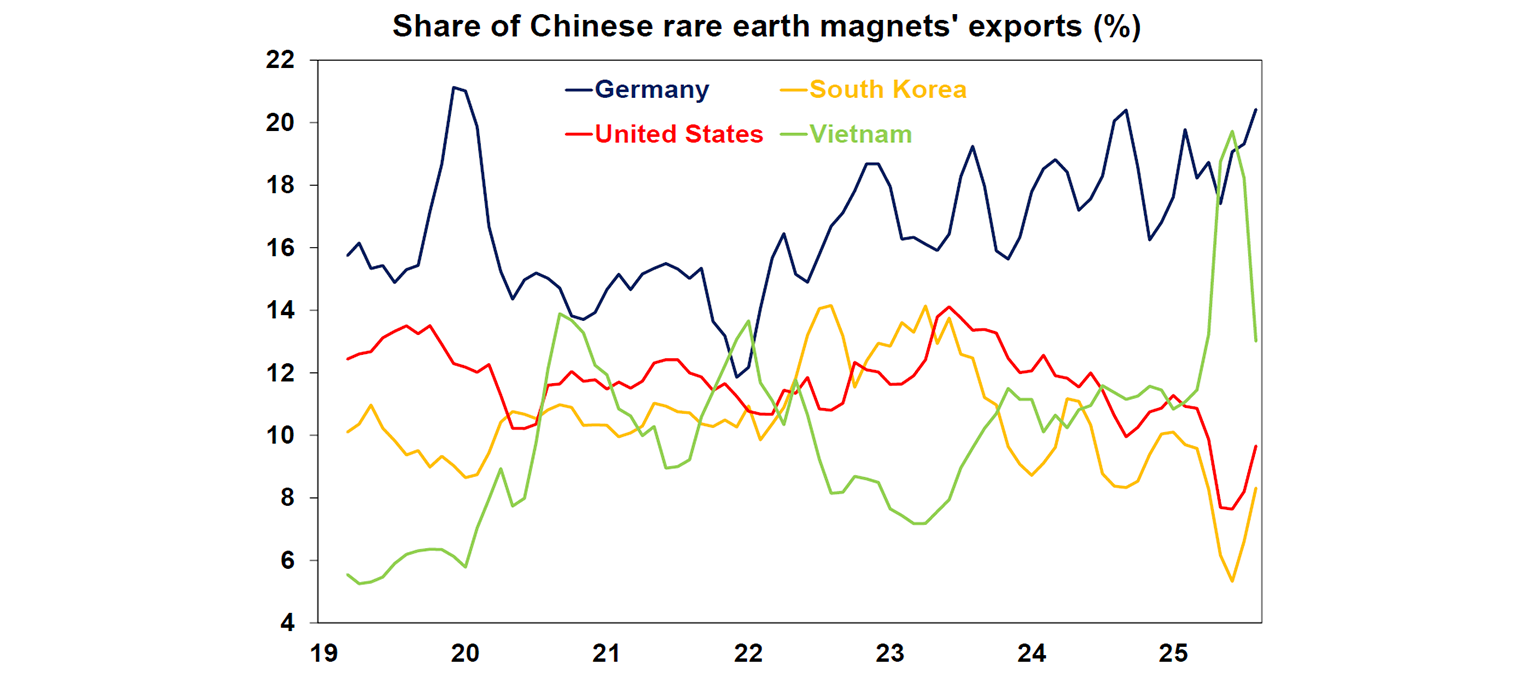
In the near term, the US has more to lose on the rare earths front. As global demand for rare earths is expected to rise, driven by AI and the energy transition (the IEA projects 5% annual growth over the next five years), China can easily find other customers for their fungible rare earth products. The below chart shows Germany and Vietnam are bigger customers for China’s rare earth magnets than the US.
Both China and the US have a long list of leverages
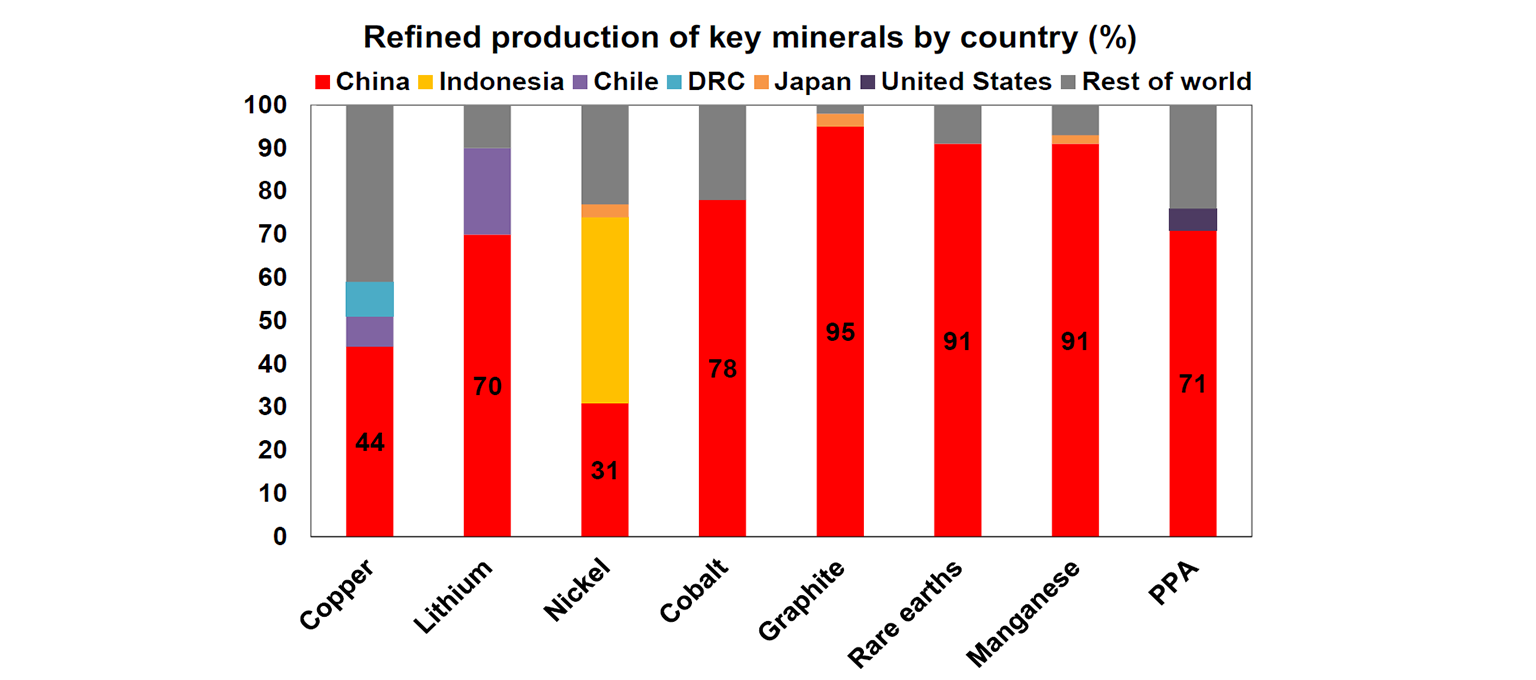
Besides rare earths, China also boasts other sources of leverage to deploy in the case of a prolonged trade war. China holds a large majority in refined production of most key minerals essential to EV, chip, and energy infrastructure – see the chart below. The International Energy Agency also projects that China will continue to be the dominant supplier for these minerals through to 2035, despite diversification efforts from the US and its allies. And finally, the US still requires access to a significant Chinese market for various goods including aircrafts, agricultural products, and chips (US chipmakers are dependent on China for up to 40% of sales).
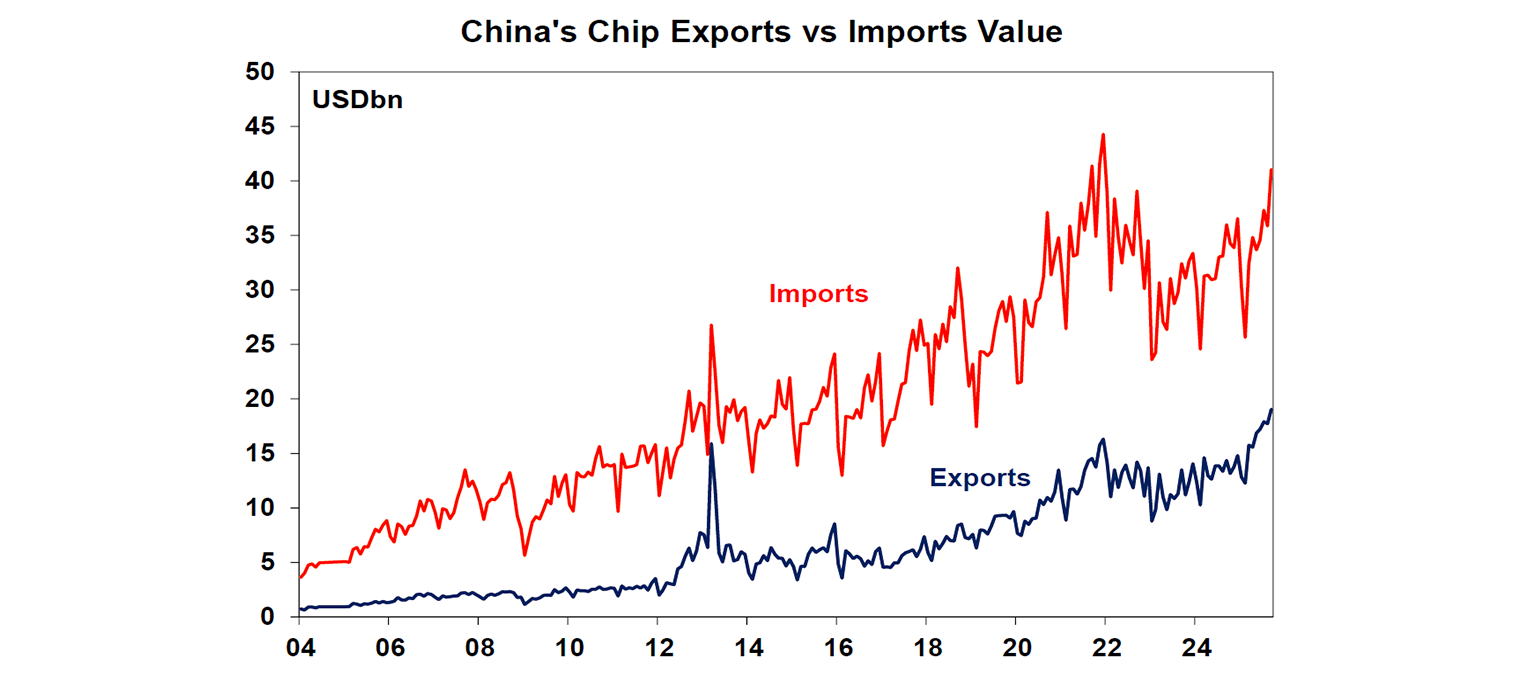
But fundamentally, China still needs the US for high-end chips to train large AI models, build telecommunication infrastructures, or boost their own smart manufacturing supply chain. The chart below shows that China, in fact, has a trade deficit in integrated circuit trade, given that Chinese domestic capacity specialises in larger legacy chips. It is widely estimated that China is still five years behind the US and Taiwan (though the gap is narrowing).
Ultimately, there is a similarity between China’s advantage in raw input materials, the US edge in chip design, or even Taiwan’s strength in chip manufacturing. They all stemmed from long-term industry specialisation, which allowed each country to specialise, scale rapidly, and carve out a durable national advantage that is very challenging to replicate in the short term. The mutual dependency means a complete decoupling between the US and China unlikely. As a result, our base case is that some de-escalation is still possible from the latest threats, though there will be noise as both sides attempt to leverage their “trump cards”.
So, who is winning?
Overall, in the short term, China has an upper hand in negotiation for three reasons:
While domestic economic growth is still slowing, 4.8% growth rate is not a recessionary level, and softening growth has not been driven by tariffs. Past attempts at stimulus measures have shown that they worked, so the Chinese government will only deploy them as necessary.
China has clear dominance in the supply chain of critical minerals and raw materials for emerging technology. At least in the next few years, China is not dependent on just the US as a customer.
The US faces more domestic and market constraints. Trump still sees the financial markets, whether shares or bonds, as important to his success. Every threat to raise tariffs to prohibitively high levels this year has been followed by a backdown and efforts to convince investors that “it will all be fine!” or commonly referred to as the TACO (Trump Always Chickens Out) trade. More importantly, as mid-term elections come closer, the government will need to refocus on both containing inflation and addressing slowing jobs growth – neither of which is helped by trade wars or policy uncertainty.
However, in the long term, national security concerns will see both countries race to patch up their respective weaknesses (i.e. rare earths supply for the US and chipmaking capabilities for China). Ultimately, a more fragmented and less specialised supply chain only means that productivity won’t be as high as it could be, and may well threaten the superiority of the US market in the next century.
You may also like
-

Weekly market update - 17-07-2026 Following the renewed escalation in the US/Iran conflict, the Strait of Hormuz is effectively closed again with Iran attacking ships and the US attacking Iran and blockading its ports. Both are now back to attacking energy infrastructure which is a signficant & concerning escalation. -

Oliver's insights - Why have Australian living standards “fallen” and how do we fix it? For the last few years there has been much talk of a “cost-of-living” crisis in Australia and of “falling living standards”. This has flared up again lately with the pickup in inflation resulting in a renewed fall in real wages. -

Weekly market update - 10-07-2026 Ceasefire over but markets are also over the war, Why oil prices can't go too low or too high, Is AI adding to inflation risk or taking it away, and Australia’s wage problem.
Important information
Any advice and information is provided by AWM Services Pty Ltd ABN 15 139 353 496, AFSL No. 366121 (AWM Services) and is general in nature. It hasn’t taken your financial or personal circumstances into account. Taxation issues are complex. You should seek professional advice before deciding to act on any information in this article.
It’s important to consider your particular circumstances and read the relevant Product Disclosure Statement, Target Market Determination or Terms and Conditions, available from AMP at amp.com.au, or by calling 131 267, before deciding what’s right for you. The super coaching session is a super health check and is provided by AWM Services and is general advice only. It does not consider your personal circumstances.
You can read our Financial Services Guide online for information about our services, including the fees and other benefits that AMP companies and their representatives may receive in relation to products and services provided to you. You can also ask us for a hardcopy. All information on this website is subject to change without notice. AWM Services is part of the AMP group.