


What is happening with the supply of new homes in Australia?
Most economists agree that to make real progress on housing affordability, the key is to lift housing supply. The Federal government has an aim to build 1.2 million, new, well-located homes over five years.
8 min read

Key points
Australia has had a housing undersupply problem since the mid 2000’s, helping to continually push up home prices and being one of the main drivers of the “affordability” problem.
The Labor government is arguably dedicating more time and expenditure on housing incentives to states and territories than any other government in recent history.
However, productivity challenges in construction - particularly in housing, overregulation and labour and material shortages - are preventing housing supply from lifting enough to meet demand.
Introduction
Most economists agree that to make real progress on housing affordability, the key is to lift housing supply. The Federal government has an aim to build 1.2 million, new, well-located homes over five years. There has been more focus on housing in the current term of government than any before. We look at how housing supply has responded to the various policy initiatives and incentives in this Econosights.
Housing demand and supply in Australia
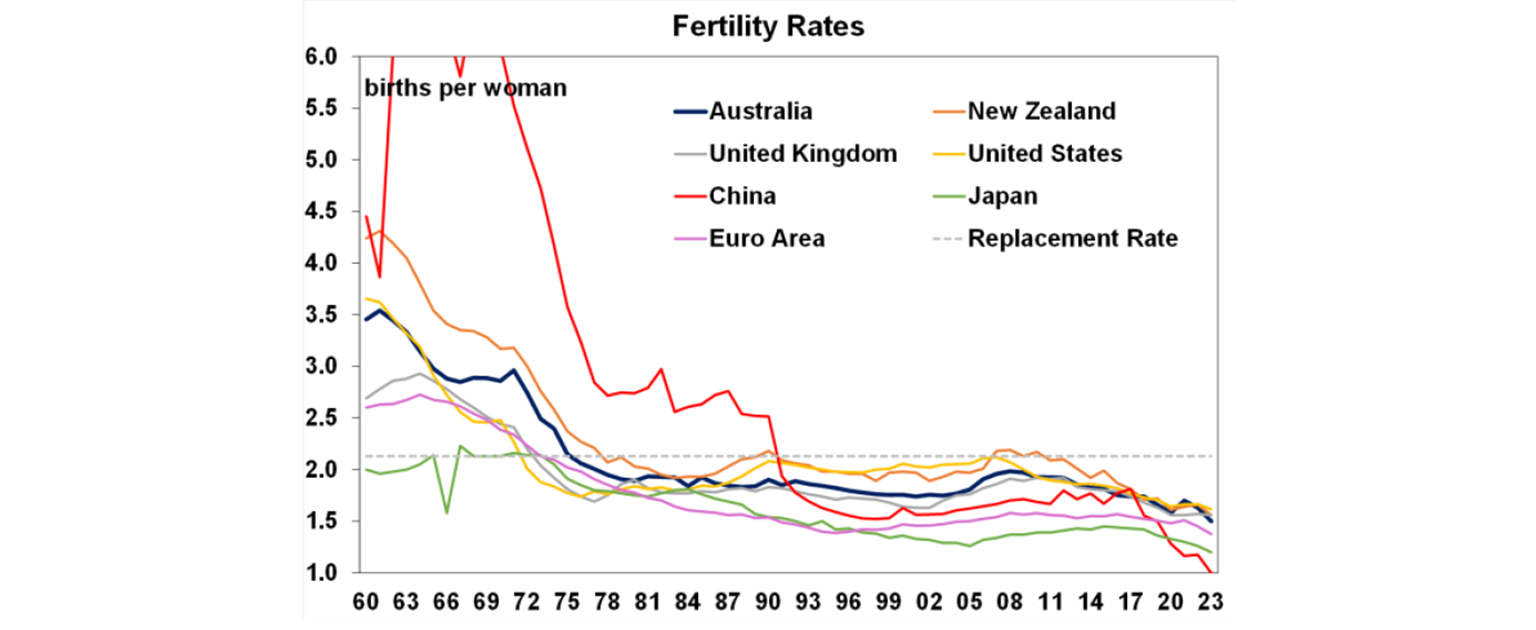
The demand for housing is determined quite simply by how fast the population grows, which is the combination of natural increase and net migration. Australia’s birth rate has declined to below replacement rate over recent decades (see the chart below), but it is still in line with OECD peers.
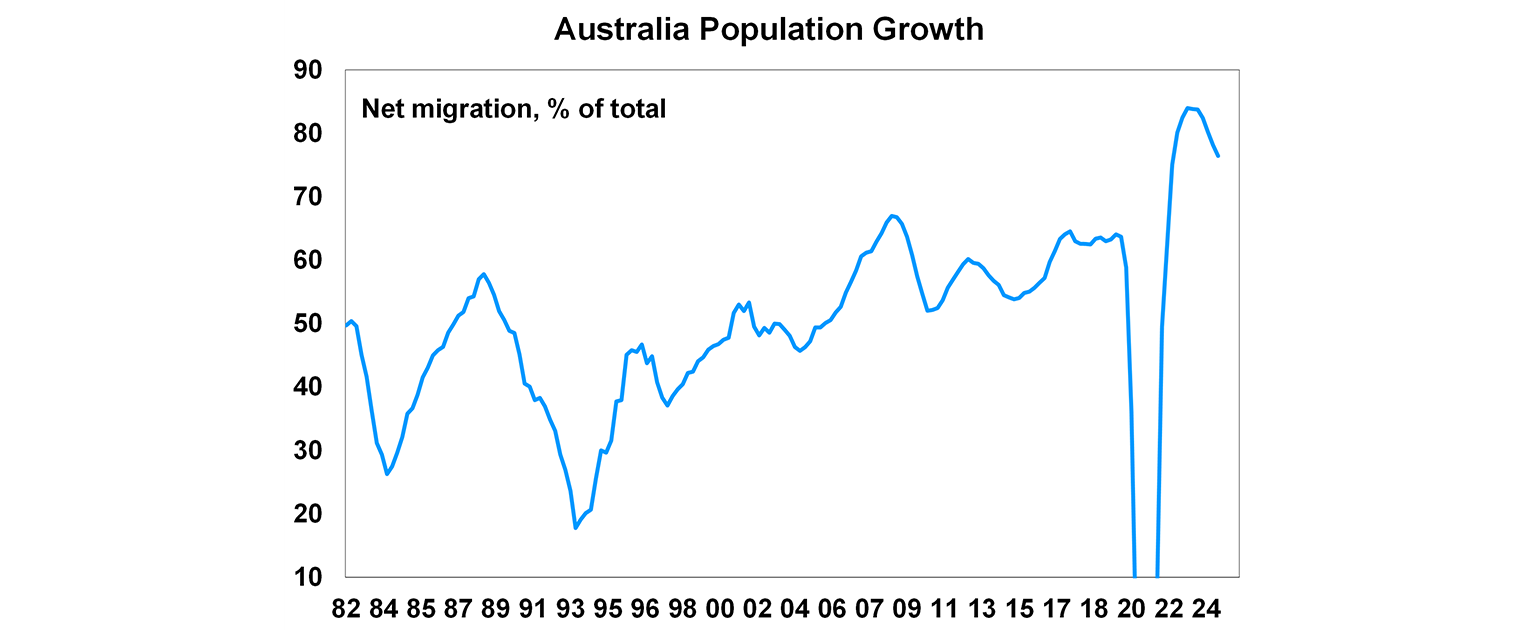
To offset this low level of natural increase, net migration plays a larger role in bringing in working-age immigrants. Net overseas migration (permanent and long term arrivals minus departures) is accounting for a growing share of Australia’s population increase. Over the 12 months to December, 76% of our population growth (446,000 people or 1.7% over the year) was from net overseas migration, not quite a record high, but near enough!
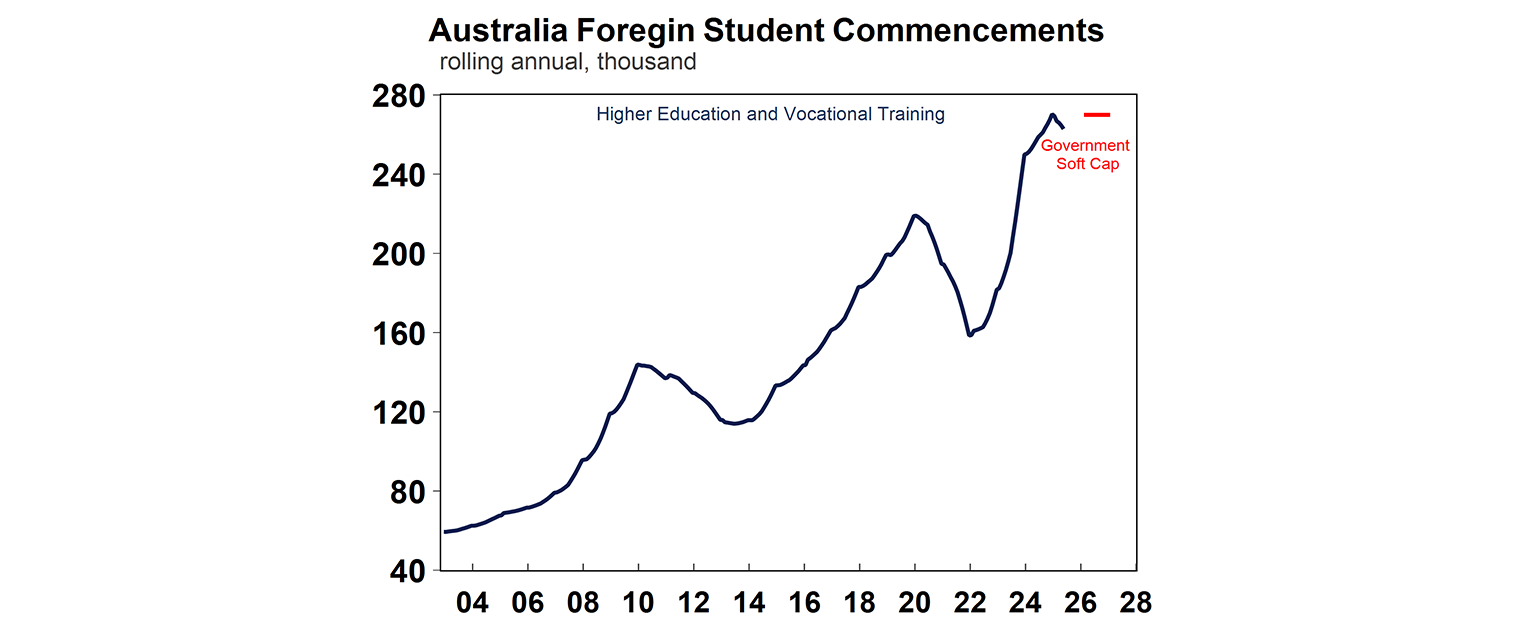
To respond to concerns about high rents and ever increasing home prices the Labor government in 2024 set a cap of 270,000 student commencements (including higher education and vocational students). There was a lot of anger from education providers around this cap (as international students are a big source of income for tertiary education providers and are in the top 5 exports for Australia). That’s despite the fact that the cap still keeps student commencements at all-time highs (see the chart below). In reality it was a “soft cap” because they are not legally enforceable as the Senate rejected the proposal for formal caps, so once an education provider reaches 80% of its target number, student visa applications go into a visa “slow processing lane”. In 2026, the “cap” will be lifted to 295,000.
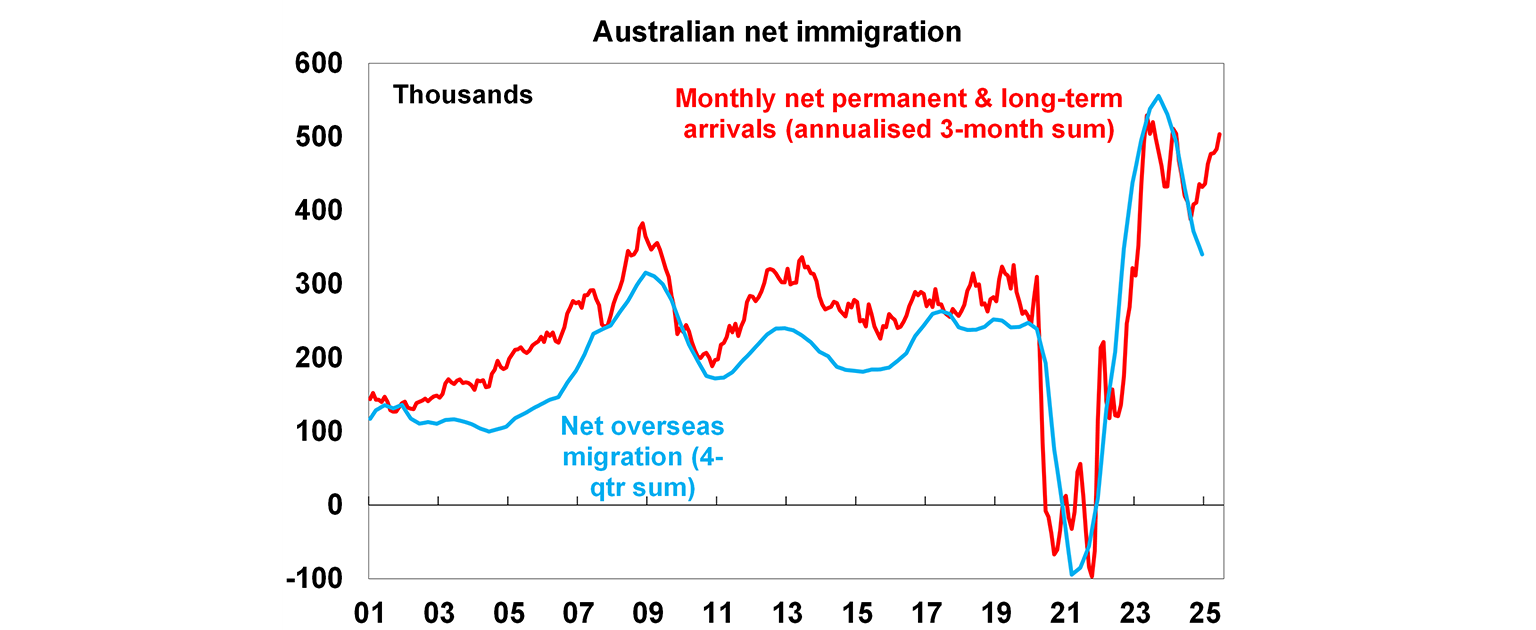
On net migration, the Treasury was estimating that net migration would rise by 335,000 in 24-25 and 260,000 in 25-26. These levels are likely to be breached, with current monthly arrival/departure data trending back up again towards 500,000! (see the chart below).
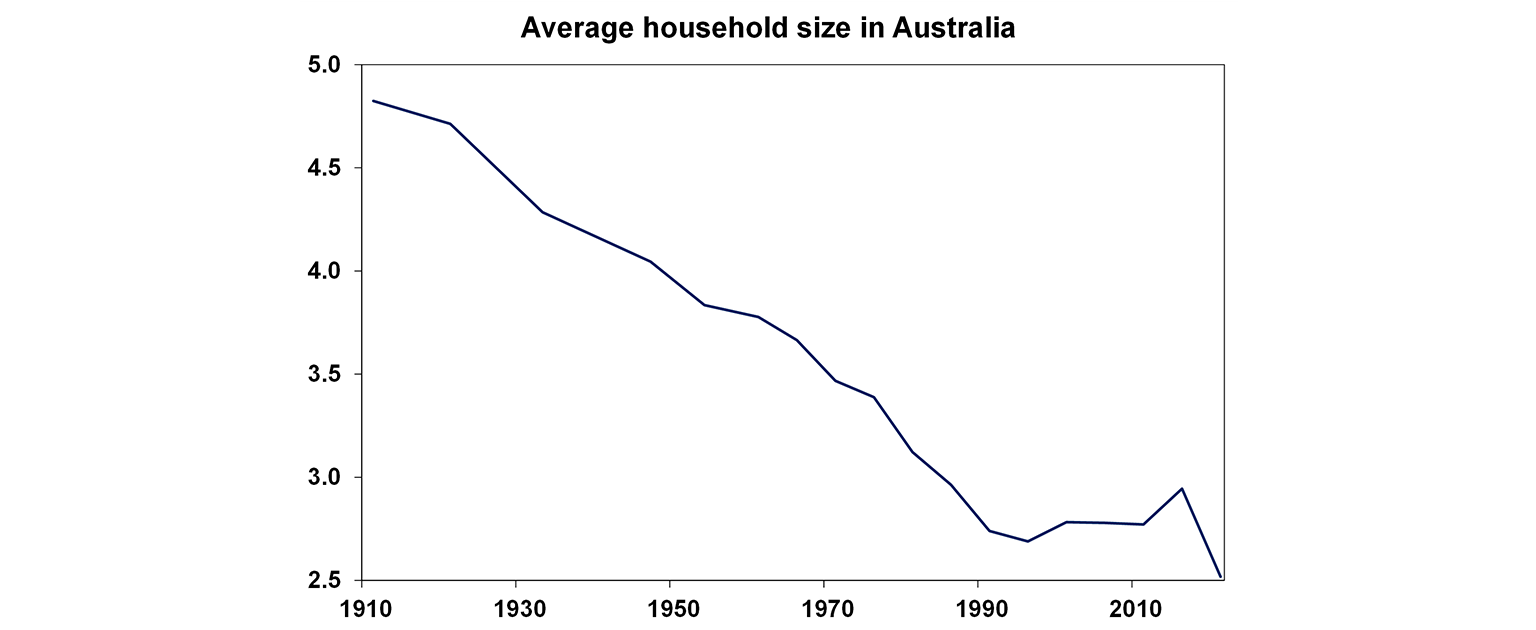
The size of the average household is also important in demand estimates, and it is guesstimated because of the delay in receiving the numbers from the census. In Australia, the average number of people per household has declined from 2.9 persons in 1983 to a little below 2.5 persons in 2022 and going back even further from 4.8 persons per house in 1911. The number of people per household rose in the initial phase of the pandemic and then started declining in 2021 as individuals opted for more living space. The 2025 ABS Census will provide us with another update on household living space. If the size of the household has fallen by more than our assumption in recent years after the pandemic, then there may be a larger level of dwelling undersupply.
The impact of natural increase, net migration and household size means that our estimate is that demand for housing in Australia will average at just under 180,000 for the next few years.
Housing supply is determined by the completion of homes, after taking into account demolitions, conversions and vacant properties (which do not add to new supply). The June housing completions figures are not out yet, but should be running at over 180K, based on building approval figures.
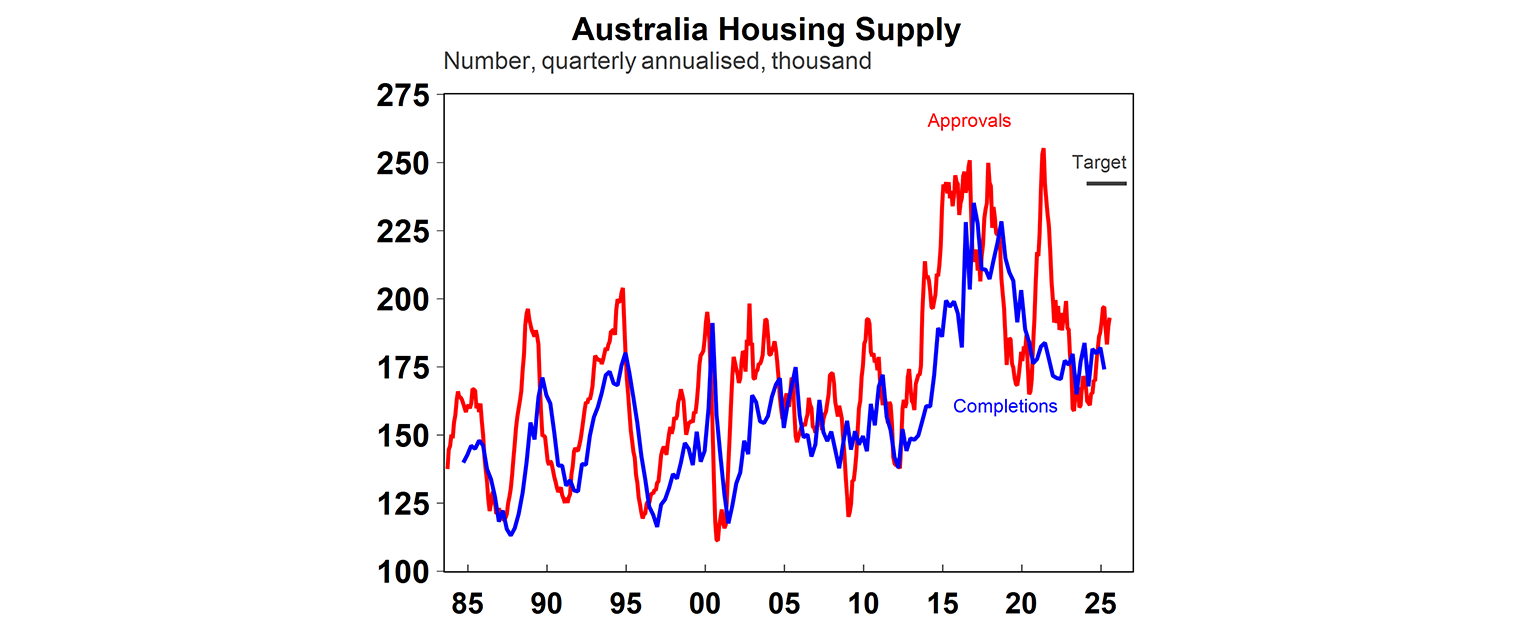
While this would be a lift from recent quarter, it is still below the government’s targeted levels, which are closer to 240,000. Supply has been challenged in Australia because of poor productivity growth in construction, development delays, slow land release, too much regulation and labour and material shortages. While it would be good to see supply running at close to 240,000 per year in the next few years, this will be challenging in the current environment. Our forecasts are for housing completions to average at 190,000 per year, which is a lift of around 10,000 from where we saw supply a year ago.
In Australia, demand for housing started running noticeably above supply from 2006 until 2015. This is when the issue of housing undersupply started. Home price growth was strong over this period, although slowed significantly during the GFC. Supply started running above demand from 2015-2022 thanks to significant multi-density construction which helped to alleviate the housing undersupply. However, poor levels of construction in recent years and a catch up in population growth has mean that demand has (again) far outstripped supply, leading to an increase in accumulated housing undersupply. On our estimates, the shortage of dwellings is at least 200,000 (see the chart below).

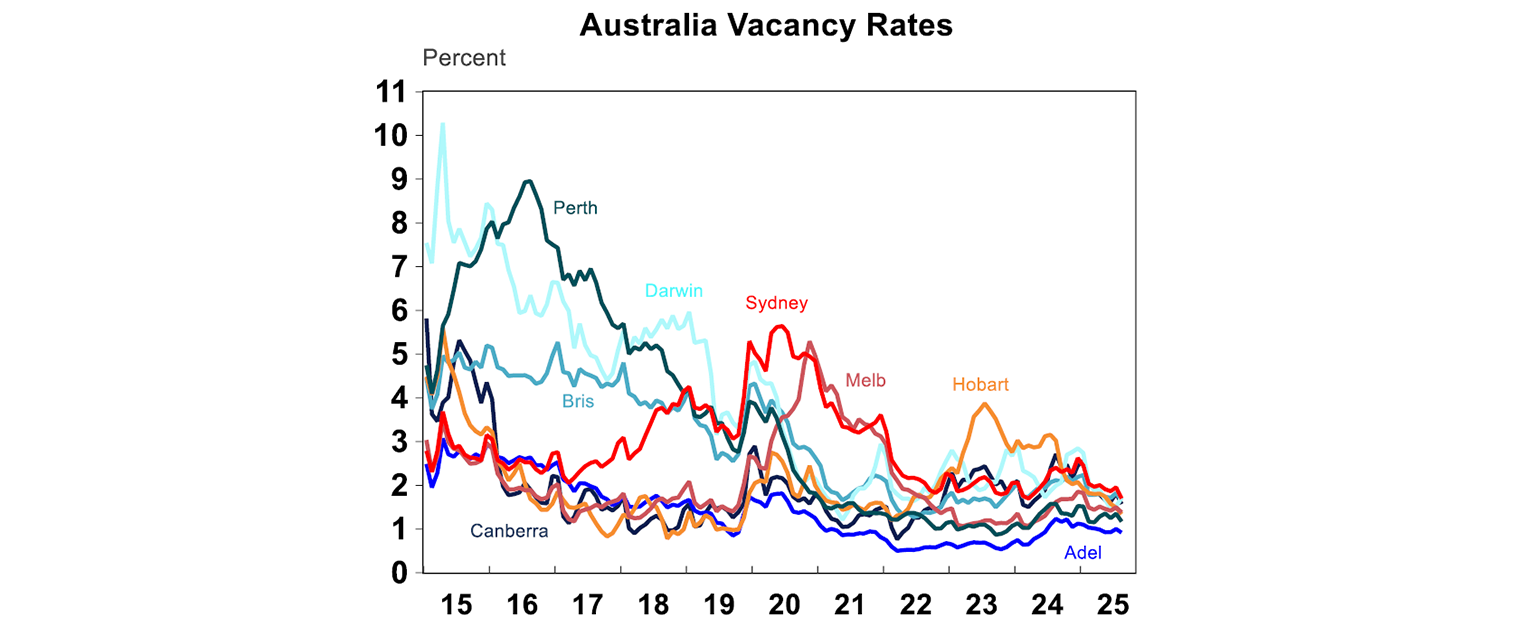
Other indicators of the low supply of homes are in the vacancy rates which are all in a very tight range, at under 2%, a record low for the capital cities.
Productivity in construction
Productivity has been a hot topic in recent months, partly because of the Treasurer’s Economic Reform Round-table but mostly because of the dismal level of productivity growth in Australia (labour productivity has averaged at 0.3% per year over the last decade)! But productivity in construction has had one of lowest levels of performance across all industries. Labour productivity in construction has grown by just 15% since 1994, compared to the average of 46% - see the chart below.
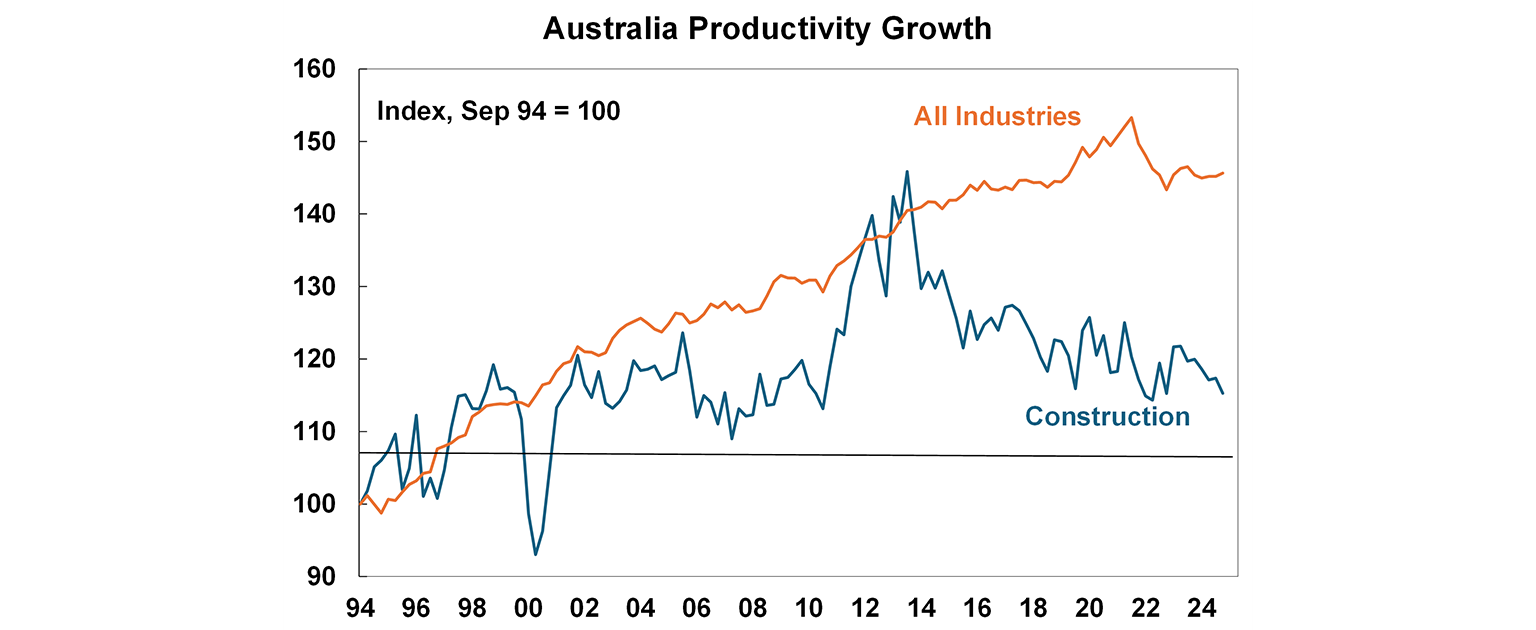
The Productivity Commission found that productivity was particularly weak in house and apartment construction. The number of dwellings completed per hour worked for housing construction worked has declined by 53% over the past 30 years. Accounting for quality and size improvements, it is down by 12%. In contrast, total labour productivity has increased by 49% over this period. CEDA and the Productivity Commission have noted numerous factors contributing to this including: the small size of firms (due to tax incentives) leading to a problem with scale and ability to invest and regulatory burden with development, planning and construction rules (CEDA gives the example that a development application for a 3-storey block of apartments in Sydney in 1967 was 12 pages long and these days it would be hundreds if not thousand pages long due to extensive structural, environmental, traffic and heritage assessments.
Unless productivity improves in construction, Australia will not be able to meet its goals for housing supply. Hopefully we are on the right path to alleviating some of the roadblocks following the productivity round table, but it will take time to work its way through the economy. The government’s decision to freeze the National Construction Code until mid-2029 (excluding essential safety and quality changes) is a good first step. Other measures in the near-term to speed up construction could be to speed up and simplify approvals could be to use AI to fast-track the multi-stage approval process.
Government initiatives to increase housing supply
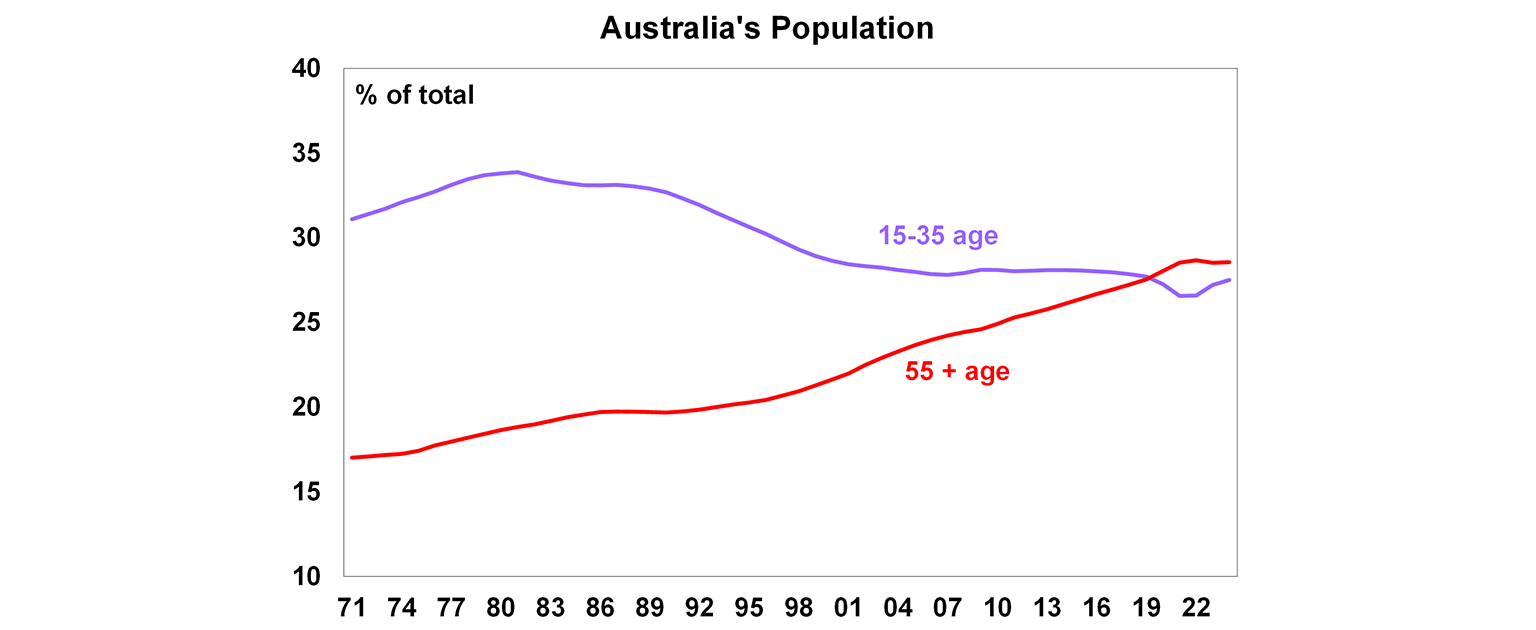
Arguably, the Labor government has paid housing affordability more attention than any other recent government, probably because the issue of housing affordability has now reached an even more critical point with home price growth surging by 19% since the 2023 post-pandemic low. Younger age groups are trending up again as a share of the population, after a downtrend since the 1980’s (see the chart below) and is close to the share of the population aged over 55 now.
The Federal government has the national housing policy responsibility and the coordination between the states and territories. The state governments are the ones that need to deliver housing and homelessness services. The National Housing Accord signed in 2024 is an agreement to build 1.2million homes over the 5 years from mid-2024 until mid-2029, providing multiple payments state and territory governments to meet supply goals. Additionally, there has been more funding allocated for social and affordable housing in the Budget, build-to-rent housing (housing that is specifically built for those wanting to rent although this is only a few thousand homes a year), expansion in the Help to Buy scheme, where the government takes an equity share for buyers with a small deposit as well as the recently expanded Home Guarantee scheme for First Home Buyers that allows first home buyers to buy a property with only a 5% deposit, avoiding lenders mortgage insurance. Although the impacts of the first home buyer scheme are mixed. In the short-term, it may add to demand in the new purchasing market but in the longer-term, it may help to lift supply as demand for dwellings increase.
Implications for investors
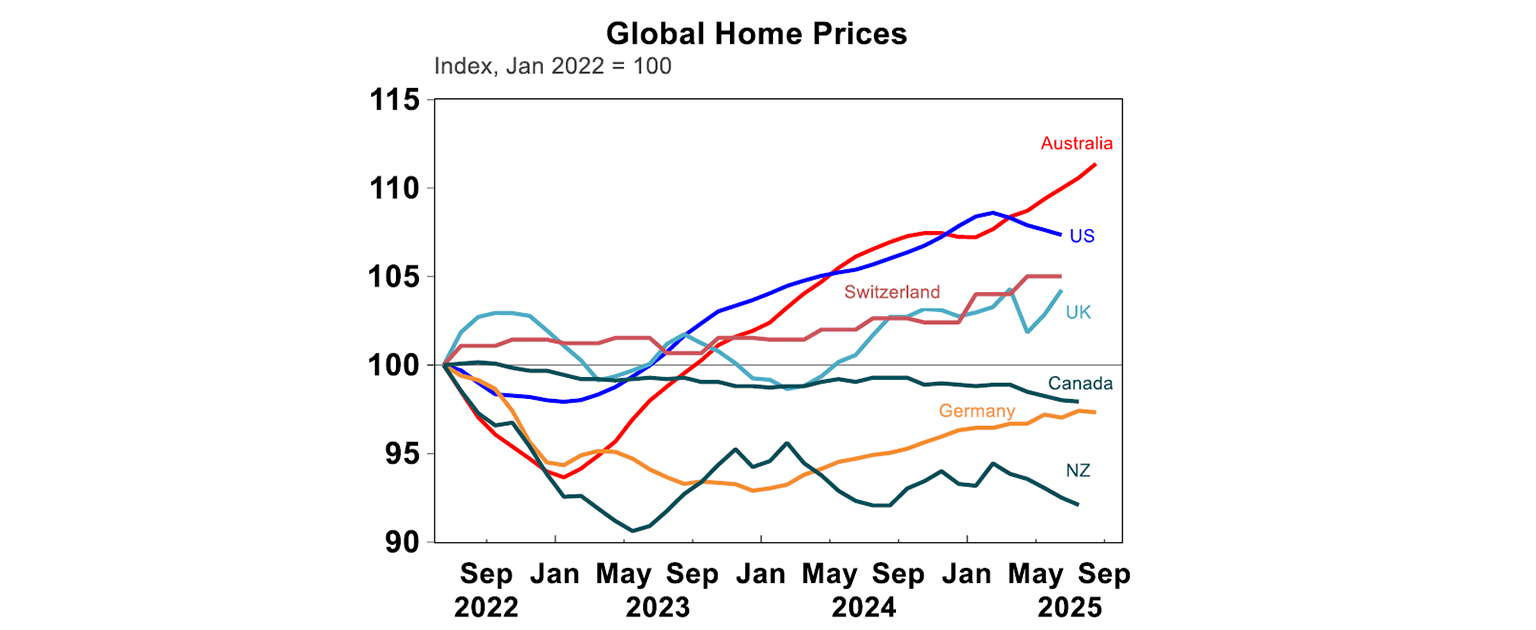
The problems with Australia’s housing supply continues to put upward pressure on home prices, making Australia’s high home prices even higher and exacerbating affordability problems. Australia’s home price-to-annual wages ratio remains around a record high at nearly 14 times (which means that a median home is worth approximately 14 years of average wages), doubling from ~5 prior to 2000 and above our global peers. In Australia, home prices continued to accelerate in recent years, despite higher interest rates. This is in contrast to neighbouring countries where home price growth has been much slower, or even contracting like Canada, Germany and New Zealand since 2022 and is now turning down in the US.
Home prices are likely to have another strong year of growth as supply is unable to catch up with demand in the short-term, the RBA continues to cut interest rates and first home buyer incentives increase demand. We expect national home price growth to be 7% in 2025 and 8-10% growth in 2026. This means that the home price-to-income ratio will continue to rise, as home prices outpace incomes. Hopefully, housing supply can rise stronger in the coming years but the supply goals in the National Housing Accord are unlikely to be reached.
Diana Mousina
Deputy Chief Economist, AMP
You may also like
-

Weekly market update - 24-07-2026 Renewed global worries weighed on the Australian share market which fell around 0.3%, but with its lower exposure to tech shares providing some protection. -

Oliver's insights Charts to watch 21 July 2026 Share markets had a strong first half despite the oil supply shock as expectations for de-escalation, okay economic data, strong profits and the AI boom provided an offset. -

Weekly market update - 17-07-2026 Following the renewed escalation in the US/Iran conflict, the Strait of Hormuz is effectively closed again with Iran attacking ships and the US attacking Iran and blockading its ports. Both are now back to attacking energy infrastructure which is a signficant & concerning escalation.
Important information
Any advice and information is provided by AWM Services Pty Ltd ABN 15 139 353 496, AFSL No. 366121 (AWM Services) and is general in nature. It hasn’t taken your financial or personal circumstances into account. Taxation issues are complex. You should seek professional advice before deciding to act on any information in this article.
It’s important to consider your particular circumstances and read the relevant Product Disclosure Statement, Target Market Determination or Terms and Conditions, available from AMP at amp.com.au, or by calling 131 267, before deciding what’s right for you. The super coaching session is a super health check and is provided by AWM Services and is general advice only. It does not consider your personal circumstances.
You can read our Financial Services Guide online for information about our services, including the fees and other benefits that AMP companies and their representatives may receive in relation to products and services provided to you. You can also ask us for a hardcopy. All information on this website is subject to change without notice. AWM Services is part of the AMP group.